


Sahajanand Medical Technologies
Engineering Better Heart CareAdvancing Cardiovascular Care
IPO Summary (PrEqT)
Sahajanand Medical Technologies Limited (SMT) designs, manufactures and markets vascular-intervention (VI) and structural-heart (SH) medical devices.
Products include drug-eluting coronary stents, PTCA catheters and drug-coated balloons, the Hydra TAVI valve and Cocoon occluders. FY26 operating revenue rose 18.1% to INR 1,210.5 Cr, EBITDA was INR 170.7 Cr (14.1% margin) and restated PAT reached INR 69.1 Cr (5.7% margin), versus FY24 loss of INR 7.4 Cr.
Its proposed mainboard IPO is an entirely secondary OFS of 13,822,116 shares, worth up to INR 475.5 Cr at INR 344. No offer proceeds accrue to SMT. Product approval, cardiac-device competition, working capital, international market access and healthcare reimbursement remain key diligence areas.
IPO Review Rating
Below Avg
MainboardDelivering Innovative Cardiovascular Solutions for Better Patient Outcomes Worldwide
Sahajanand Medical Technologies offers an established cardiovascular-device platform with INR 1,210.5 Cr FY26 revenue, improving EBITDA and PAT margins, positive cash generation, low customer concentration and a meaningful international footprint across 77 countries. Structural-heart exposure, particularly TAVI and occluders, provides an attractive higher-growth opportunity.
However, valuation is not cheap: the IPO implies approximately 50.6x FY26 P/E and 5.5x P/B, while FY26 RoNW remains only 10.6%. Working-capital intensity, product and regulatory risks also require monitoring. The largest IPO-specific drawback is that the entire INR 475.5 Cr issue is an OFS, providing no growth capital to the Company. The sentiment is positive, but QIB and anchor demand should be assessed before taking an aggressive subscription view.
PARAMETER
WEIGHT
SCORE
KEY FACTORS
Financial Performance
40.0%
3.0/5
Sahajanand has delivered healthy revenue growth, substantial PAT recovery, improving margins, positive operating cash flows and low customer concentration. However, ROE remains moderate, leverage has increased and the business continues to carry relatively high working-capital requirements
Show more
Detailed Analysis
Revenue increased from INR 901.6 Cr in FY24 to INR 1,024.9 Cr in FY25 and INR 1,210.5 Cr in FY26, representing a healthy two-year CAGR of approximately 15.9%.
EBITDA increased from INR 110.0 Cr in FY24 to INR 170.7 Cr in FY26, while EBITDA margin improved consistently from 12.2% to 14.1%, demonstrating gradual operating leverage
The Company moved from a PAT loss of INR (7.4) Cr in FY24 to PAT of INR 25.2 Cr in FY25 and INR 69.1 Cr in FY26, with FY26 PAT margin improving to 5.7%
debt-to-equity increased from 0.2x in FY24 to 0.2x in FY25 and 0.3x in FY26, but leverage remains manageable despite the increase in absolute net debt
ROE improved materially from (2.3%) in FY24 to 3.7% in FY25 and 10.4% in FY26, reflecting the Company's profitability turnaround, although returns remain moderate
Operating cash flow remained positive and increased from INR 41.1 Cr in FY24 to INR 73.5 Cr in FY25 and INR 105.2 Cr in FY26, exceeding FY26 PAT and supporting earnings quality
No single customer contributed 10.0% or more of consolidated revenue in FY24, FY25 or FY26, indicating a well-diversified customer base and limited dependence on any individual customer
Industry
15.0%
4.0/5
Sahajanand benefits from growing cardiovascular treatment volumes, increasing adoption of minimally invasive therapies and particularly strong structural-heart growth. Its broad international presence is attractive, while stringent regulation, pricing pressure, clinical risk and rapid technological change remain important constraints
Show more
Detailed Analysis
India's vascular-interventional-device market is projected to grow at 7.2% CAGR during 2025–2030, while the higher-growth Indian structural-heart-device market is projected at 23.3% CAGR
Coronary stents represent a relatively established medical-device segment, while TAVI, occluders and other structural-heart products remain earlier-stage, high-growth categories benefiting from increasing adoption of minimally invasive procedures
Cardiovascular devices require stringent clinical, manufacturing and product approvals across jurisdictions, creating meaningful compliance and recertification risk but also establishing barriers to entry
Management
15.0%
4.0/5
Sahajanand has experienced promoters and senior industry professionals, with no pledge on the offered shares and manageable related-party exposure. Governance deductions arise from only 37.5% Board independence, certain disclosed litigation and historical compliance issues, and the 100.0% OFS structure
Show more
Detailed Analysis
MD & CEO Bhargav Kotadia has approximately 13 years of healthcare-management experience, while Dhirajlal Kotadia has been associated with the Company for over 22 years; the Board also includes substantial global medical-device expertise
Three of the Company's eight Directors are Independent Directors, resulting in 37.5% Board independence, including one woman Independent Director
The shares offered through the OFS are not pledged or encumbered. Promoter litigation appears limited, although criminal complaints relating to external companies involve Non-Executive Director Abhishek Kabra, and historical exchange-control non-compliances have been disclosed
FY26 related-party transactions include capital purchases, remuneration and other expenses, but the disclosed external related-party amounts are relatively modest compared with INR 1,210.5 Cr of consolidated revenue
Valuation
20.0%
2.0/5
Sahajanand is not inexpensive on trailing P/E or P/B, particularly given its 10.6% RoNW. EV/EBITDA appears more reasonable relative to peers, while current GMP provides some support. The absence of fresh-capital accretion is a clear valuation negative.
Show more
Detailed Analysis
Sahajanand's 50.6x post-issue P/E is approximately 15.4% above the 43.9x peer average, while the diluted-EPS-based multiple is even higher at 53.1x
Sahajanand's estimated 21.6x EV/EBITDA is approximately 23.4% below the current two-peer average of about 28.2x, providing some relative valuation suppor
The IPO is valued at approximately 5.5x FY26 book value, with no post-issue reduction because the Company receives no fresh equity capital
FY26 RoNW improved to 10.6%, broadly in line with the selected listed peers but not high enough to justify a large valuation premium independently
Merchant Banker Track Record
10.0%
4.0/5
Sahajanand has a strong four-BRLM consortium with extensive Mainboard execution experience. Recent listing performance is positive overall, with approximately 69.2% positive openings, although the average gain is moderate and historical subscription data is unavailable in the RHP
Show more
Detailed Analysis
The four BRLMs' latest RHP-disclosed samples generated an observation-weighted average opening gain of approximately 8.1%, led by Motilal Oswal's stronger recent listing performance
Comparable historical subscription multiples are not disclosed in the RHP's BRLM track-record tables, so this parameter remains pending
Approximately 69.2% of the latest banker-level IPO observations opened above issue price, with Motilal Oswal and HSBC each recording 80.0% positive-opening rates
TOTAL
100%
3.2/5
Weighted Composite Score
Issue Price
₹327.0 to ₹344.0
As of 13 Oct 2026
GMP
₹40.0
As of 13 Oct 2026
Estimated Gain / Loss
+11.6%
Lot Size
43.0 Shares
Grey Market Premium (GMPs) are shared for knowledge purpose only. PrEqt doesn’t promote or execute the trades.
| Issue Size (in Cr) | |
|---|---|
| Overall | ₹475.0 Cr |
| Fresh Issue | - |
| Offer for Sale | ₹475.0 Cr |
Minimum Investment
₹14,792.0 / 1,849 shares

Merchant Banker
Motilal Oswal Investment Advisors Ltd.
Motilal Oswal Investment Advisors Ltd.
IPO Document
Offer Start Date
Offer End Date
Valuation
Revenue (FY'26)
PAT (FY'26)
Issue Size (in Cr)
Face Value
₹ 1.0Offer Price
₹ 344.0Lot Size
43.0 sharesSale Type
OFS onlyPAT (FY'26)
₹ 69.1 CrPAT Margin (FY'26)
5.7 %P/E Multiple
50.6xEBITDA (FY'26)
₹ 170.7 CrCAGR Growth 2Y
15.9 %ROE (FY'26)
10.4 %ROCE (FY'26)
11.6 %Price to Book Value
5.5xDebt/Equity
0.3xCompany Website
www.smtpl.comExplore new deals
Overview
Fund Allocation
Total: ₹0 CrSource:Company DRHP
Timeline
IPO Open Date
To Be Announced
IPO Close Date
To Be Announced
Tentative Allotment
To Be Announced
Initiation of Refunds
To Be Announced
Credit of Shares to Demat
To Be Announced
Tentative Listing Date
To Be Announced
Business
Business Model
Geographical Presence
Sales Channel
Key Risk Factors
Financial Highlights
Income Statement
Revenue growth with EBITDA and PAT margins
| Financial Metric | FY 2024 | FY 2025 | FY 2026 |
|---|---|---|---|
| Revenue (₹ Cr) | 901.6 | 1,024.9 | 1,210.5 |
| Growth (%) | - | 13.7% | 18.1% |
| EBITDA (₹ Cr) | 110.0 | 128.0 | 170.7 |
| EBITDA Margin (%) | 12.2% | 12.5% | 14.1% |
| PAT (₹ Cr) | -7.4 | 25.2 | 69.1 |
| PAT Margin (%) | -0.8% | 2.5% | 5.7% |
OBSERVATIONS & INSIGHTS
Revenue increased from INR 901.6 Cr in FY24 to INR 1,024.9 Cr in FY25 and INR 1,210.5 Cr in FY26, registering growth of 13.7% and 18.1%, respectively. FY25 growth was primarily driven by higher international sales, particularly in Europe (+26.9%) and Rest of World (+13.9%), supported by 42.3% growth in structural-heart devices. In FY26, growth accelerated due to higher sales volumes across product categories, with Europe growing 38.6%, structural-heart devices 29.1% and other products approximately 38.8%. However, Indian revenue declined 1.4% in FY26, indicating that international markets were the principal growth drivers
EBITDA margin improved from 12.2% in FY24 to 12.5% in FY25 and 14.1% in FY26. The sharper FY26 expansion was supported by lower other expenses relative to revenue, as their growth remained below sales growth. However, employee expenses increased 20.3% during FY26, primarily due to annual salary increments and recruitment, with employee headcount increasing from 1,458 to 1,517
PAT margin expanded from negative 0.8% in FY24 to 2.5% in FY25 and 5.7% in FY26, supported by improved EBITDA margins and lower net tax expenses. In FY26, total tax expenses declined 28.4% despite higher profitability, primarily because of the INR 8.7 Cr earlier-year tax credit arising from reversal of provisions following reductions in tax demands
Balance Sheet
| Financial Metric | FY 2024 | FY 2025 | FY 2026 |
|---|---|---|---|
| Net Worth | ₹ 526.3 Cr | ₹ 545.2 Cr | ₹ 616.1 Cr |
| Total Assets | ₹ 970.6 Cr | ₹ 1,094.9 Cr | ₹ 1,276.4 Cr |
| Total Borrowing | ₹ 175.3 Cr | ₹ 225.0 Cr | ₹ 269.5 Cr |
| Reserves & Surplus | ₹ 556.6 Cr | ₹ 580.7 Cr | ₹ 692.5 Cr |
OBSERVATIONS & INSIGHTS
Net Worth: Increased 17.1% from ₹526.3 Cr in FY24 to ₹616.1 Cr in FY26, reflecting a strengthening capital base and improved financial position
Total Assets: Grew 31.5% from ₹970.6 Cr to ₹1,276.4 Cr, indicating significant balance sheet expansion over the two-year period
Total Borrowings: Rose 53.7% from ₹175.3 Cr in FY24 to ₹269.5 Cr in FY26. Borrowings-to-net-worth increased from 0.33x to 0.44x, indicating rising financial leverage
Reserves & Surplus: Increased 24.4% from ₹556.6 Cr to ₹692.5 Cr, reflecting growth in accumulated reserves and strengthening the company's overall equity position
Cash Flow
| Financial Metric | FY 2024 | FY 2025 | FY 2026 |
|---|---|---|---|
CFO in Cr Cash generated from core business operations. | +41.1 Cr | +73.5 Cr | +105.2 Cr |
CFI in Cr Cash used in / generated from investing activities. | -42.5 Cr | -48.9 Cr | -130.0 Cr |
CFF in Cr Cash from / used in financing activities. | +13.1 Cr | +5.8 Cr | -12.0 Cr |
Working Capital
| Efficiency Metric | FY 2023 | FY 2024 | FY 2025 |
|---|---|---|---|
Debtor Days Average number of days taken to collect customer payments. | - | - | - |
Creditor Days Average time taken to pay suppliers and vendors. | - | - | - |
Inventory Days Average number of days inventory remains unsold. | - | - | - |
CCC (Cash Conversion Cycle) (Debtor Days + Inventory Days - Creditor Days) | - | - | - |
Financial Ratios
Measures the company’s leverage relative to shareholder equity.
OBSERVATIONS & INSIGHTS
The current ratio improved from 1.6x in FY25 to 1.7x in FY26, as growth in inventories, receivables and financial investments outpaced the increase in current liabilities
Net debt/equity increased from approximately 0.2x in FY25 to 0.3x in FY26, driven by higher borrowings for operational requirements and capital expenditure, alongside lower cash balances
ROE improved from negative 2.3% in FY24 to 10.4% in FY26, primarily driven by the turnaround in profitability and stronger earnings attributable to shareholders
ROCE improved from 8.1% in FY24 to 11.6% in FY26, supported by higher operating earnings and improved utilisation of capital employed
ROA increased from negative 0.8% in FY24 to 5.8% in FY26, as growth in profitability outpaced expansion in total assets
Interest coverage improved from 2.7x in FY24 to 4.3x in FY26, as higher operating earnings more than offset increased borrowing costs
Industry Overview
Industry Drivers
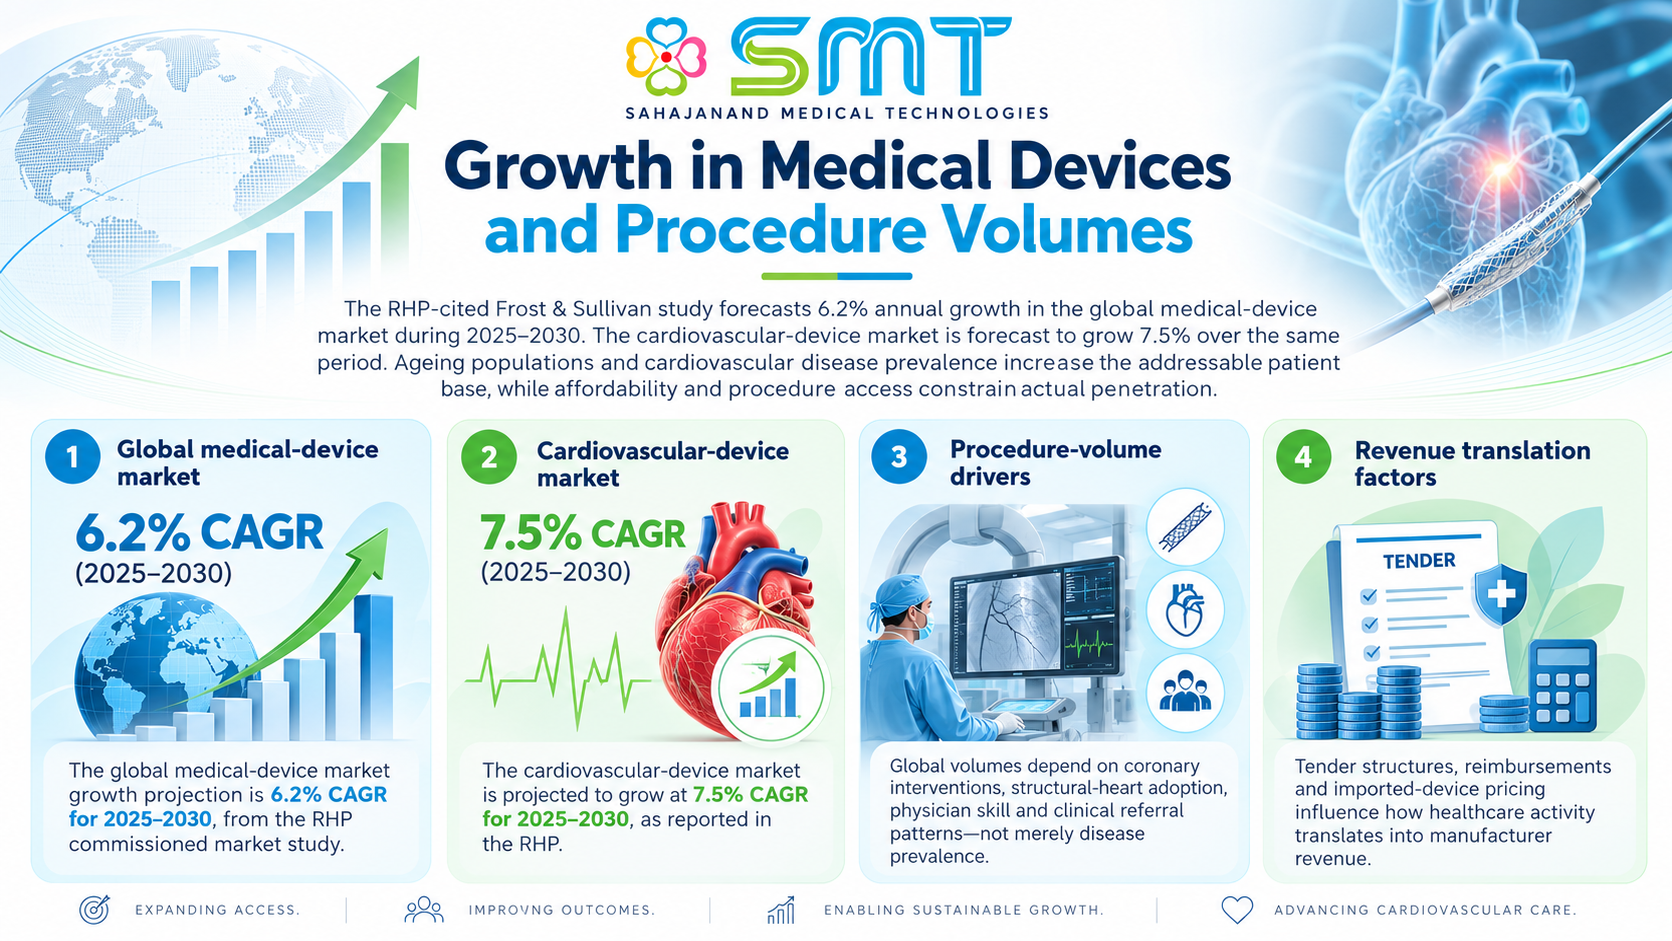
Growth in medical devices and procedure volumes
The RHP-cited Frost & Sullivan study forecasts 6.2% annual growth in the global medical-device market during 2025–2030. The cardiovascular-device market is forecast to grow 7.5% over the same period. Ageing populations and cardiovascular disease prevalence increase the addressable patient base, while affordability and procedure access constrain actual penetration.
The key drivers are:
The global medical-device market growth projection is 6.2% CAGR for 2025–2030, from the RHP commissioned market study
The cardiovascular-device market is projected to grow at 7.5% CAGR for 2025–2030, as reported in the RHP
Global volumes depend on coronary interventions, structural-heart adoption, physician skill and clinical referral patterns, not merely disease prevalence
Tender structures, reimbursements and imported-device pricing influence how healthcare activity translates into manufacturer revenue
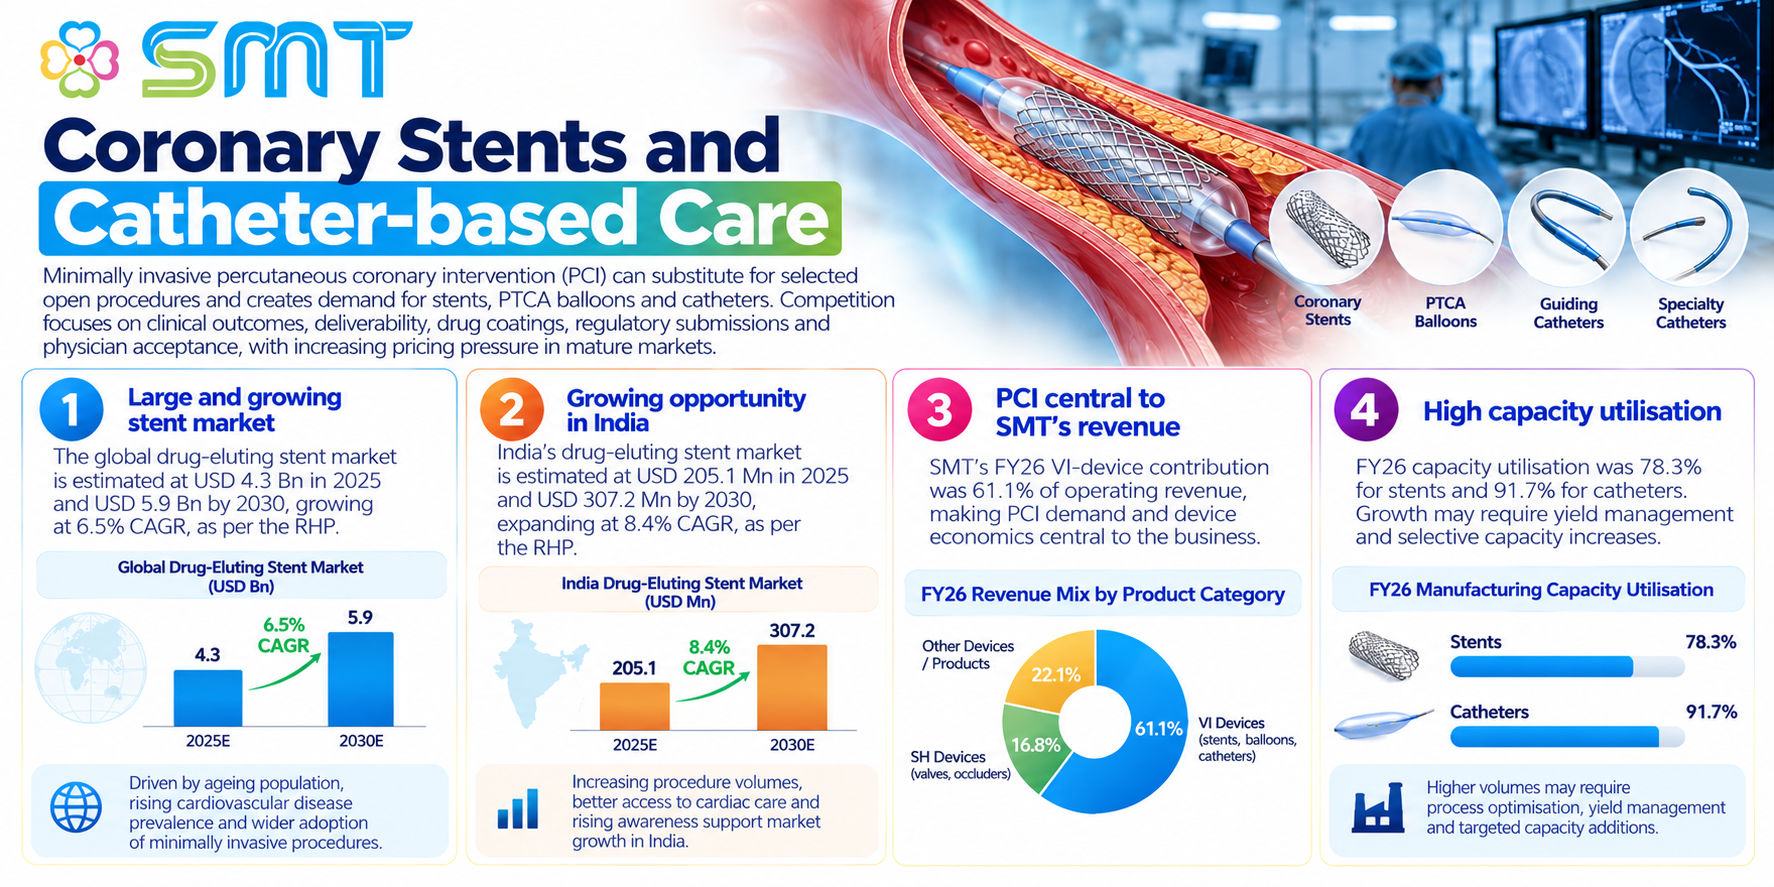
Coronary stents and catheter-based care
Minimally invasive percutaneous coronary intervention can substitute for selected open procedures and creates demand for stents, PTCA balloons and catheters. Competition focuses on clinical outcomes, deliverability, drug coatings, regulatory submissions and physician acceptance, with increasing pricing pressure in mature markets.
The key drivers are:
The RHP estimates the global drug-eluting stent market at USD 4.3 Bn in 2025 and USD 5.9 Bn by 2030
India’s drug-eluting stent market is estimated at USD 205.1 Mn in 2025 and USD 307.2 Mn by 2030
SMT’s FY26 VI-device contribution was 61.1% of operating revenue, making PCI demand and device economics central
FY26 capacity utilisation was 78.3% for stents and 91.7% for catheters; growth may require yield management and selective capacity increases
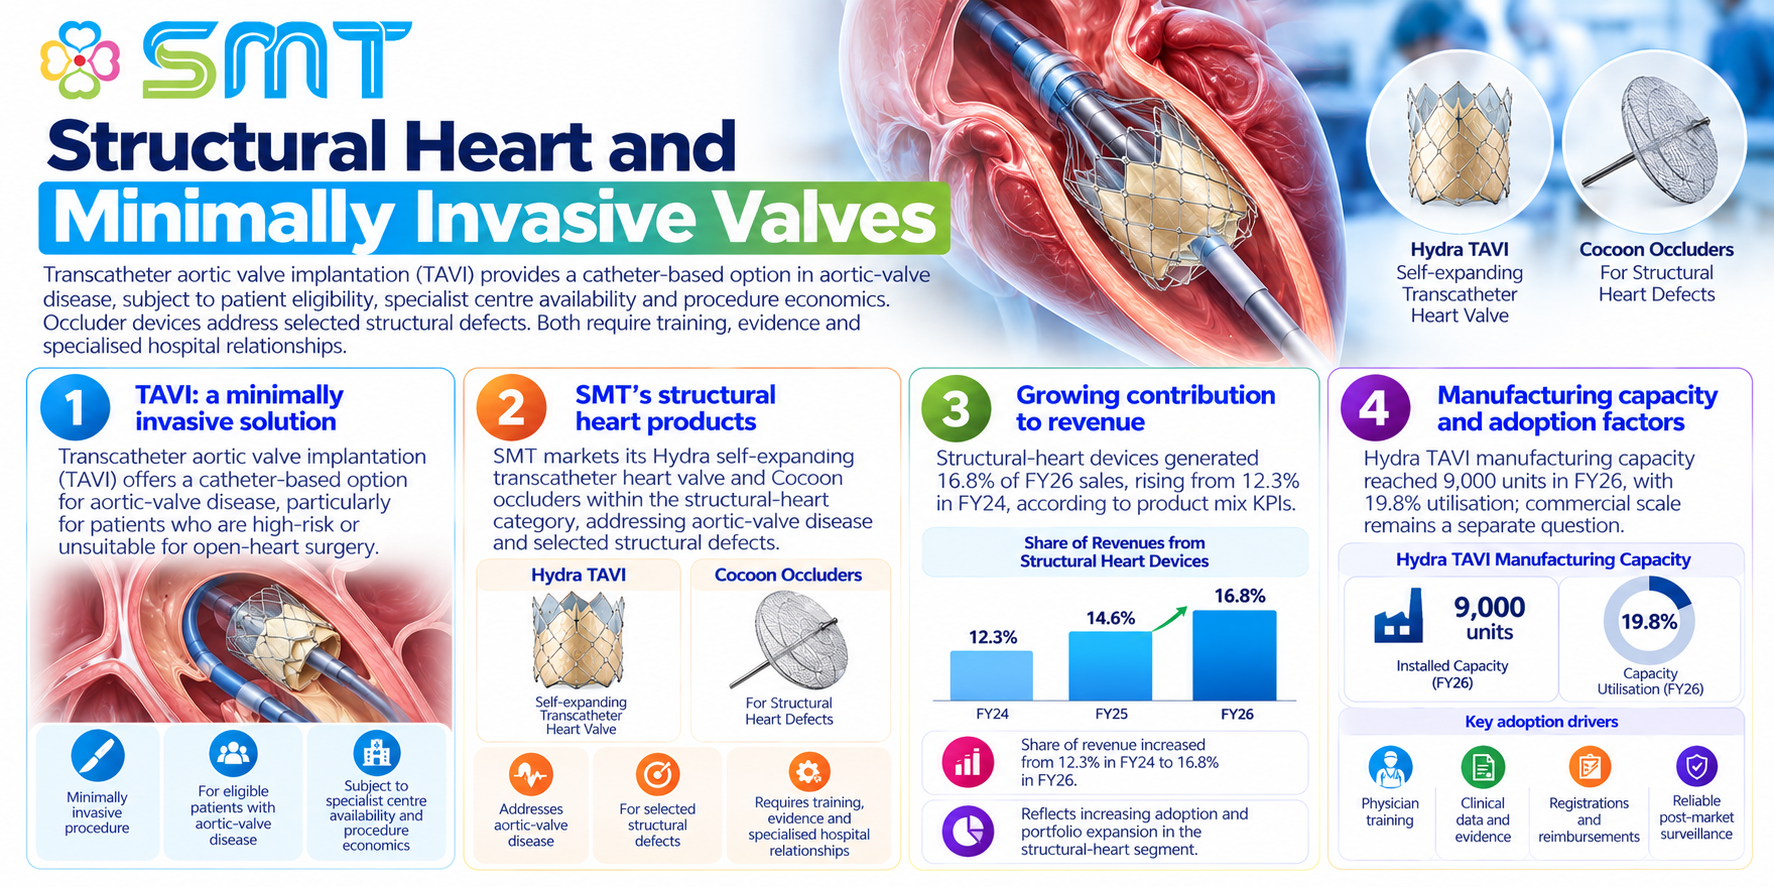
Structural heart and minimally invasive valves
Transcatheter aortic valve implantation (TAVI) provides a catheter-based option in aortic-valve disease, subject to patient eligibility, specialist centre availability and procedure economics. Occluder devices address selected structural defects. Both require training, evidence and specialised hospital relationships.
The key drivers are:
SMT markets its Hydra self-expanding transcatheter heart valve and Cocoon occluders within the structural-heart category
Structural-heart devices generated 16.8% of FY26 sales, rising from 12.3% in FY24, according to product mix KPIs
Hydra TAVI manufacturing capacity reached 9,000 units in FY26, with 19.8% utilisation; commercial scale remains a separate question
Device acceptance is tied to physician training, clinical data, registrations, reimbursements and reliable post-market surveillance
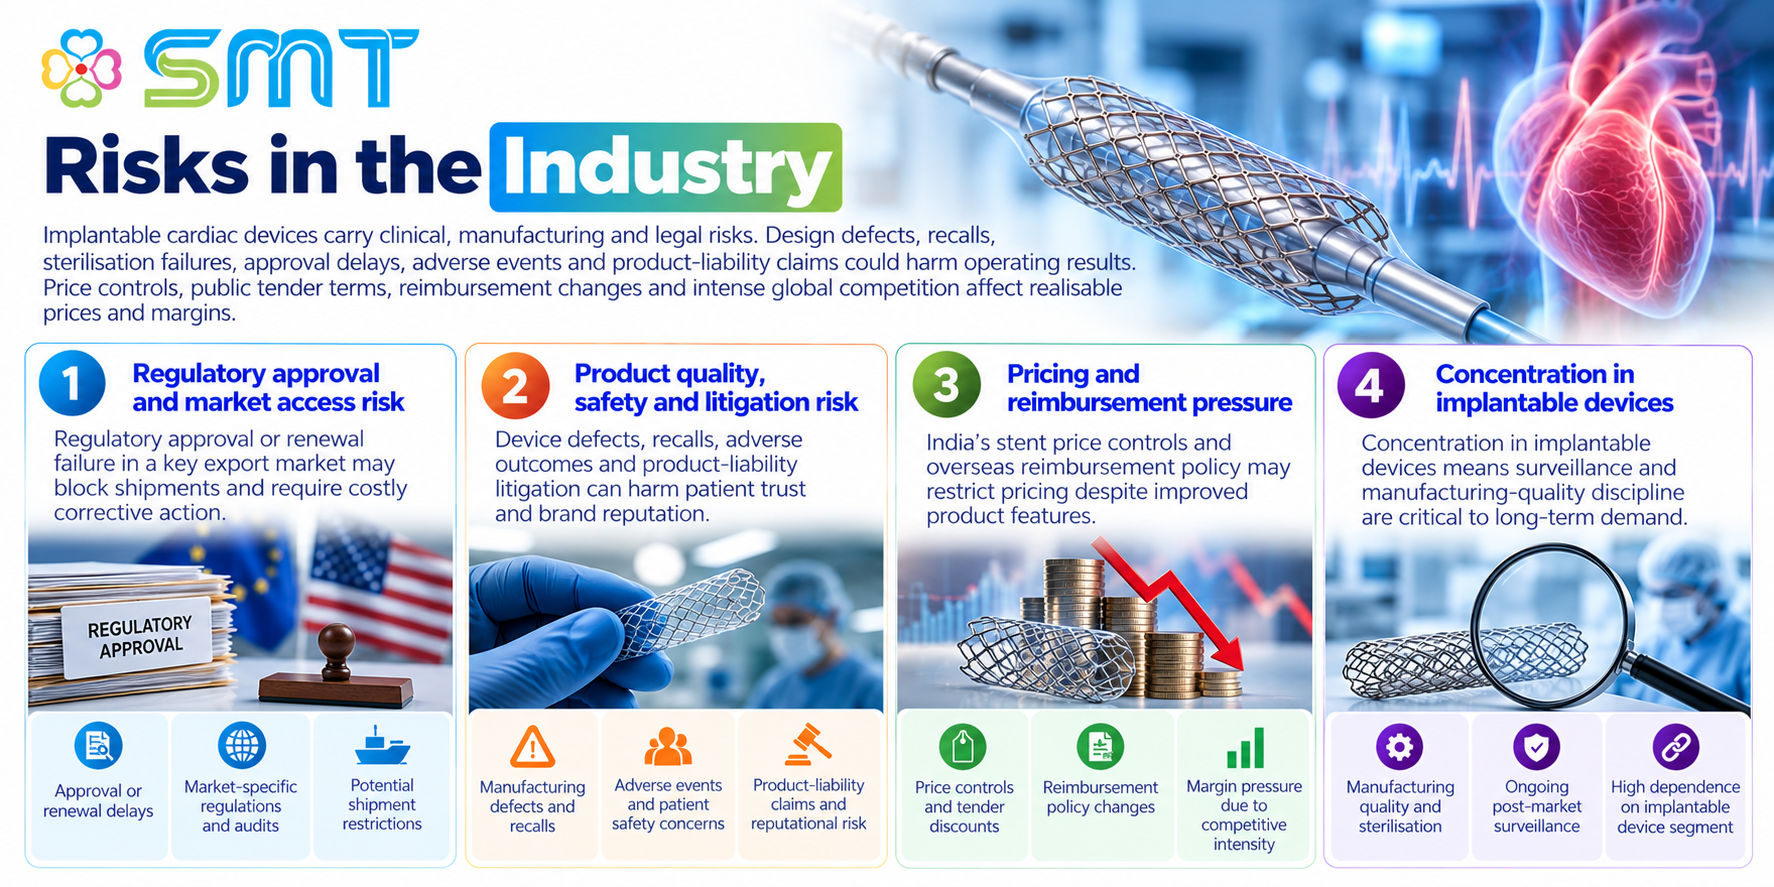
Risks in the Industry
Implantable cardiac devices carry clinical, manufacturing and legal risks. Design defects, recalls, sterilisation failures, approval delays, adverse events and product-liability claims could harm operating results. Price controls, public tender terms, reimbursement changes and intense global competition affect realisable prices and margins.
The key risks are:
Regulatory approval or renewal failure in a key export market may block shipments and require costly corrective action
Device defects, recalls, adverse outcomes and product-liability litigation can harm patient trust and brand reputation
India’s stent price controls and overseas reimbursement policy may restrict pricing despite improved product features
Concentration in implantable devices means surveillance and manufacturing-quality discipline are critical to long-term demand
Government Policy Support
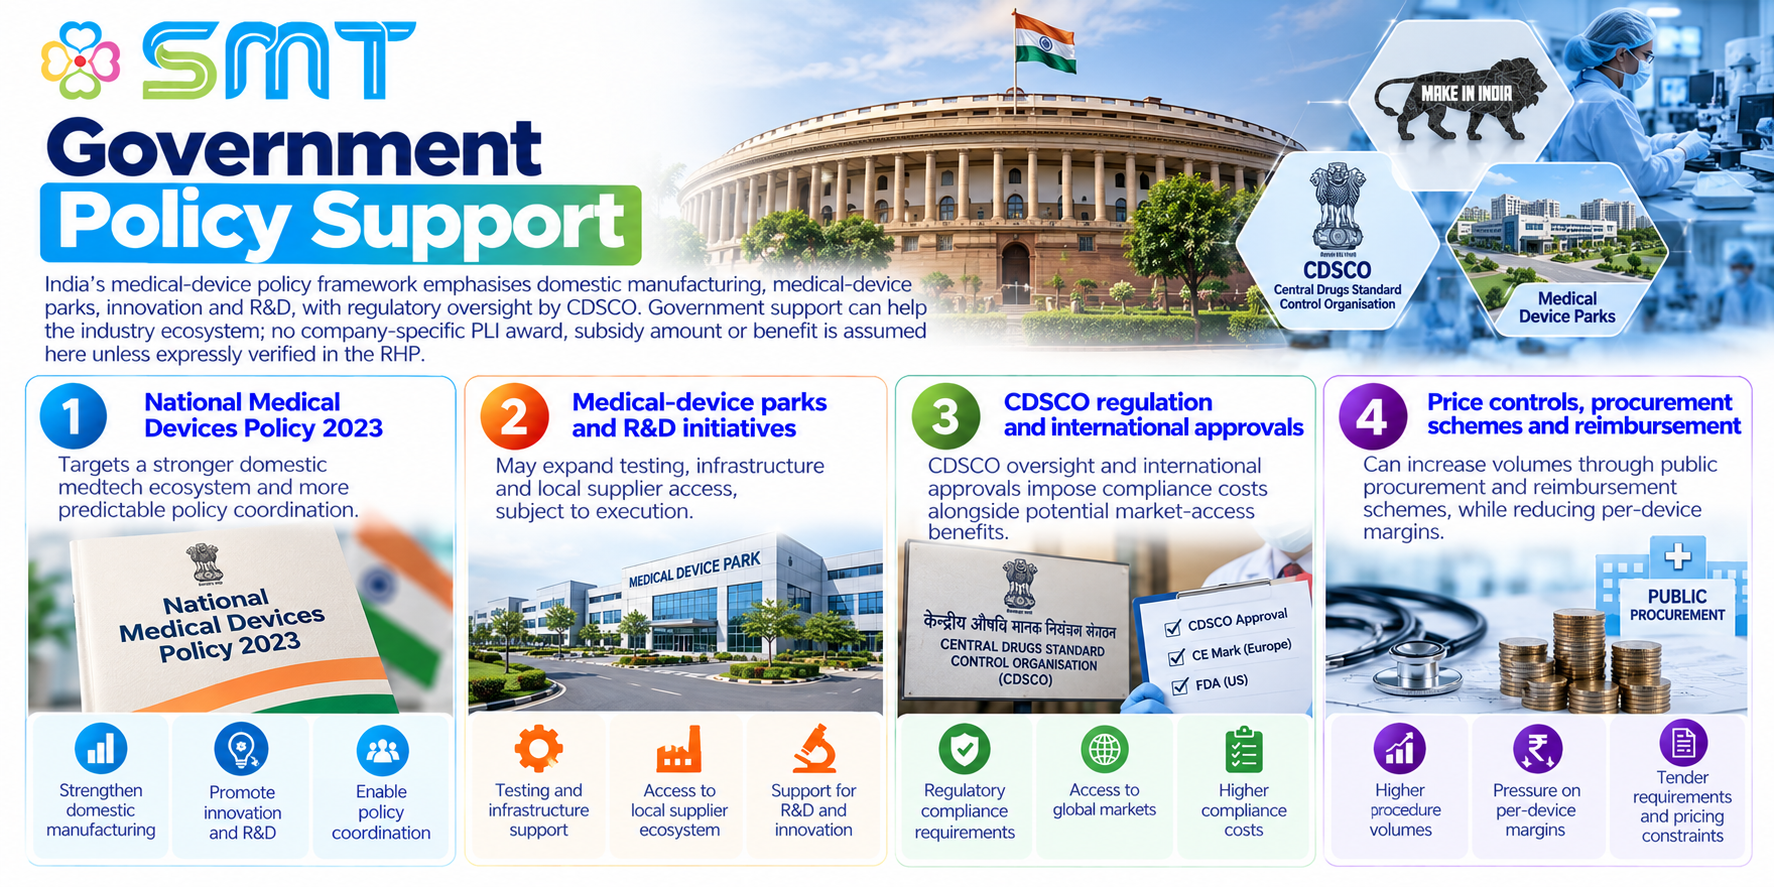
India’s medical-device policy framework emphasises domestic manufacturing, medical-device parks, innovation and R&D, with regulatory oversight by CDSCO. Government support can help the industry ecosystem; no company-specific PLI award, subsidy amount or benefit is assumed here unless expressly verified in the RHP.
The key policies are:
National Medical Devices Policy 2023 targets a stronger domestic medtech ecosystem and more predictable policy coordination
Medical-device parks and R&D initiatives may expand testing, infrastructure and local supplier access, subject to execution
CDSCO regulation and international approvals impose compliance costs alongside potential market-access benefits
Price caps, procurement schemes and public reimbursement can increase volumes while reducing per-device margins
Fundraise/Future Plans
Shareholding
Pre-issue shareholding
Promoter Holding 0.0%
Post-Issue Shareholding
Promoter Holding 0.0%
Category
Pre-Issue%Post-Issue%
Promoters
Shree Hari Trust
36.7%34.0%
Dhirajkumar Savjibhai Vasoya
4.0%2.0%
Total Promoter Holding
40.7%36.0%
Additional Shareholders
Other Shareholders
59.3%64.0%
Total Additional Holding
59.3%64.0%
Total Shareholding
100.0%100.0%
- Overview
- Business
- Financial Highlights
- Industry Overview
- Fundraise/Future Plans
- Documentation
Get the Preqt App and keep in touch around the clock!
 Monitor your investments in real-time.
- Receive tailored deal suggestions.
- Get real-time updates and alerts.
