


Shah Investor's Home
Investing Made SimpleBuilding Wealth with Trust
IPO Summary (PreQT)
Shah Investor's Home Limited (SIHL) is a Gujarat-led full-service retail broker with over three decades of operating history, 38,189 active clients, 181 authorised persons and 11 branches as of FY26. FY26 revenue from operations declined 24.2% YoY to INR 71.5 Cr and PAT fell 43.5% to INR 13.2 Cr as brokerage activity and traded value moderated, although digital brokerage contribution rose to 42.6% and the MTF book more than doubled. At the cap price of INR 167, the fresh-only IPO implies a post-issue market capitalisation of INR 353.3 Cr and FY26 P/E of 19.9x. The investment case combines a sticky relationship-led franchise, strong net-cash balance sheet and MTF/digital expansion, offset by Gujarat concentration, revenue cyclicality, negative operating cash flow, regulatory sensitivity and dependence on authorised persons.
IPO Review Rating
Below Avg
MainboardDelivering Integrated Investment Solutions for India’s Growing Investor Community
Shah Investor's Home has several attractive characteristics: 30%+ EBITDA margins, an 18%+ PAT margin, negligible leverage, 30+ years of operating history, a 100% fresh issue and exposure to a broking industry expected to grow 16–18% annually.
The principal weakness is the direction of recent financial performance. FY26 Revenue fell 24.2%, PAT declined materially, RoE fell to 7.6%, and operating cash flow remained negative for the second consecutive year. The business is also heavily geographically concentrated, with 93.7% of broking revenue originating from Gujarat.
Valuation does not fully compensate for these weaknesses. Post-Issue P/E of 19.9x is approximately 46% above the peer average of 18.4x, although the 1.5x P/B is relatively reasonable and the balance sheet benefits from the entire ₹90.2 Cr issue being fresh capital.
The issue therefore has good structural industry exposure and healthy operating margins, but the FY26 earnings slowdown, cash-flow weakness, geographic concentration, related-party activity and premium earnings valuation prevent a stronger score at this stage. Anchor quality and QIB/overall subscription will be important swing factors before the final view.
PARAMETER
WEIGHT
SCORE
KEY FACTORS
Financial Performance
40.0%
3.0/5
Shah Investor’s Home has strong margins, very low leverage and a sizeable client base. However, FY26 revenue and earnings declined sharply, RoE weakened materially and operating cash flow remained negative for a second consecutive year, creating a clear quality-of-earnings concern
Show more
Detailed Analysis
FY24–FY26 Revenue CAGR is -4.2%; FY26 Revenue declined 24.2% YoY
FY26 EBITDA Margin remained strong at 30.2%
FY26 PAT Margin was 18.2%
FY26 D/E was only 0.1x
FY26 ROE declined to 7.6% from 14.7% in FY25
OCF was –₹19.7 Cr in FY26 and –₹31.9 Cr in FY25
Industry
15.0%
4.0/5
Indian broking has a strong structural growth outlook driven by retail participation, digitalisation and margin funding. SIHL can benefit from these trends, although intense price competition and frequent regulatory intervention remain significant risks for full-service brokerage models
Show more
Detailed Analysis
Indian broking industry expected to grow 16–18% CAGR over the next 2–3 years.
Broking is highly regulated with ongoing SEBI/exchange intervention
SIHL has significant opportunity to diversify beyond Gujarat through digital distribution
Management
15.0%
3.0/5
Governance benefits from 50% Board independence, long promoter experience, no promoter pledge and zero OFS. Offsetting this are material related-party financing flows, disclosed litigation and limited listed-company board experience among several Directors
Show more
Detailed Analysis
Company has 30+ years of broking experience with promoter-led management
4 of 8 Directors are Independent = 50.0%
No promoter pledge; Company has 6 tax + 1 regulatory proceeding involving ₹4.2 Cr
Significant recurring related-party funding flows and other transactions exist
Valuation
20.0%
3.0/5
SIHL's P/B valuation is reasonable and the issue is entirely fresh capital, but the post-dilution P/E of 26.8x represents a substantial premium to its peer average despite FY26 revenue decline and relatively weak 7.35% RoNW
Show more
Detailed Analysis
P/E is 19.9x, 45.7% premium to peer average
1.5x historical P/B / ~1.3x adjusted post-Issue
FY26 ROE only 7.4%
Merchant Banker Track Record
10.0%
3.0/5
Beeline's recent outcomes are positive, but its comparable mainboard track record is too small to draw strong conclusions. Om Power listed 6.3% above issue price with 3.33x subscription; the limited one-issue mainboard sample constrains the track-record score
Show more
Detailed Analysis
Beeline's only listed 2026 mainboard mandate, Om Power Transmission, delivered a +6.3% listing gain/
The same mainboard IPO was subscribed 3.3x overall, including 3.6x QIB and 7.0x NII subscription
Beeline's 2026 mainboard success rate is 100.0% (1 out of 1 listed issue), but the sample size is extremely limited
TOTAL
100%
3.1/5
Weighted Composite Score
Issue Price
₹159.0 to ₹167.0
As of 25 Sep 2026
GMP
₹12.0
As of 25 Sep 2026
Estimated Gain / Loss
+7.2%
Lot Size
85.0 Shares
Grey Market Premium (GMPs) are shared for knowledge purpose only. PrEqt doesn’t promote or execute the trades.
| Issue Size (in Cr) | |
|---|---|
| Overall | ₹90.2 Cr |
| Fresh Issue | ₹90.2 Cr |
| Offer for Sale | - |
Minimum Investment
₹14,195.0 / 7,225 shares

Merchant Banker
Beeline Capital Advisors Pvt. Ltd
Beeline Capital Advisors Pvt. Ltd
IPO Document
Offer Start Date
Offer End Date
Valuation
Revenue (FY'26)
PAT (FY'26)
Issue Size (in Cr)
Face Value
₹ 10.0Offer Price
₹ 167.0Lot Size
85.0 sharesSale Type
Fresh capital onlyPAT (FY'26)
₹ 13.2 CrPAT Margin (FY'26)
18.2 %P/E Multiple
26.8xEBITDA (FY'26)
₹ 21.6 CrCAGR Growth 2Y
-4.2 %ROE (FY'26)
7.6 %ROCE (FY'26)
10.6 %Price to Book Value
1.3xDebt/Equity
0.1xCompany Website
www.sihl.inExplore new deals
Overview
Fund Allocation
Total: ₹0 CrSource:Company DRHP
Timeline
IPO Open Date
To Be Announced
IPO Close Date
To Be Announced
Tentative Allotment
To Be Announced
Initiation of Refunds
To Be Announced
Credit of Shares to Demat
To Be Announced
Tentative Listing Date
To Be Announced
Business
Business Model
Geographical Presence
Sales Channel
Key Risk Factor
Financial Highlights
Income Statement
Revenue growth with EBITDA and PAT margins
| Financial Metric | FY 2024 | FY 2025 | FY 2026 |
|---|---|---|---|
| Revenue (₹ Cr) | 77.8 | 94.3 | 71.5 |
| Growth (%) | 50.6% | 21.1% | -24.2% |
| EBITDA (₹ Cr) | 25.1 | 35.3 | 21.6 |
| EBITDA Margin (%) | 32.3% | 37.5% | 30.2% |
| PAT (₹ Cr) | 17.9 | 23.4 | 13.2 |
| PAT Margin (%) | 22.7% | 24.8% | 18.2% |
OBSERVATIONS & INSIGHTS
FY25 was the strongest year in the restated period: Revenue rose 21.1% and PAT 30.4%, supported by higher brokerage/fees, higher traded value and a 58.6% increase in interest income following MTF introduction and stronger deposit/delayed-payment income
FY26 revenue fell 24.2% as brokerage and commission income declined 29.7% and traded value fell from INR 59,447.0 Cr to INR 44,397.9 Cr; interest income also declined 6.0%
FY26 EBITDA margin compressed to 30.2% from 37.5%
PAT margin fell to 18.2%; ROE and ROCE fell to 7.6% and 10.6% as earnings weakened against a larger equity/capital base
Balance Sheet
| Financial Metric | FY 2024 | FY 2025 | FY 2026 |
|---|---|---|---|
| Net Worth | ₹ 151.5 Cr | ₹ 169.1 Cr | ₹ 180.5 Cr |
| Total Assets | ₹ 298.8 Cr | ₹ 302.6 Cr | ₹ 304.4 Cr |
| Total Borrowing | ₹ 3.5 Cr | ₹ 5.7 Cr | ₹ 18.5 Cr |
OBSERVATIONS & INSIGHTS
The balance sheet is liquid and financial-asset-heavy, consistent with a brokerage/MTF business rather than a fixed-asset-intensive model
Borrowings increased to INR 18.5 Cr in FY26 as the MTF and working-capital book expanded, but liquid assets kept the Company in a net-cash position
Trade receivables increased more than 3x from FY24 to FY26, making collections and client/settlement risk a key balance-sheet watch item
Equity increased through retained earnings; the IPO adds another INR 85.8-90.2 Cr of gross primary capital before issue expenses
Cash Flow
| Financial Metric | FY 2024 | FY 2025 | FY 2026 |
|---|---|---|---|
CFO (₹ Cr) Cash generated from core business operations. | +110.2 Cr | -31.9 Cr | -19.7 Cr |
CFI (₹ Cr) Cash used for investments and long-term assets. | -1.5 Cr | -11.2 Cr | -9.9 Cr |
CFF (₹ Cr) Cash flow related to funding and borrowings. | -7.0 Cr | -1.9 Cr | +8.8 Cr |
Financial Ratios
Measures the company’s leverage relative to shareholder equity.
OBSERVATIONS & INSIGHTS
Liquidity remained comfortable with a current ratio above 1.3x and net-cash position throughout FY24-FY26
Interest coverage remains healthy but declined materially from 26.0x to 8.4x as finance costs rose and EBIT weakened
ROA, ROE and ROCE all declined in FY26, reflecting lower earnings despite higher net worth and capital availability
Industry Overview
Industry Drivers
Digitalisation, Mobile Trading and Algorithmic Execution
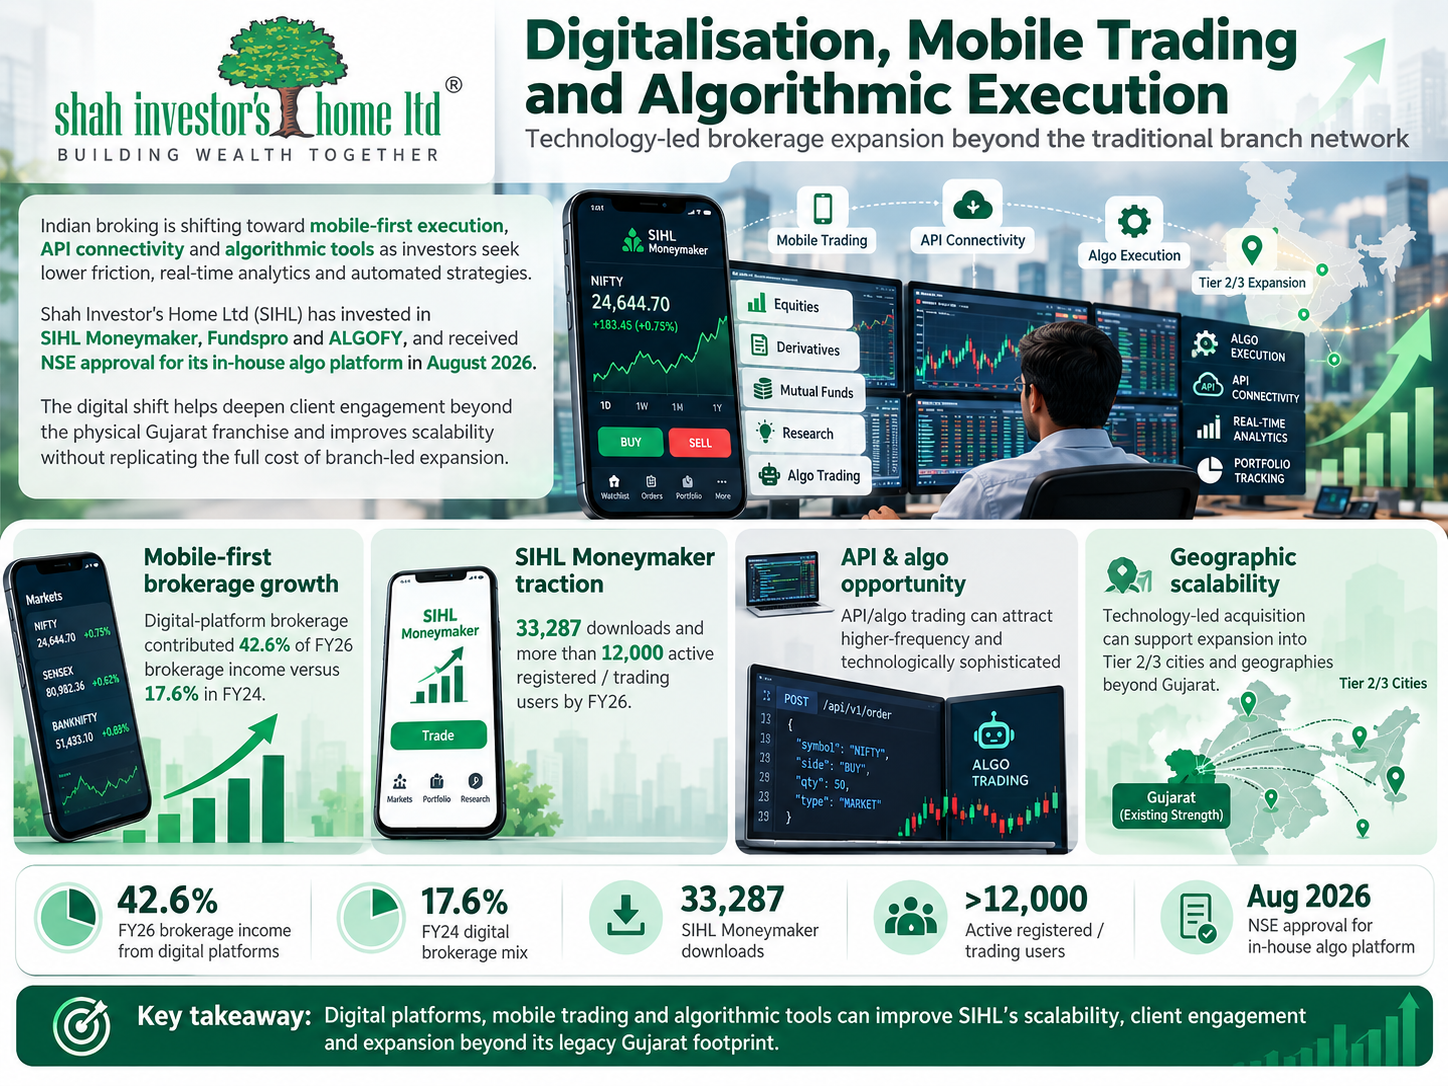
Indian broking is shifting toward mobile-first execution, API connectivity and algorithmic tools as investors seek lower friction, real-time analytics and automated strategies. SIHL has already invested in SIHL Moneymaker, Fundspro and ALGOFY, and received NSE approval for its in-house algo platform in August 2026. The digital shift is strategically important because SIHL can use technology to deepen engagement beyond its physical Gujarat franchise and improve scalability without replicating the full cost of branch-led expansion.
The key drivers are:
Digital-platform brokerage contributed 42.6% of FY26 brokerage income versus 17.6% in FY24
SIHL Moneymaker had 33,287 downloads and more than 12,000 active registered/trading users by FY26
API/algo trading can attract higher-frequency and technologically sophisticated clients
Technology-led acquisition can support expansion into Tier 2/3 cities and geographies beyond Gujarat
Expansion of Margin Trading Funding
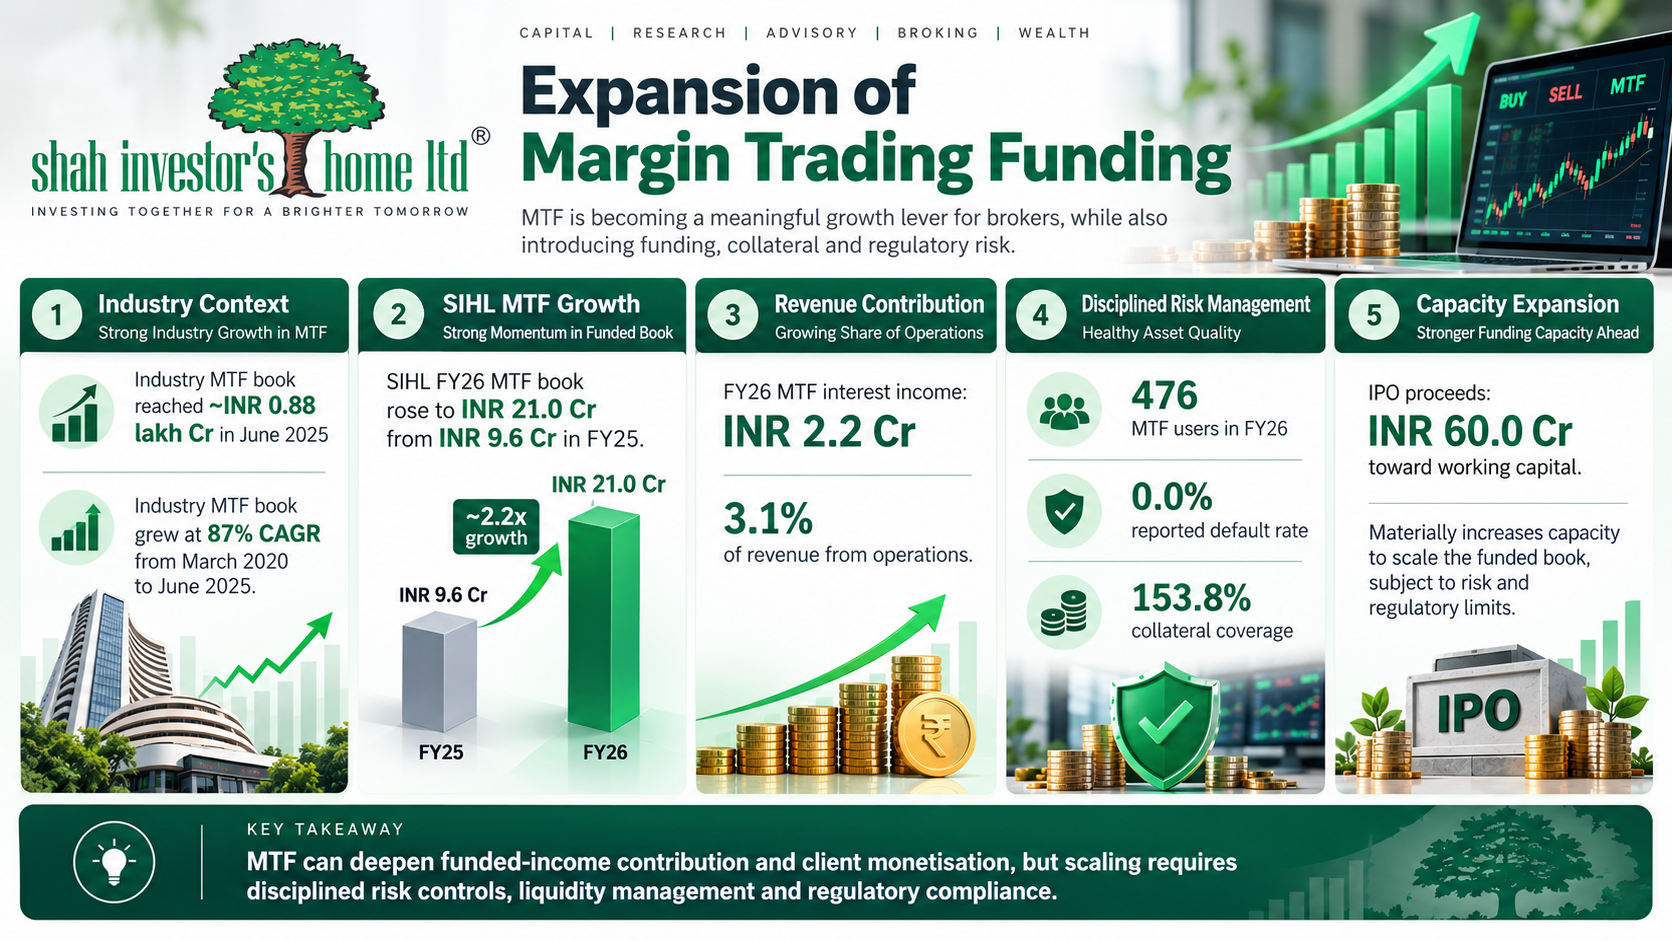
MTF is becoming an increasingly relevant ancillary revenue pool for brokers as investors use funded positions to enhance purchasing power. CareEdge reports that the industry MTF book reached about INR 0.88 lakh Cr in June 2025 and grew at an 87% CAGR from March 2020 to June 2025. SIHL is directing INR 60.0 Cr of IPO proceeds toward working capital, while its own MTF book grew 117.4% in FY26 and accelerated further after year-end, making MTF a key growth lever as well as a balance-sheet risk.
The key drivers are:
SIHL FY26 MTF book increased to INR 21.0 Cr from INR 9.6 Cr in FY25
FY26 MTF interest income was INR 2.2 Cr, or 3.1% of revenue from operations
MTF users reached 476 in FY26 with 0.0% reported default rate and 153.8% collateral coverage
IPO-funded working capital materially increases capacity to scale the funded book, subject to risk and regulatory limits
Financialisation and Broader Wealth Monetisation
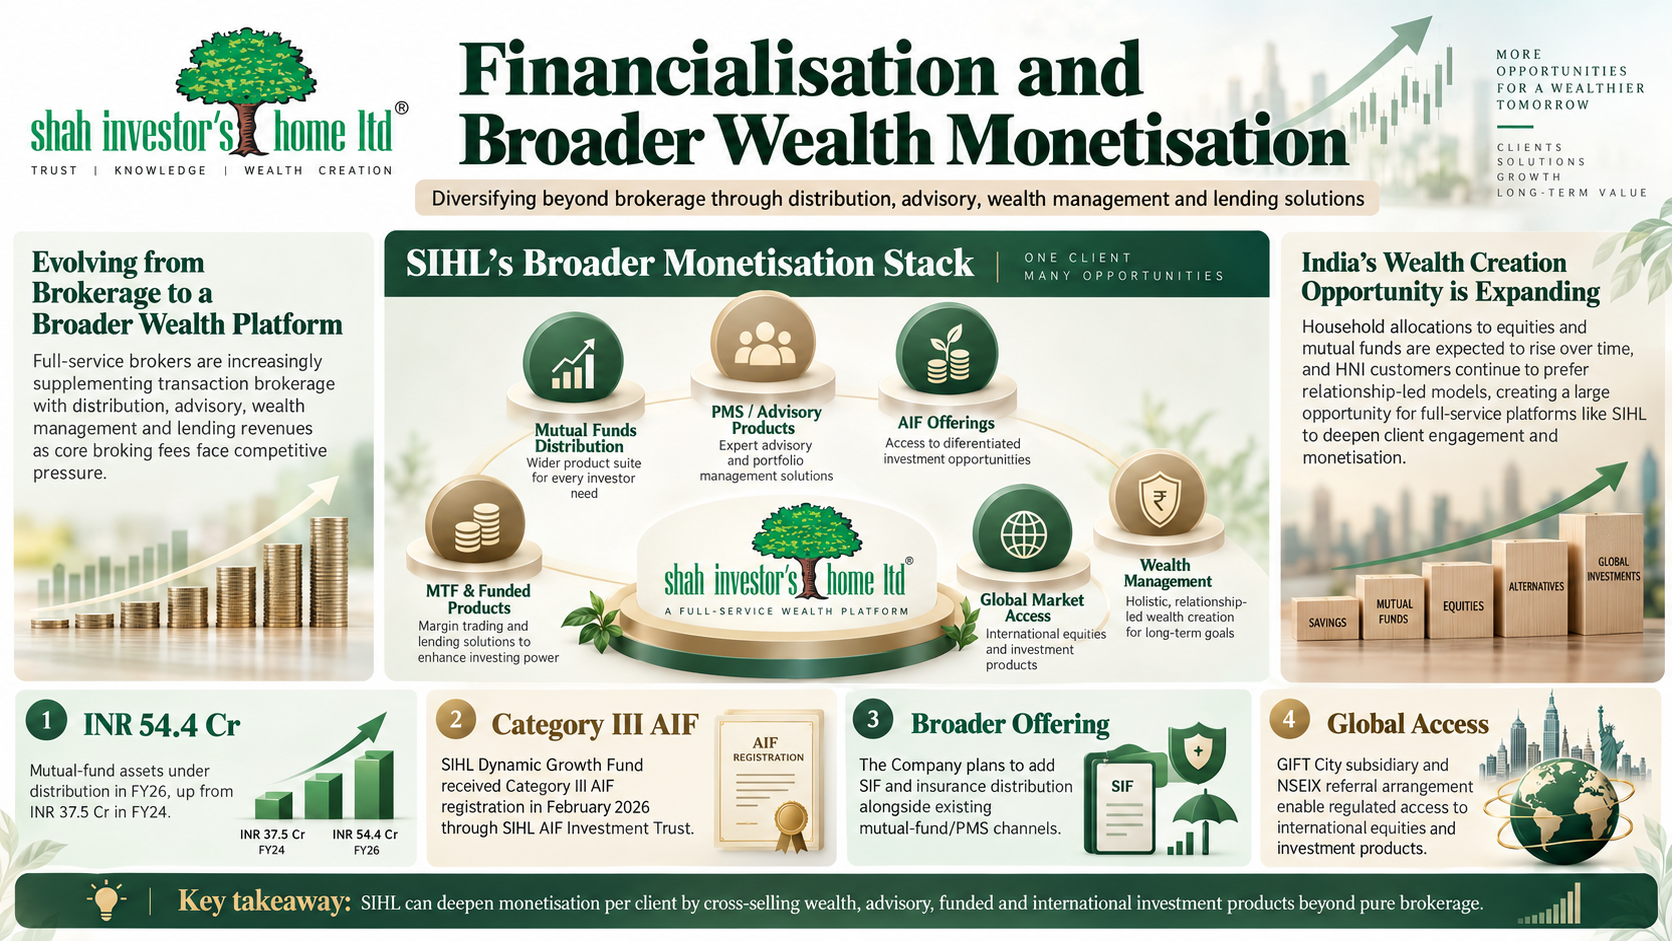
Full-service brokers are increasingly supplementing transaction brokerage with distribution, advisory, wealth-management and lending revenues as core broking fees face competitive pressure. Household allocations to equities and mutual funds are expected to rise over time, while HNI customers continue to prefer relationship-led models. SIHL is positioned to cross-sell mutual funds, PMS/advisory products, AIF offerings, MTF and global-market access to an existing client base, potentially reducing reliance on pure brokerage volumes.
The key drivers are:
Mutual-fund assets under distribution rose to INR 54.4 Cr in FY26 from INR 37.5 Cr in FY24
SIHL Dynamic Growth Fund received Category III AIF registration in February 2026 through SIHL AIF Investment Trust
The Company plans to add SIF and insurance distribution alongside existing mutual-fund/PMS channels
GIFT City subsidiary and NSEIX referral arrangement enable regulated access to international equities and investment products
Risks in the Industry
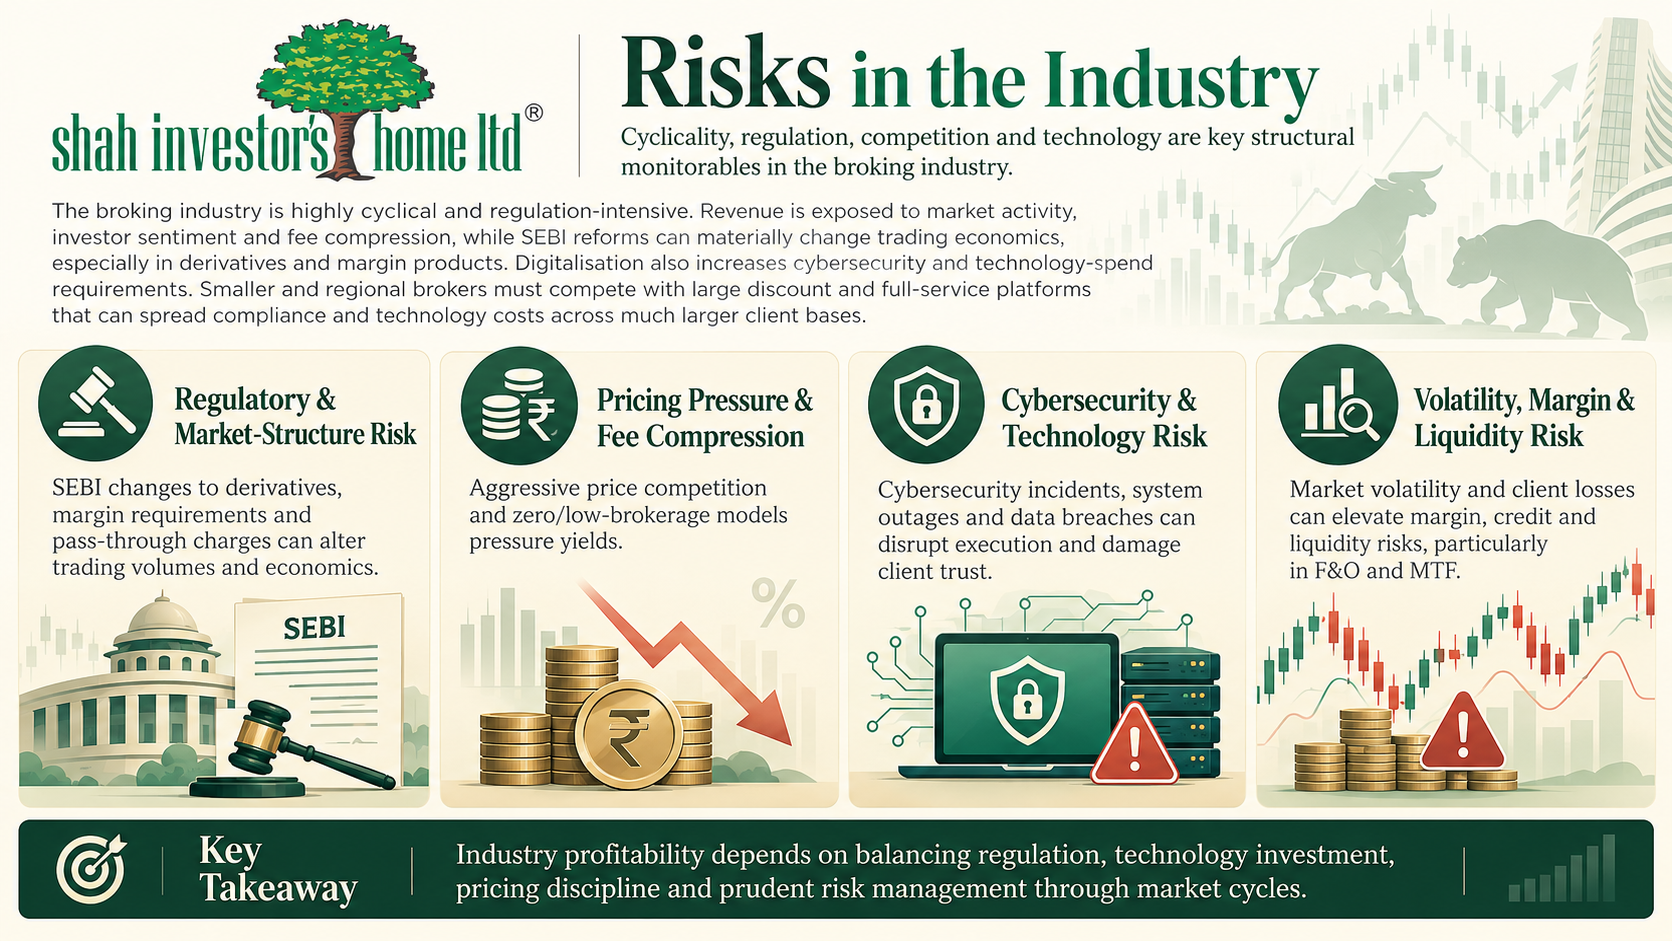
The broking industry is highly cyclical and regulation-intensive. Revenue is exposed to market activity, investor sentiment and fee compression, while SEBI reforms can materially change trading economics, especially in derivatives and margin products. Digitalisation also increases cybersecurity and technology-spend requirements. Smaller and regional brokers must compete with large discount and full-service platforms that can spread compliance and technology costs across much larger client bases.
The key risks are:
SEBI changes to derivatives, margin requirements and pass-through charges can alter trading volumes and economics
Aggressive price competition and zero/low-brokerage models pressure yields
Cybersecurity incidents, system outages and data breaches can disrupt execution and damage client trust
Market volatility and client losses can elevate margin, credit and liquidity risks, particularly in F&O and MTF
Government Policy Support
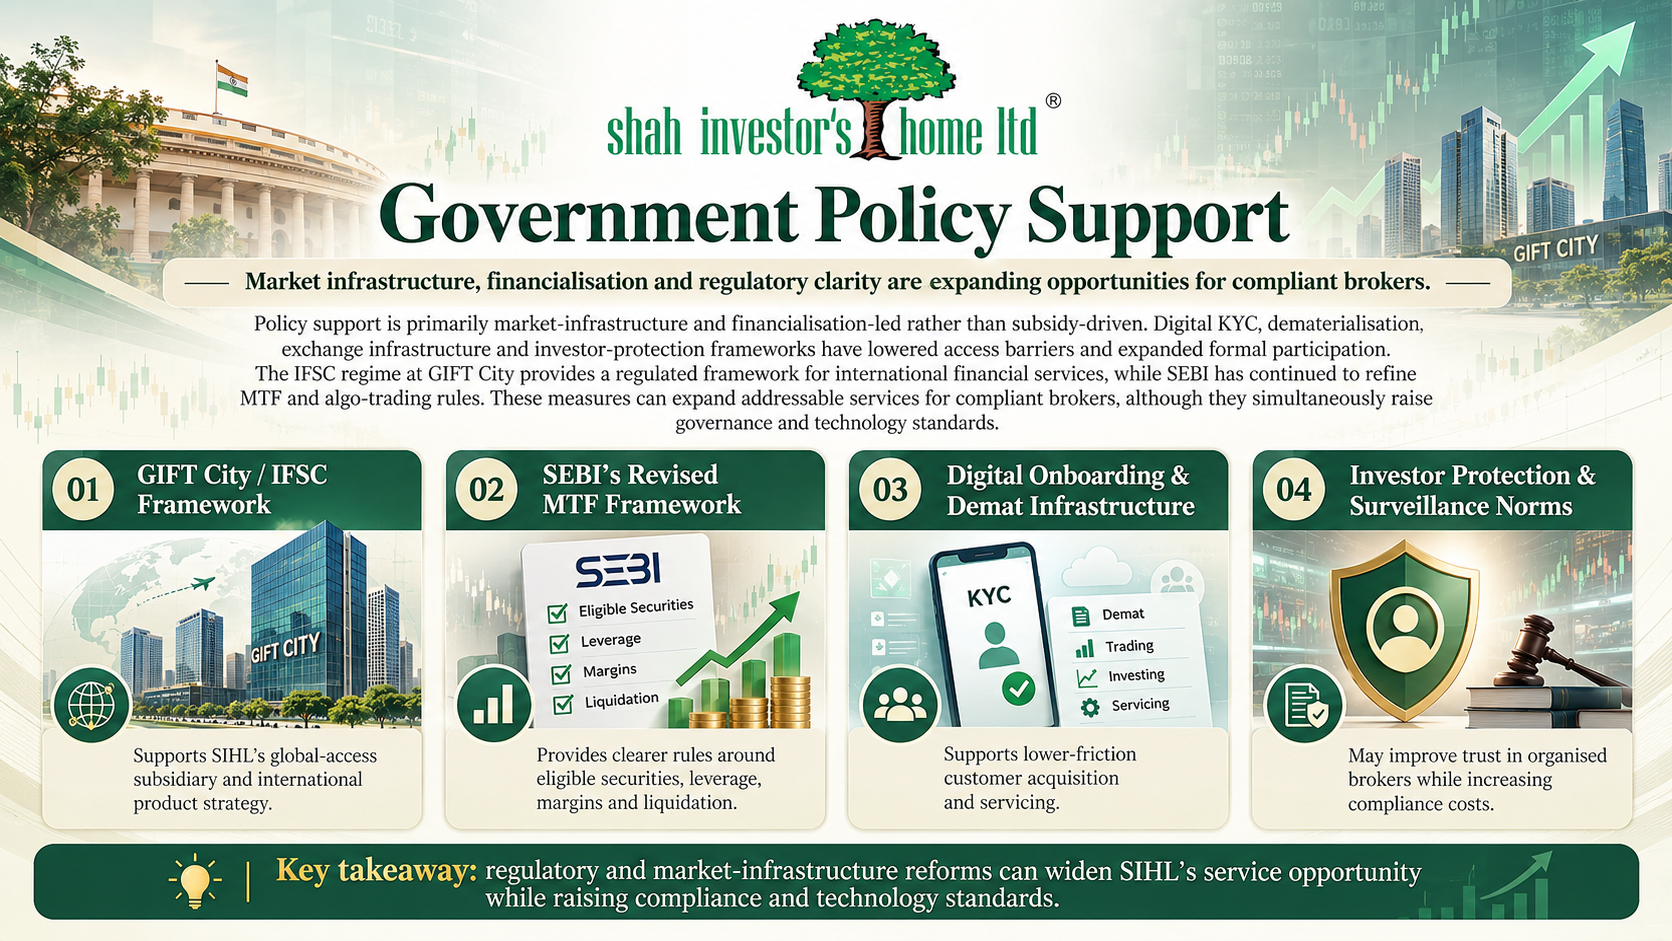
Policy support is primarily market-infrastructure and financialisation-led rather than subsidy-driven. Digital KYC, dematerialisation, exchange infrastructure and investor-protection frameworks have lowered access barriers and expanded formal participation. The IFSC regime at GIFT City provides a regulated framework for international financial services, while SEBI has continued to refine MTF and algo-trading rules. These measures can expand addressable services for compliant brokers, although they simultaneously raise governance and technology standards.
The key policies are:
GIFT City/IFSC framework supports SIHL's global-access subsidiary and international product strategy
SEBI's revised MTF framework provides clearer rules around eligible securities, leverage, margins and liquidation
Digital onboarding and demat infrastructure support lower-friction customer acquisition and servicing
Stronger investor-protection and surveillance norms may improve trust in organised brokers while increasing compliance costs
Fundraise/Future Plans
Shareholding
Pre-issue shareholding
Promoter Holding 0.0%
Post-Issue Shareholding
Promoter Holding 0.0%
Category
Pre-Issue%Post-Issue%
Promoters
Upendra Trikamlal Shah
19.0%14.2%
Purnima Upendra Shah
21.9%16.3%
Tanmay Upendra Shah
15.9%11.8%
Trupti Utpal Shah
4.1%3.1%
Promoter Group
23.4%17.4%
Total Promoter Holding
84.3%62.8%
Additional Shareholders
Other Shareholders
15.7%37.2%
Total Additional Holding
15.7%37.2%
Total Shareholding
100.0%100.0%
- Overview
- Business
- Financial Highlights
- Industry Overview
- Fundraise/Future Plans
- Documentation
Get the Preqt App and keep in touch around the clock!
 Monitor your investments in real-time.
- Receive tailored deal suggestions.
- Get real-time updates and alerts.
