


Shreni Shares Limited
Markets Made SimpleConnecting Investors, Creating Value
Unlisted Review and Rating
Speculative
DRHP FiledOverall Recommendation
Shreni has strong reported profitability, low leverage, improving FY26 cash generation, an experienced promoter and a majority-independent board. These are meaningful positives. However, revenue has not grown over the FY24–FY26 period, operating cash flow was negative in two of the last three years, and a large part of profitability is exposed to securities/fair-value movements. The biggest issue at present is price. At an indicative INR 138.0/share, Shreni trades at approximately 26.4x FY26 earnings versus around 10.3x median P/E for its own DRHP peer group. That is too large a premium to call the valuation comfortable on the current evidence. The merchant-banking exit, historical regulatory issues and a proposed IPO in which the OFS is larger than the fresh issue add further reasons to demand a valuation cushion. The Company becomes materially more interesting if the IPO valuation compresses closer to listed-peer economics, or if subsequent results demonstrate that FY26 PAT and cash generation can be sustained without relying disproportionately on market-linked fair-value gains
PARAMETER
WEIGHT
SCORE
KEY FACTORS
Financial Performance
25.0%
4.0/5
Profitability is the strongest part of Shreni's financial profile: PAT increased to INR 27.7 Cr, leverage remains minimal and ROE is healthy. The weaker element is revenue consistency and earnings quality. FY26 revenue contracted materially despite higher PAT, and the preceding two years generated negative operating cash flow
Show more
Detailed Analysis
Revenue moved from INR 49.4 Cr in FY24 to INR 45.7 Cr in FY26, implying a two-year CAGR of -3.7%. FY25 grew 10.1%, but FY26 then contracted 15.9% YoY
Framework FY26 EBITDA was approximately INR 40.1 Cr, implying an exceptionally high 87.6% margin. However, this benefits materially from securities/trading fair-value gains and therefore overstates underlying recurring operating economics
FY26 PAT of INR 27.7 Cr translates into a PAT margin of 60.7%
Debt securities plus borrowings were approximately INR 9.6 Cr against equity of INR 166.7 Cr, giving D/E of only 0.1x
FY26 PAT against average FY25–FY26 equity gives an ROE of approximately 18.0%
Industry
25.0%
3.0/5
India's underlying investor-participation story remains attractive, but the economic opportunity does not translate automatically into attractive broker economics. The sector is highly competitive, fee pressure is structural, technology spending is necessary and regulation can change revenue pools quickly. Shreni benefits from rising participation but operates without a clear structural moat comparable to the largest digital or institutional platforms
Show more
Detailed Analysis
The FY26 MDA highlights structural growth in Indian capital-market participation, including approximately 15.3% CAGR in demat-account penetration over the longer period considered
Broking, MTF, market making and depository operations are extensively regulated by SEBI, exchanges and depositories; changes in capital, margin, reporting and conduct rules can materially affect economics
The sector remains in a growth phase, supported by financialisation of savings, digital onboarding and rising retail participation. CDSL accounts expanded from 3.3 Cr in FY21 to 15.3 Cr in FY25
Management
25.0%
4.0/5
Management experience and board independence are strong, and there is no promoter share pledge. The governance record is not spotless, however: the DRHP discloses historical exchange warnings and regulatory penalties, including issues relating to client-fund and reporting compliance. These were historical and paid/resolved, but they deserve more weight than their small monetary size suggests
Show more
Detailed Analysis
Founder and MD Bhavesh Himmatlal Shah has 34.0+ years of professional experience as a Chartered Accountant and capital-market participant; Hitesh Punjani has more than 15.0 years in capital markets, stock broking and finance
FY26 has 7.0 directors, of which 4.0 are independent, giving approximately 57.1% board independence
FY26 disclosures contain transactions with promoters, directors and relatives including brokerage, remuneration, dividends and other items, but the corporate-governance report states RPTs were in the ordinary course and on an arm's-length basis
Valuation Metrics
25.0%
2.0/5
Shreni is not cheap versus the peer set selected by the Company itself in the DRHP. At approximately 26.4x FY26 earnings, it trades at more than 2.5x the median P/E of Share India, SMC Global and Rikhav
Show more
Detailed Analysis
The Company's own DRHP identifies Share India Securities, SMC Global Securities and Rikhav Securities as the listed peer group. Current P/Es are approximately 10.3x, 15.1x and 9.2x, respectively. Their median is about 10.3x, meaning Shreni at 26.4x trades at a roughly 155.1% premium
EV/EBITDA is not a clean comparison for a stock broker/trading business where finance cost, trading assets and market-linked income are economically intertwined
FY26 equity of INR 166.7 Cr implies book value of approximately INR 31.4/share. At INR 138.0/share, P/B is approximately 4.4x
TOTAL
100%
3.3/5
Weighted Composite Score
Per Share Price
₹135.0
As of 24 Oct 2026
Lot Size
1,000.0 Shares
Minimum Investment
₹1,35,000.0 / 1,000 shares
Market Cap. (₹ Cr)
Revenue FY’26
PAT FY’26
P/E Multiple
Face Value
₹ 10.0Lot Size
1,000.0 sharesSale Type
Secondary SalePAT FY’26
₹ 27.8 CrPAT Margin (%)
60.9 %P/E Multiple
26.4xCAGR Growth 3Y
20.2 %ROE (FY’26)
18.1 %ROCE (FY’26)
23.7 %Price to Book Value ratio
4.4xMerchant banker appointed
❌ NoCompany Website
www.shreni.inDisclaimer: Unlisted shares are unregulated & illiquid. This is NOT investment advice. Please do your own due diligence before investing.
Minimum Investment
₹1,35,000.0 / 1,000 sharesShares Lot 1000 X 1
Investment amount
₹1,35,000.0
Overview
Business
Business Model
Geographical Presence
Sales Channel
Financial Highlights
Income Statement
Revenue growth with EBITDA and PAT margins
| Financial Metric | FY 2024 | FY 2025 | FY 2026 |
|---|---|---|---|
| Revenue (₹ Cr) | 31.7 | 28.5 | 45.7 |
| Growth (%) | - | -9.9% | 60.4% |
| EBITDA (₹ Cr) | 28.5 | 24.8 | 40.1 |
| EBITDA Margin (%) | 89.9% | 86.9% | 87.6% |
| PAT (₹ Cr) | 19.6 | 16.8 | 27.8 |
| PAT Margin (%) | 61.9% | 59.0% | 60.9% |
OBSERVATIONS & INSIGHTS
Continuing operating revenue declined 9.9% in FY25 but rebounded 60.4% in FY26. The FY24-FY26 CAGR was 20.2%. The rebound was broad enough to include higher fee / commission and interest income, although fair-value gains remained the largest single revenue component
Continuing PAT fell from INR 19.6 Cr in FY24 to INR 16.8 Cr in FY25 before increasing to INR 27.8 Cr in FY26. Continuing PAT CAGR over FY24-FY26 was 19.2%. Reported margins are unusually high because financial-asset fair-value gains form part of operating revenue and finance cost is structurally linked to a brokerage / MTF model
Total PAT was higher than continuing PAT in FY24 and FY25 because merchant banking contributed INR 4.0 Cr and INR 6.3 Cr after tax respectively. FY26 discontinued operations generated a small loss of approximately INR 0.1 Cr. Core forward estimates should exclude legacy merchant-banking contribution
FY26 fees and commission income increased to INR 15.7 Cr from INR 7.0 Cr in FY25, while net fair-value gains rose to INR 24.9 Cr from INR 19.4 Cr. The absolute fair-value gain increased, but its share of operating revenue fell, which is a better signal than margin expansion alone
Balance Sheet
| Financial Metric | FY 2024 | FY 2025 | FY 2026 |
|---|---|---|---|
| EQUITY & LIABILITIES | ₹ 101.7 Cr | ₹ 170.9 Cr | ₹ 210.3 Cr |
| Net Worth | ₹ 84.3 Cr | ₹ 141.6 Cr | ₹ 166.7 Cr |
| Share Capital | ₹ 25.0 Cr | ₹ 53.0 Cr | ₹ 53.0 Cr |
| Reserves & Surplus | ₹ 59.3 Cr | ₹ 88.6 Cr | ₹ 113.7 Cr |
| Total Liabilities | ₹ 17.4 Cr | ₹ 29.3 Cr | ₹ 43.6 Cr |
| Current Liabilities | ₹ 11.6 Cr | ₹ 16.0 Cr | ₹ 27.4 Cr |
| Borrowings | ₹ 0.0 Cr | ₹ 0.1 Cr | ₹ 0.3 Cr |
| Trade Payables | ₹ 0.1 Cr | ₹ 0.1 Cr | ₹ 0.3 Cr |
| Other Current Liabilities | ₹ 11.5 Cr | ₹ 15.8 Cr | ₹ 26.8 Cr |
| Non-Current Liabilities | ₹ 5.8 Cr | ₹ 13.3 Cr | ₹ 16.2 Cr |
| Borrowings | ₹ 5.2 Cr | ₹ 9.6 Cr | ₹ 9.6 Cr |
| Other Non-Current Liabilities | ₹ 0.6 Cr | ₹ 3.7 Cr | ₹ 6.6 Cr |
| ASSETS | ₹ 101.7 Cr | ₹ 171.0 Cr | ₹ 210.2 Cr |
| Current Assets | ₹ 71.8 Cr | ₹ 140.6 Cr | ₹ 175.4 Cr |
| Trade Receivables | ₹ 1.3 Cr | ₹ 1.7 Cr | ₹ 5.2 Cr |
| Inventory | ₹ 0.0 Cr | ₹ 0.0 Cr | ₹ 0.0 Cr |
| Cash & Cash Equivalents | ₹ 4.0 Cr | ₹ 0.5 Cr | ₹ 0.7 Cr |
| Other Current Assets | ₹ 66.5 Cr | ₹ 138.4 Cr | ₹ 169.5 Cr |
| Non-Current Assets | ₹ 29.9 Cr | ₹ 30.4 Cr | ₹ 34.8 Cr |
| Fixed Assets | ₹ 13.7 Cr | ₹ 12.5 Cr | ₹ 12.2 Cr |
| Other Non-Current Assets | ₹ 16.2 Cr | ₹ 17.9 Cr | ₹ 22.6 Cr |
OBSERVATIONS & INSIGHTS
Balance-sheet scale doubled over FY24-FY26. Total assets increased from INR 101.7 Cr to INR 210.3 Cr, driven primarily by securities held for trading and the introduction / growth of loan assets. This is a financial-asset expansion rather than capex-led growth
Equity increased from INR 84.3 Cr in FY24 to INR 166.7 Cr in FY26. Share capital increased materially in FY25 following bonus / capital actions, while retained earnings and securities premium expanded. The larger equity base supports market-making and financing capacity but also requires sustained earnings growth to protect ROE
The balance sheet remains physically asset light: fixed / right-of-use / intangible assets are a small share of total assets. The central balance-sheet risks are therefore market liquidity, collateral value, counterparty credit, derivative exposures and the availability of cash / bank collateral rather than plant utilisation or inventory obsolescence
Cash Flow
| Financial Metric | FY 2024 | FY 2025 | FY 2026 |
|---|---|---|---|
CFO (₹ Cr) Cash generated from core business operations. | -22.9 Cr | -16.2 Cr | +6.1 Cr |
CFI (₹ Cr) Cash used for investments and long-term assets. | -3.9 Cr | -25.4 Cr | -1.8 Cr |
CFF (₹ Cr) Cash flow related to funding and borrowings. | +30.4 Cr | +38.1 Cr | -4.1 Cr |
Financial Ratios
Measures the company’s leverage relative to shareholder equity.
OBSERVATIONS & INSIGHTS
FY24 average-equity ROE was unusually high because the opening equity base was much smaller and the Company raised substantial capital during the period. ROE settled at 14.9% in FY25 and recovered to 18.1% in FY26 as continuing PAT improved
Debt/equity remained around 0.1x despite the development of MTF, and interest coverage stayed strong. This does not mean the business is low risk: securities inventory, derivatives, collateral and client financing create market and liquidity exposures that are not captured by a simple debt/equity ratio
Current ratio stayed well above 1.0x, yet current assets consist largely of securities, loans, receivables and financial balances rather than manufacturing working capital. The ratio should be interpreted alongside collateral quality, encumbrance and market liquidity
Industry Overview
Industry Drivers
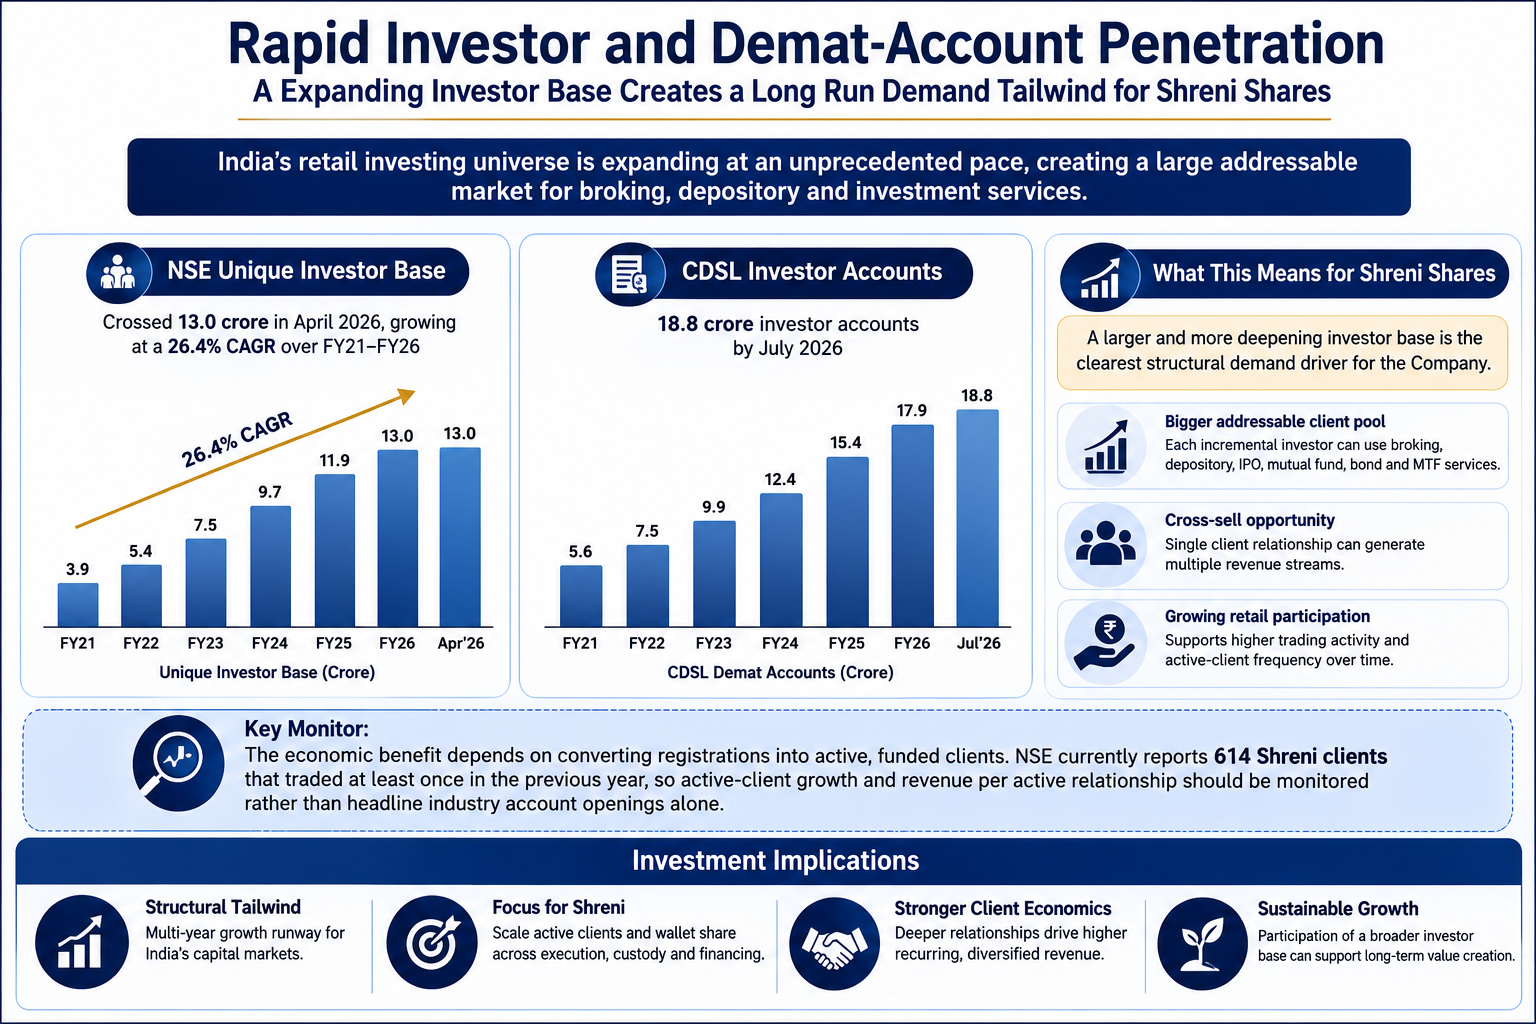
Rapid investor and demat-account penetration
NSE’s unique investor base crossed 13.0 crore in April 2026 after growing at a 26.4% CAGR over FY21-FY26, while CDSL had 18.8 crore investor accounts by July 2026. This is the clearest structural demand driver for Shreni because each incremental investor can use broking, depository, IPO, mutual-fund, bond and MTF services
The economic benefit depends on converting registrations into active, funded clients: NSE currently reports 614 Shreni clients that traded at least once in the previous year, so active-client growth and revenue per active relationship should be monitored rather than headline industry account openings alone
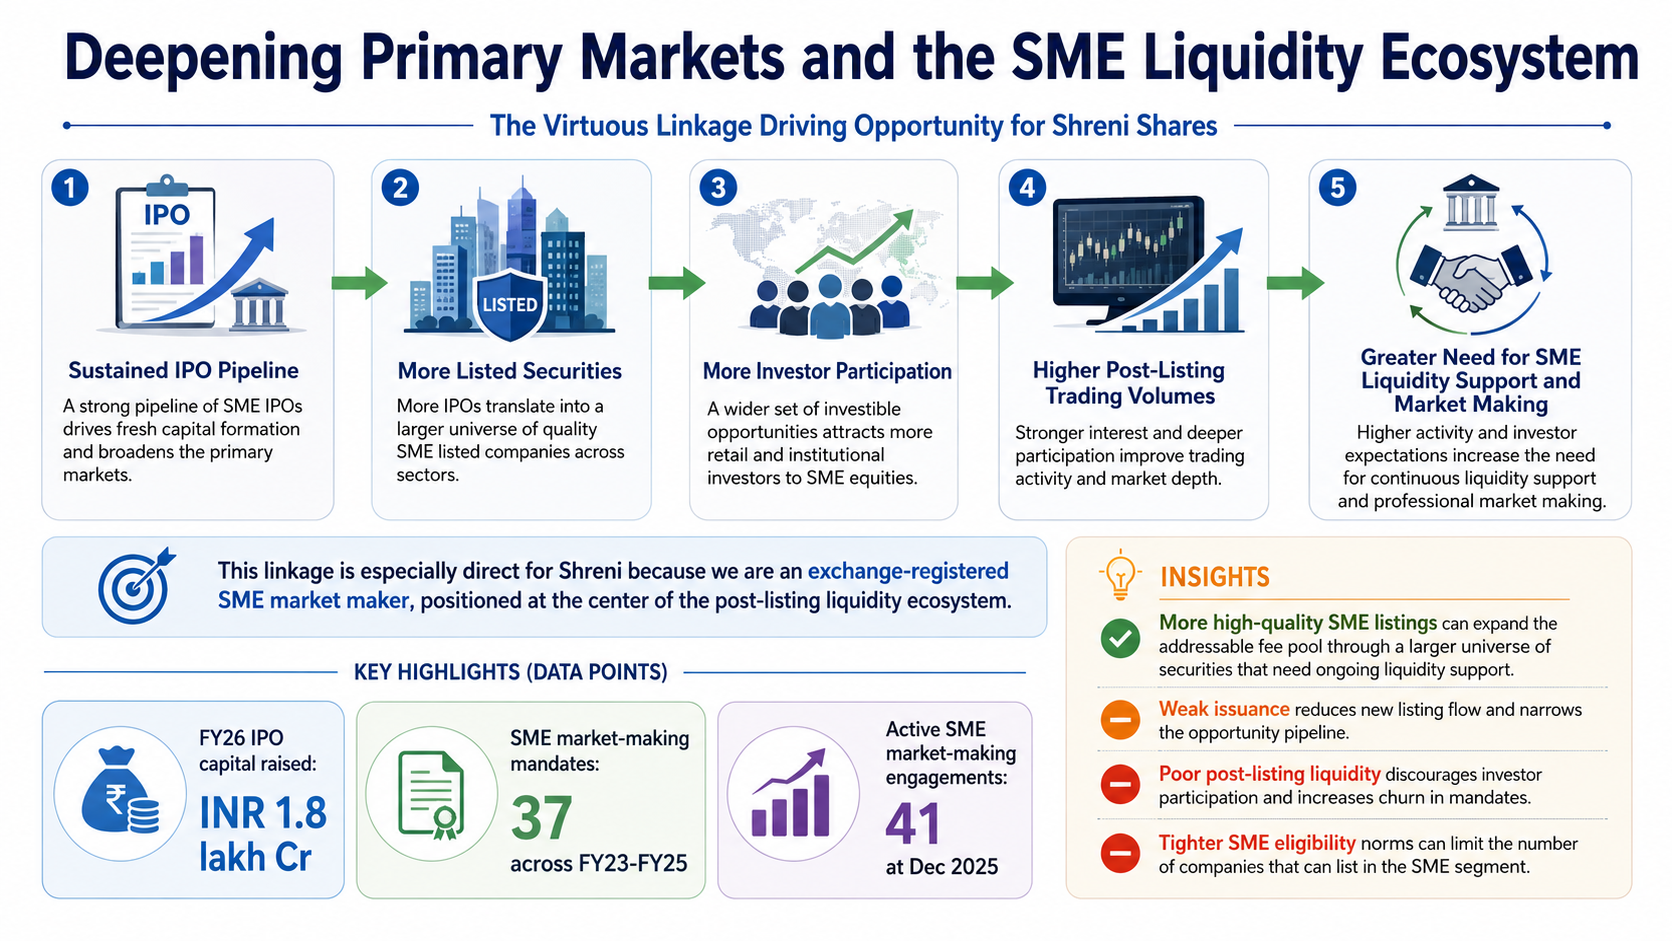
Deepening primary markets and the SME liquidity ecosystem
A sustained IPO pipeline creates new listed securities, new investor participation and post-listing trading volumes. NSE reported INR 1.8 lakh Cr of equity capital raised through IPOs in FY26
The linkage is especially direct for Shreni because SME issues require structured post-listing liquidity support and the Company is an exchange-registered market maker. The DRHP cites 37 mandates across FY23-FY25 and 41 active SME market-making engagements at December 2025
More high-quality SME listings can expand the addressable fee pool; weak issuance, poor post-listing liquidity or tighter SME eligibility can reduce it
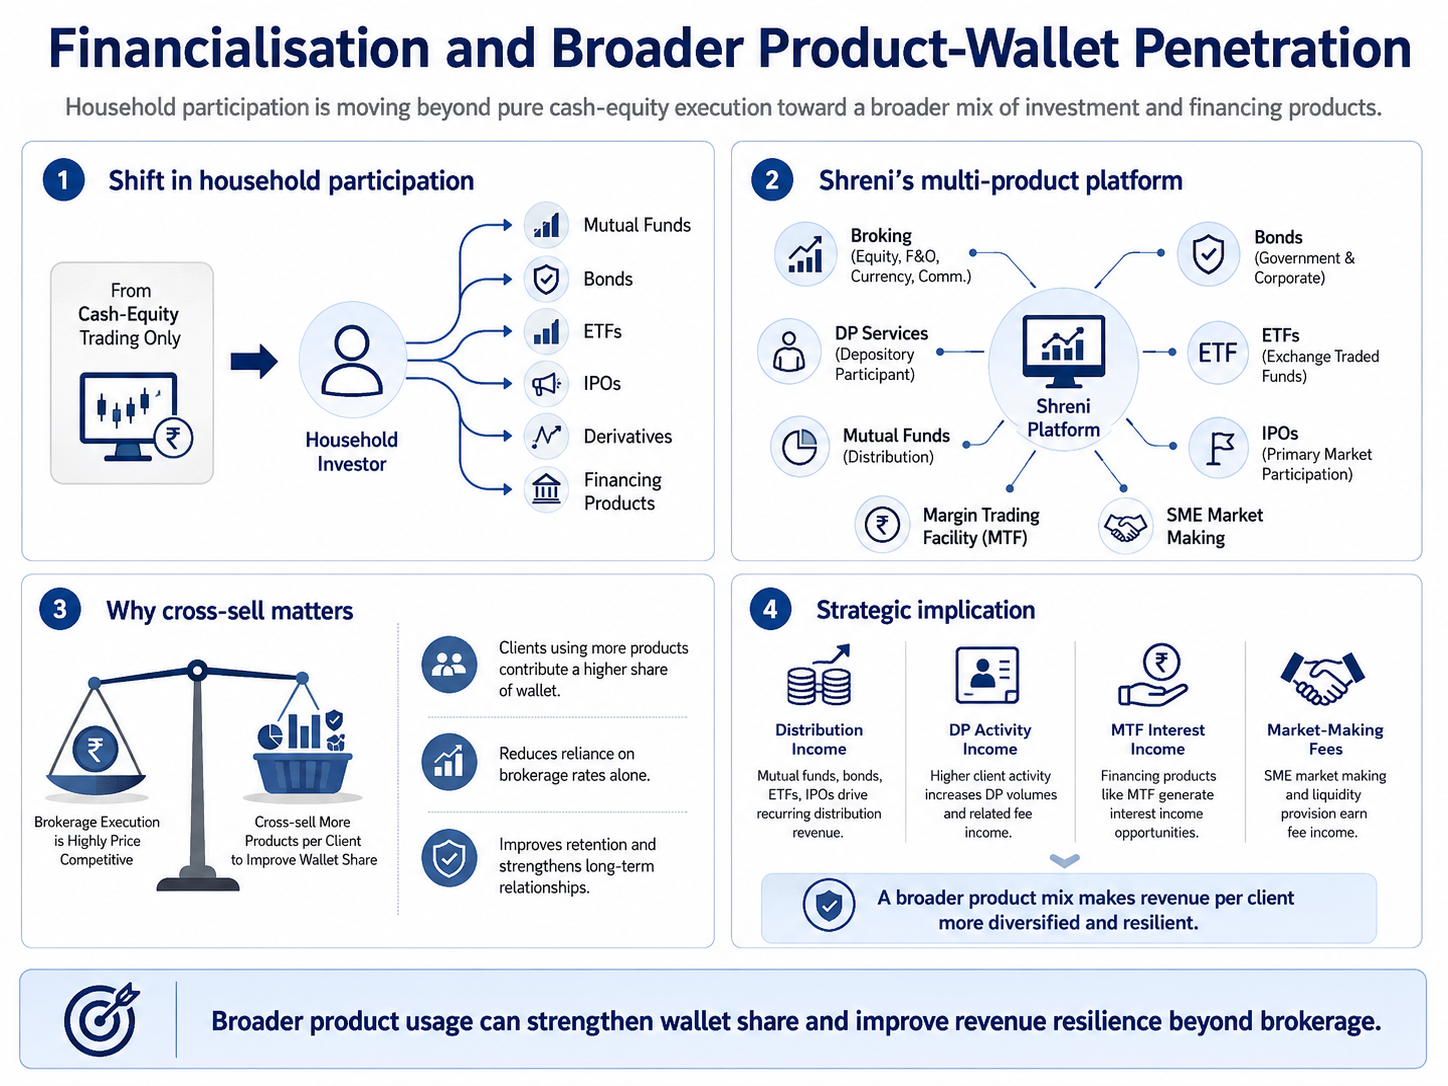
Financialisation and broader product-wallet penetration
Household participation is moving beyond pure cash-equity execution toward mutual funds, bonds, ETFs, IPOs, derivatives and financing products
Shreni’s multi-product platform provides an opportunity to increase wallet share without relying only on brokerage rates
Cross-sell is strategically important because brokerage execution is highly price competitive; distribution, DP activity, MTF interest and market-making fees can make revenue per client more resilient if usage broadens
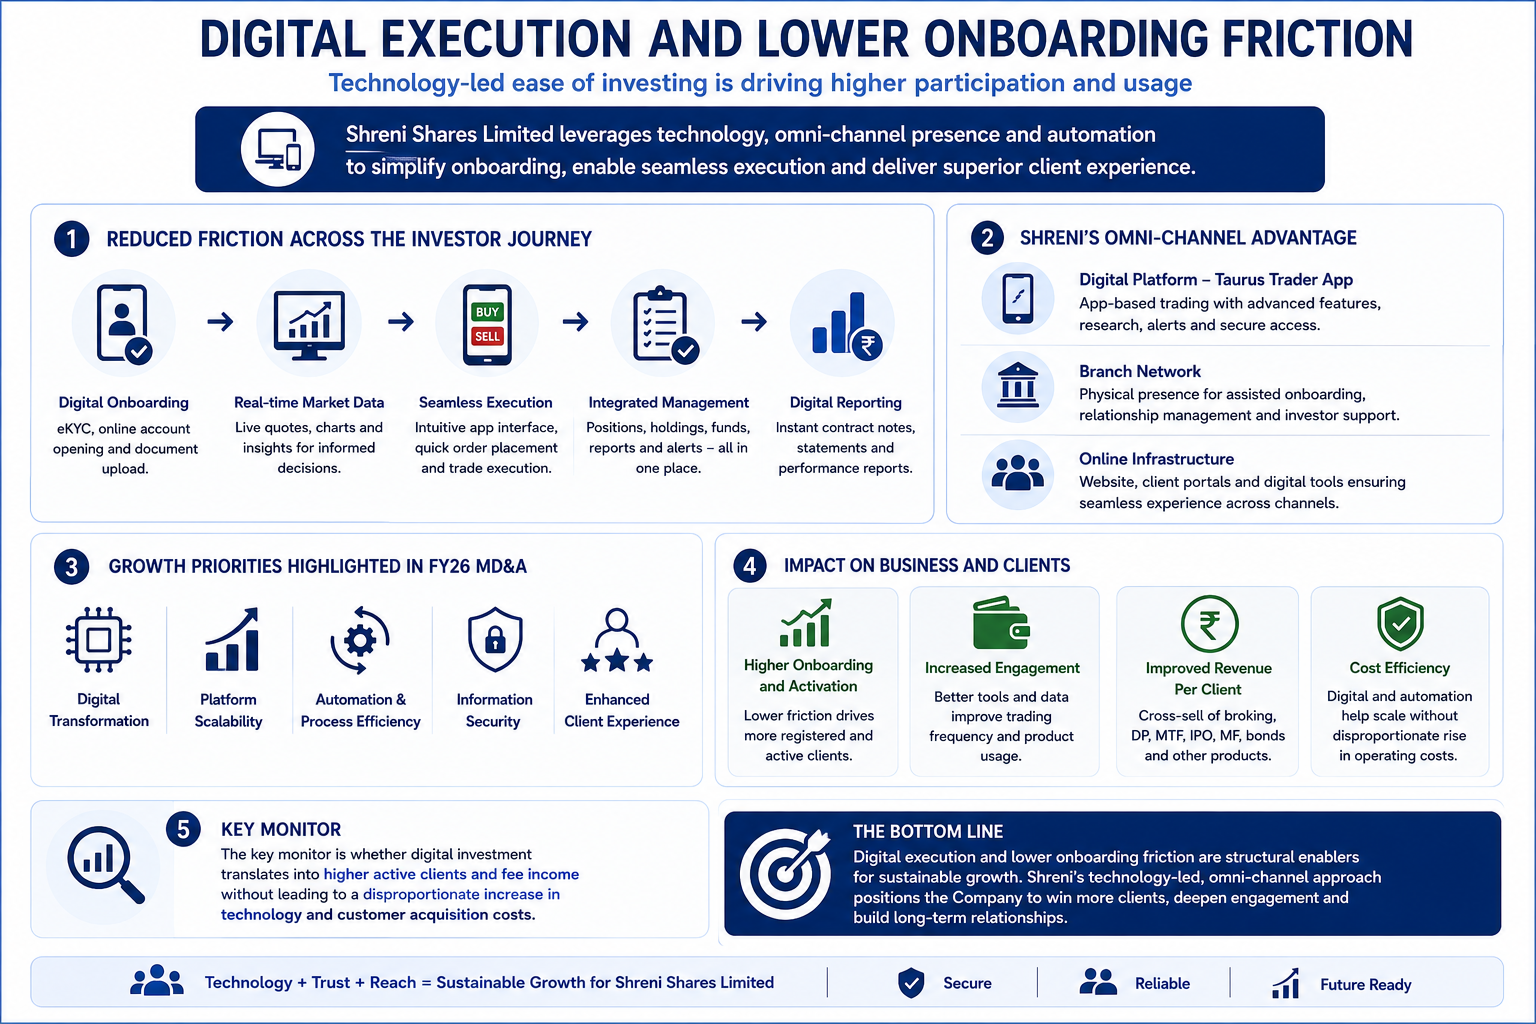
Digital execution and lower onboarding friction
Electronic KYC, app-based execution, real-time market data, integrated order management and digital reporting have reduced the friction of entering and using capital markets. Shreni’s Taurus Trader application, branch network and online platform give it an omni-channel acquisition and servicing model
The FY26 MD&A explicitly identifies digital transformation, platform scalability, automation and information security as growth priorities. The key monitor is whether digital investment lifts active clients and fee income without causing a disproportionate rise in technology and acquisition costs
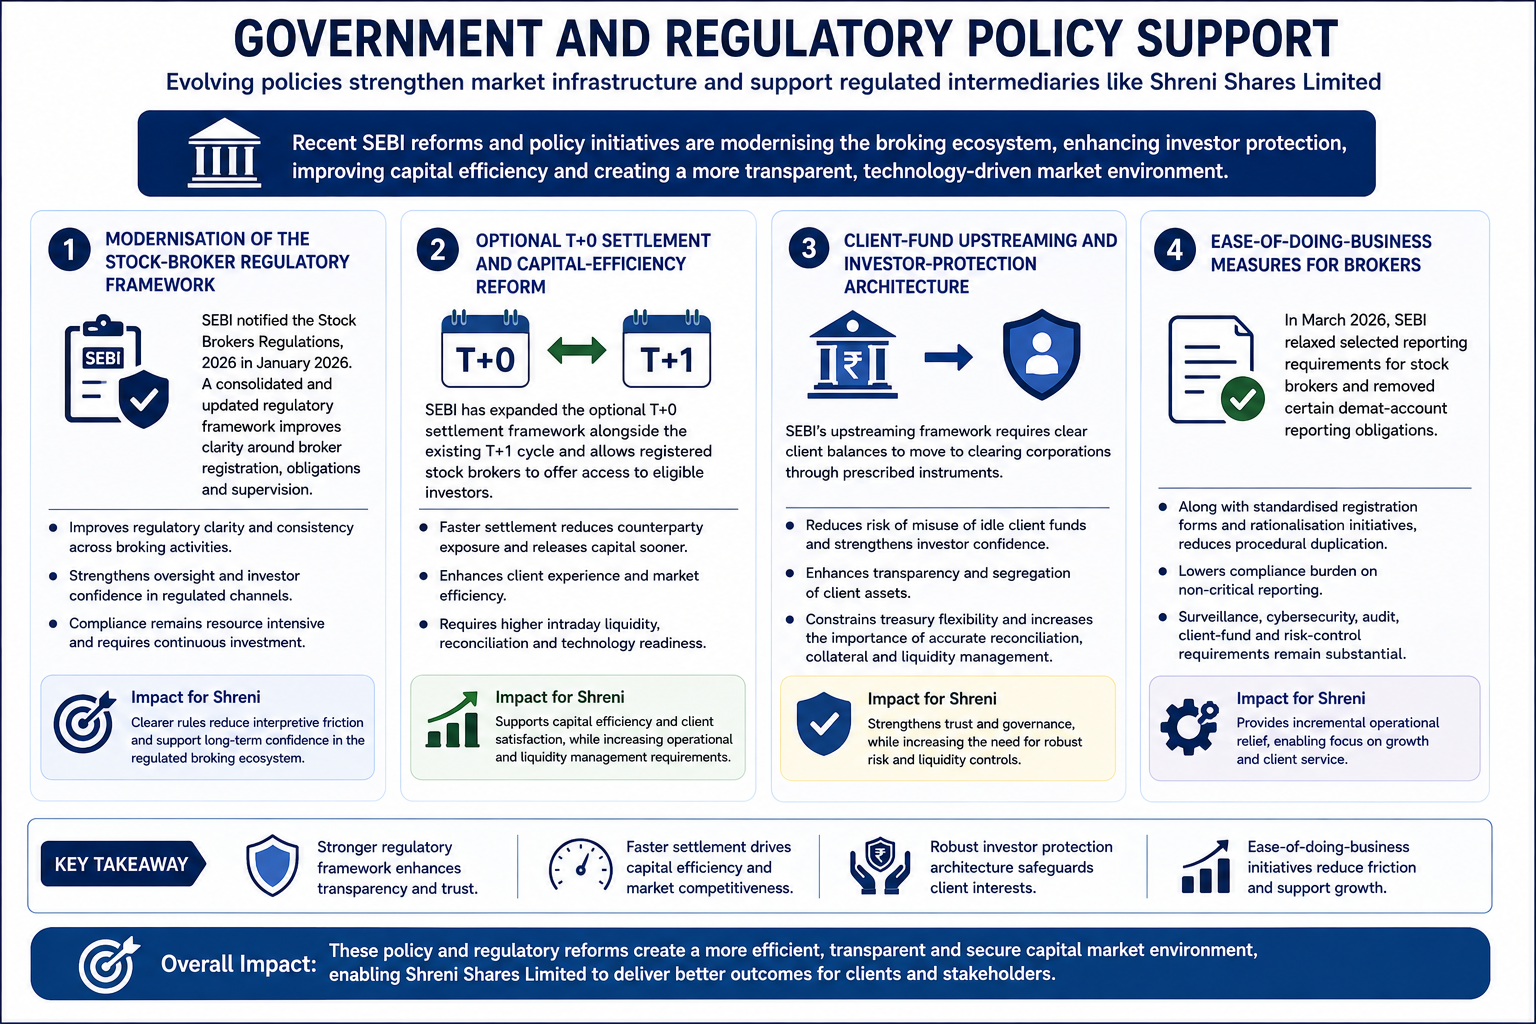
Government Policy Support
SEBI notified the Stock Brokers Regulations, 2026 in January 2026. A consolidated and updated regulatory framework improves clarity around broker registration, obligations and supervision. For established intermediaries such as Shreni, a clearer rulebook can reduce interpretive friction and support confidence in regulated channels, although compliance remains resource intensive
SEBI has expanded the optional T+0 settlement framework alongside the existing T+1 cycle and allows registered stock brokers to offer access to eligible investors. Faster settlement can reduce counterparty exposure and release capital sooner, supporting client experience and market efficiency. The operational trade-off is a greater requirement for intraday liquidity, reconciliation and technology readiness
SEBI’s upstreaming framework requires clear client balances to move to clearing corporations through prescribed instruments. This reduces the risk of misuse of idle client funds and strengthens confidence in intermediaries. For brokers, the same framework constrains treasury flexibility and increases the importance of accurate client-level reconciliation, collateral and liquidity management
In March 2026, SEBI relaxed selected reporting requirements for stock brokers and removed certain demat-account reporting obligations. Together with standardised registration forms and rationalisation initiatives, these measures can reduce procedural duplication. The benefit is incremental rather than transformational because surveillance, cybersecurity, audit, client-fund and risk-control requirements remain substantial
Fundraise/Future Plans
Shareholding
Pre-issue shareholding
Promoter Holding 0.0%
Category
Pre-Issue%
Promoters
0.0%
Total Promoter Holding
0.0%
Additional Shareholders
0.0%
Total Additional Holding
0.0%
Total Shareholding
0.0%
- Overview
- Business
- Financial Highlights
- Industry Overview
- Fundraise/Future Plans
- Documentation
Get the Preqt App and keep in touch around the clock!
 Monitor your investments in real-time.
- Receive tailored deal suggestions.
- Get real-time updates and alerts.
