


Skyways Air Services
Moving Trade ForwardLogistics Without Limits
IPO Summary (PrEqT)
Skyways Air Services Limited is a four-decade freight forwarding and integrated logistics platform led by air cargo, which contributed 77.0% of FY26 revenue. Revenue rose from INR 1289.1 Cr in FY24 to INR 2812.9 Cr in FY26, while EBITDA expanded from INR 48.3 Cr to INR 125.6 Cr and PAT from INR 34.5 Cr to INR 63.5 Cr. The IPO is a INR 582.8 Cr offer at the cap, with a 68.4% fresh component primarily directed to debt repayment and working capital. The investment case combines scale leadership in India-origin air freight, a diversified 9,500+ customer base and international network with low operating margins, high carrier dependence, working-capital intensity and acquisition-led complexity. At INR 138, FY26 P/E is approximately 38.8x and post-issue market capitalization is approximately INR 2,006 Cr.
IPO Review Rating
Average
MainboardDelivering Global Logistics Solutions with Speed, Scale, and Reliability
Skyways Air Services presents a strong-growth but relatively thin-margin logistics investment case. The strongest aspects are the Company's 47.7% FY24–FY26 revenue CAGR, low customer concentration, sharply improved FY26 operating cash flow, cross-border air-freight exposure and predominantly fresh IPO structure. The proposed deployment of INR 216.8 Cr towards debt repayment and INR 130.0 Cr towards incremental working capital directly addresses two of the Company's largest financial constraints. The biggest non-financial weakness is even more important: the EOW FIR and consequent suspension of AEO-LO status. The allegations remain under investigation, but because the matter directly touches the Company's freight-forwarding operations and regulatory standing, it warrants a meaningful governance discount.
PARAMETER
WEIGHT
SCORE
KEY FACTORS
Financial Performance
40.0%
3.0/5
Skyways scores strongly on revenue growth, cash-flow improvement and customer diversification, but these positives are offset by thin operating margins and relatively high pre-IPO leverage.
Show more
Detailed Analysis
Revenue from operations increased from INR 1,289.1 Cr in FY24 to INR 2,247.8 Cr in FY25 and INR 2,812.9 Cr in FY26, representing a FY24–FY26 CAGR of approximately 47.7%
FY26 EBITDA stood at INR 125.6 Cr, translating into an EBITDA margin of only 4.5%, although this improved from 3.7% in FY24
FY26 PAT stood at approximately INR 63.5 Cr, translating into a PAT margin of only 2.3%
FY26 total borrowings stood at approximately INR 624.1 Cr against shareholders' funds of INR 332.6 Cr, giving a ratio of approximately 1.9x
FY26 ROE was 14.1%, compared with 19.5% in FY25 and 22.4% in FY24
Operating cash flow was positive at INR 2.0 Cr in FY25 and increased significantly to INR 113.6 Cr in FY26
The Top 5 customers together contributed only 14.0% of FY26 revenue
Industry
15.0%
3.0/5
The logistics and air-freight industry offers healthy structural growth and strong exposure to India's manufacturing/export expansion.
Show more
Detailed Analysis
India's logistics market is projected to expand at approximately 10.7% CAGR through FY30, supported by manufacturing, e-commerce, exports and infrastructure investment
Rising trade flows, airport capacity, e-commerce, manufacturing and multimodal logistics infrastructure continue to expand the addressable market
Freight forwarders face overlapping customs, aviation, GST, DGFT and international trade/documentation requirements, creating execution and compliance risk
Air-freight exports and imports have shown double-digit historical growth, while pharmaceuticals, electronics and other time-sensitive export categories increasingly rely on air cargo
Management
15.0%
4.0/5
Management has significant logistics experience, adequate Board independence and low operating RPT intensity. However, the EOW FIR and suspension of AEO-LO status are material governance and operating risks.
Show more
Detailed Analysis
Yashpal Sharma has been associated with the business since 1995 and has 30+ years of logistics-sector experience; Tarun Sharma has approximately 12 years of ocean-freight experience
The Board has 10 Directors, including 5 Independent Directors, giving exactly 50.0% independent representation
Governance risk is material despite no promoter pledge: An EOW FIR names the Company in allegations involving freight invoicing and related misconduct, while its AEO-LO status has been suspended pending investigation
Promoters are partially monetising but most of the IPO remains primary capital: OFS represents 31.6% of the total offer, while Fresh Issue represents 68.4%
Valuation
20.0%
4.0/5
Relative valuation is one of the stronger elements of the IPO. P/E and EV/EBITDA are below the selected listed-logistics benchmarks, while the 68.4% fresh component is favourable.
Show more
Detailed Analysis
IPO P/E is approximately 38.8x, while the RHP-disclosed listed logistics peer set carries materially higher earnings multiples
Skyways is approximately 19.9x versus an indicative selected-peer average of approximately 31.6x, giving a peer/Skyways ratio of about 1.6x
At INR 138.0 versus FY26 NAV of INR 28.9 per share, the issue is priced at approximately 4.8x P/B
FY26 RoNW stood at 12.3%, within the framework's middle valuation-quality band
Merchant Banker Track Record
10.0%
5.0/5
The representative mainboard transactions show excellent subscription and listing performance, which mechanically produces a high framework score. However, the historical evidence is thin and concentrated largely around Holani's recent transactions.
Show more
Detailed Analysis
Recent representative mainboard execution has delivered very strong listing outcomes: The two selected completed mainboard IPOs produced an average listing gain of approximately 75.3%
Investor demand in the representative transactions was exceptionally strong: Average overall subscription was approximately 213.5x
Both representative completed mainboard IPOs listed positively: 2 of 2, implying a 100.0% positive listing-opening rate
The syndicate has relevant execution capability but a thinner institutional mainboard history than top-tier BRLM franchises: Holani has the strongest recent disclosed record; Dolat and Shannon have materially less recent mainboard activity
TOTAL
100%
3.5/5
Weighted Composite Score
Issue Price
₹131.0 to ₹138.0
As of 29 Aug 2026
GMP
₹29.0
As of 29 Aug 2026
Estimated Gain / Loss
+21.0%
Lot Size
100.0 Shares
Grey Market Premium (GMPs) are shared for knowledge purpose only. PrEqt doesn’t promote or execute the trades.
| Issue size | |
|---|---|
| Overall | ₹583.0 Cr |
| Fresh Issue | ₹399.0 Cr |
| Offer for Sale | ₹184.0 Cr |
Minimum Investment
₹13,800.0 / 10,000 shares

Merchant Banker
Holani Consultants Pvt.Ltd.
IPO Document
RHP / Anchor Document
Offer Start Date
24th Aug 2026
Offer End Date
27th Aug 2026
Valuation
₹2,005.7 Cr
Revenue (FY'26)
₹2,839.7 Cr
PAT (FY'26)
₹63.5 Cr
Issue Size
₹583.0 Cr
Face Value
₹ 10.0Offer Price
₹ 138.0Lot Size
100.0 sharesSale Type
Fresh capital cum OFSPAT (FY'26)
₹ 63.5 CrPAT Margin (FY'26)
2.3 %P/E Multiple
38.8xEBITDA (FY'26)
₹ 125.7 CrCAGR Growth 3Y
46.9 %ROE (FY'26)
14.2 %ROCE (FY'26)
18.1 %Price to Book Value
4.8xDebt/Equity
1.3xCompany Website
www.skyways-air.inExplore new deals
Overview
Fund Allocation
Total: ₹0 CrSource:Company DRHP
Timeline
IPO Open Date
To Be Announced
IPO Close Date
To Be Announced
Tentative Allotment
To Be Announced
Initiation of Refunds
To Be Announced
Credit of Shares to Demat
To Be Announced
Tentative Listing Date
To Be Announced
Business
Services
Business Model
Geographical Presence
Sales Channel
Key Risk Factor
Financial Highlights
Income Statement
Revenue growth with EBITDA and PAT margins
| Financial Metric | FY 2024 | FY 2025 | FY 2026 |
|---|---|---|---|
| Revenue (₹ Cr) | 1,316.8 | 2,271.0 | 2,839.7 |
| Growth (%) | - | 72.5% | 25.1% |
| EBITDA (₹ Cr) | 48.3 | 86.5 | 125.7 |
| EBITDA Margin (%) | 3.7% | 3.8% | 4.5% |
| PAT (₹ Cr) | 34.5 | 48.1 | 63.5 |
| PAT Margin (%) | 2.7% | 2.1% | 2.3% |
OBSERVATIONS & INSIGHTS
Revenue CAGR across FY24-FY26 was approximately 47.7%, but comparability is affected by acquisitions and freight-rate volatility
EBITDA margin improved by 72 bps from FY24 to FY26, indicating some scale benefit, though the absolute margin remains low for a service intermediary exposed to procurement-cost shocks
PAT margin fell in FY25 despite rapid revenue growth and recovered only partly in FY26, showing that revenue growth does not translate one-for-one into bottom-line growth
Balance Sheet
| Financial Metric | FY 2024 | FY 2025 | FY 2026 |
|---|---|---|---|
| Net Worth | ₹ 186.1 Cr | ₹ 392.3 Cr | ₹ 494.7 Cr |
| Total Assets | ₹ 790.4 Cr | ₹ 1,321.6 Cr | ₹ 1,508.2 Cr |
| Total Borrowing | ₹ 357.3 Cr | ₹ 558.4 Cr | ₹ 624.1 Cr |
OBSERVATIONS & INSIGHTS
Total assets increased from INR 790.4 Cr in FY24 to INR 1,508.2 Cr in FY26. The largest absolute increase came from trade receivables, which rose by INR 261.4 Cr, followed by goodwill and capital work-in-progress, reflecting both operating scale-up and acquisition / infrastructure expansion
Total equity rose from INR 186.1 Cr in FY24 to INR 494.7 Cr in FY26, aided by a larger parent equity base and higher non-controlling interests following acquisitions. Parent-attributable equity reached INR 332.6 Cr, while NCI remained material at INR 162.1 Cr
Current and non-current borrowings together increased from INR 357.3 Cr in FY24 to INR 624.1 Cr in FY26. The liability mix is heavily short-term: FY26 current borrowings of INR 516.9 Cr represented about 82.8% of total borrowings, reinforcing refinancing and working-capital dependence
Cash Flow
| Financial Metric | FY 2024 | FY 2025 | FY 2026 |
|---|---|---|---|
CFO in Cr Cash generated from core business operations. | -9.0 Cr | +2.0 Cr | +113.6 Cr |
CFI in Cr Cash used in / generated from investing activities. | -131.0 Cr | -152.3 Cr | -179.1 Cr |
CFF in Cr Cash from / used in financing activities. | +155.3 Cr | +221.5 Cr | +52.1 Cr |
Working Capital
| Efficiency Metric | FY 2023 | FY 2024 | FY 2025 |
|---|---|---|---|
Debtor Days Average number of days taken to collect customer payments. | - | - | - |
Creditor Days Average time taken to pay suppliers and vendors. | - | - | - |
Inventory Days Average number of days inventory remains unsold. | - | - | - |
CCC (Cash Conversion Cycle) (Debtor Days + Inventory Days - Creditor Days) | - | - | - |
Financial Ratios
Measures the company’s leverage relative to shareholder equity.
OBSERVATIONS & INSIGHTS
ROE declined from 22.4% in FY24 to 14.2% in FY26 even as PAT increased, indicating that the equity / net-worth base expanded faster than earnings
ROCE recovered to 18.1% in FY26 from 14.6% in FY25, showing better utilisation of total capital in the latest year
Debt / Equity improved steadily from 1.9x to 1.3x over FY24-FY26. The direction is positive, but leverage remains material and finance costs continue to absorb a meaningful portion of operating profit, making the IPO debt-repayment object strategically relevant
Current Ratio improved from 1.1x to 1.2x, but the buffer remains thin
Interest Coverage strengthened to 2.5x in FY25 before moderating to 2.3x in FY26; this is adequate rather than comfortable for a low-margin freight-forwarding model exposed to carrier-rate volatility
ROA eased from 6.0% to 4.5%, while Net Fixed Asset Turnover increased from 12.2x to 14.1x. This combination indicates strong fixed-asset utilisation, but the broader balance sheet expanded faster than earnings because receivables, cash / deposits, acquisitions and working-capital needs grew with scale
Industry Overview
Industry Drivers
Structural expansion of India logistics and air cargo
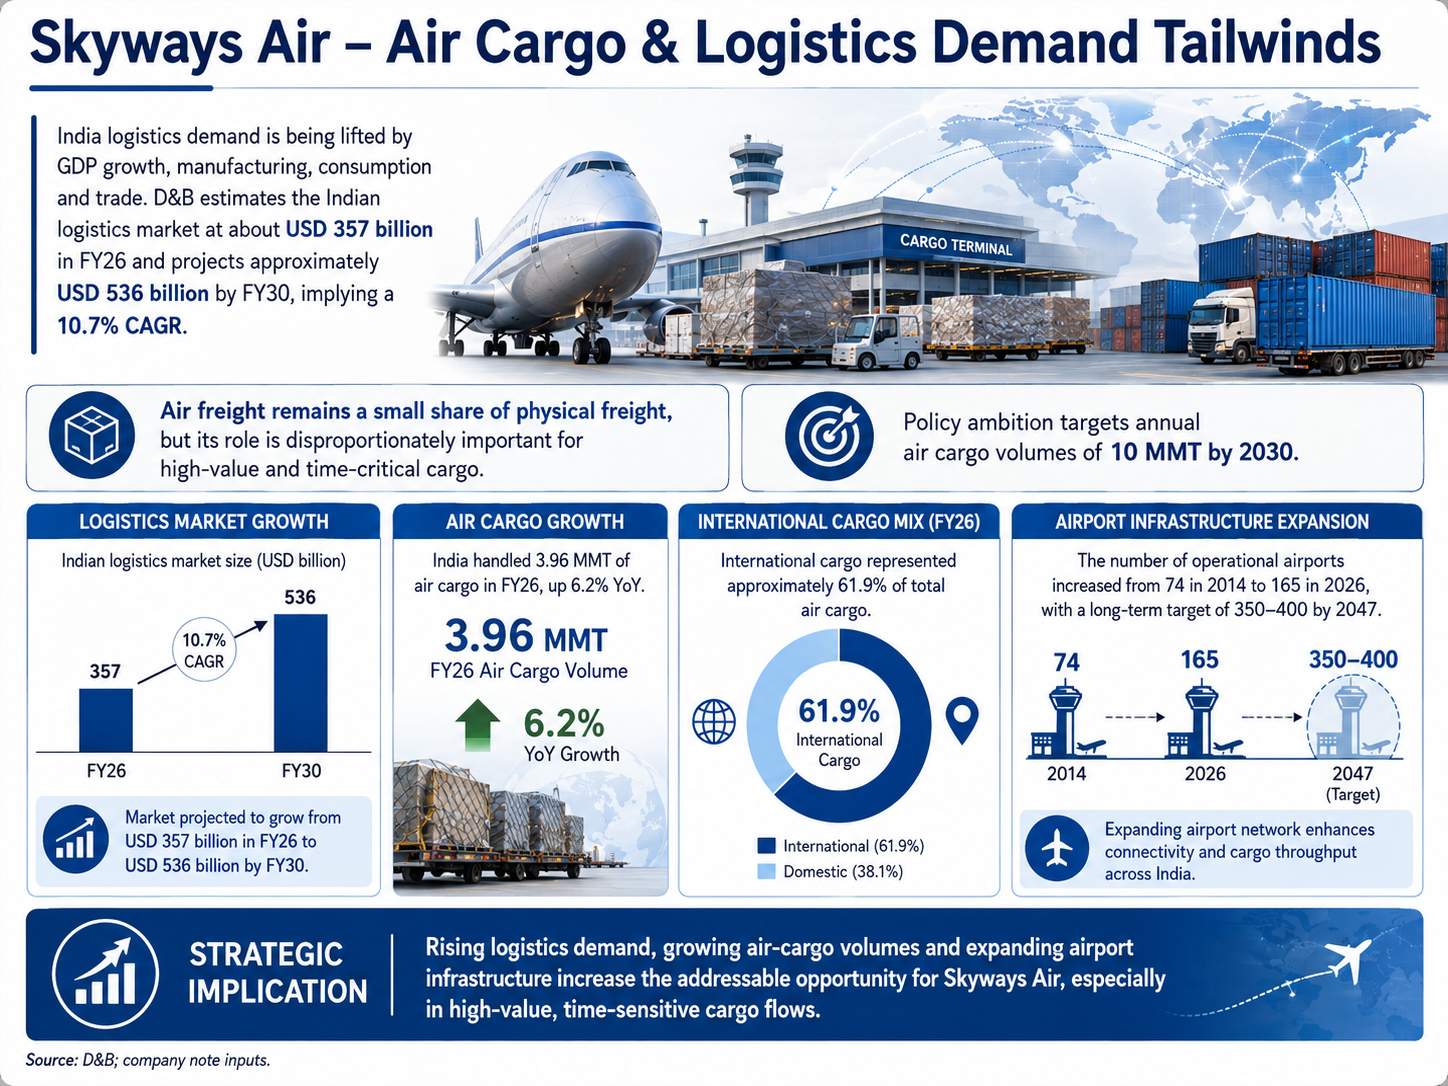
India logistics demand is being lifted by GDP growth, manufacturing, consumption and trade. D&B; estimates the Indian logistics market at about USD 357 billion in FY26 and projects ~USD 536 billion by FY30, implying a 10.7% CAGR. Air freight remains a small share of physical freight, but its role is disproportionately important for high-value and time-critical cargo.
The key drivers are:
India handled 3.96 MMT of air cargo in FY26, up 6.2% YoY; international cargo represented ~61.9% of the total
Policy ambition targets annual air cargo volumes of 10 MMT by 2030
The number of operational airports increased from 74 in 2014 to 165 in 2026, with a long-term target of 350-400 by 2047
Export growth and time-sensitive manufacturing
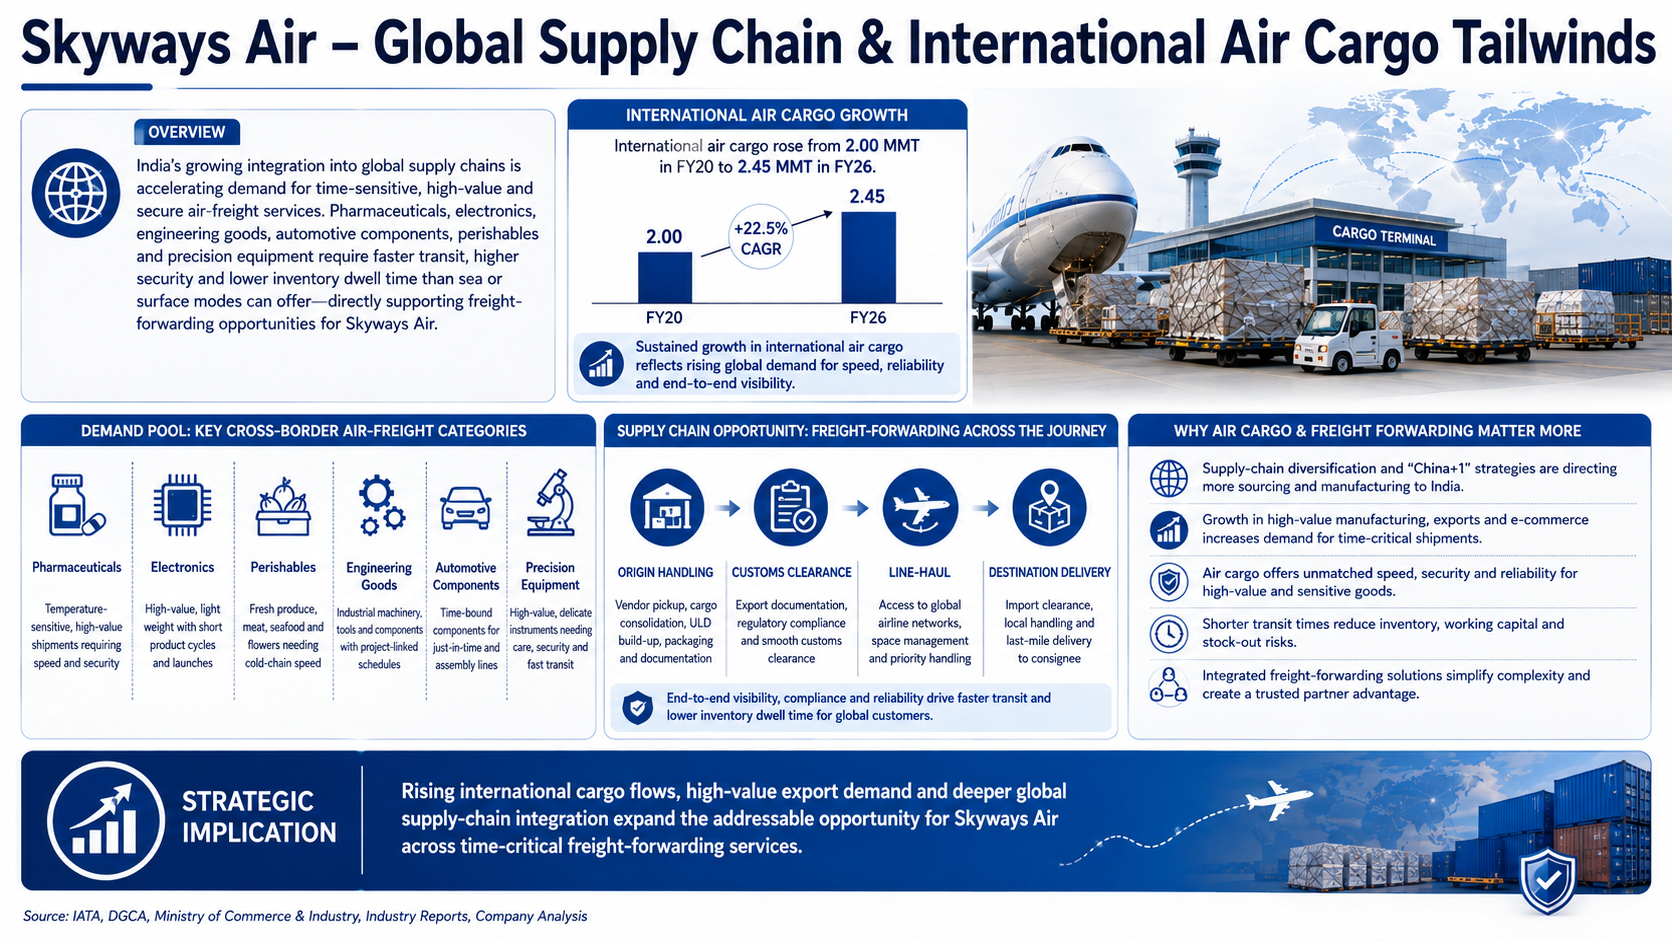
Air cargo benefits from India becoming a deeper node in global supply chains. Pharmaceuticals, electronics, engineering goods, automotive components, perishables and precision equipment need faster transit, higher security and lower inventory dwell time than sea or surface modes can offer
The key drivers:
International air cargo rose from 2.00 MMT in FY20 to 2.45 MMT in FY26
Pharmaceuticals, electronics and perishables are repeatedly highlighted by the industry report as key cross-border air-freight demand pools
Supply-chain diversification and high-value manufacturing create freight-forwarding opportunities across origin handling, customs, line-haul and destination delivery
E-commerce, express logistics and faster delivery expectations
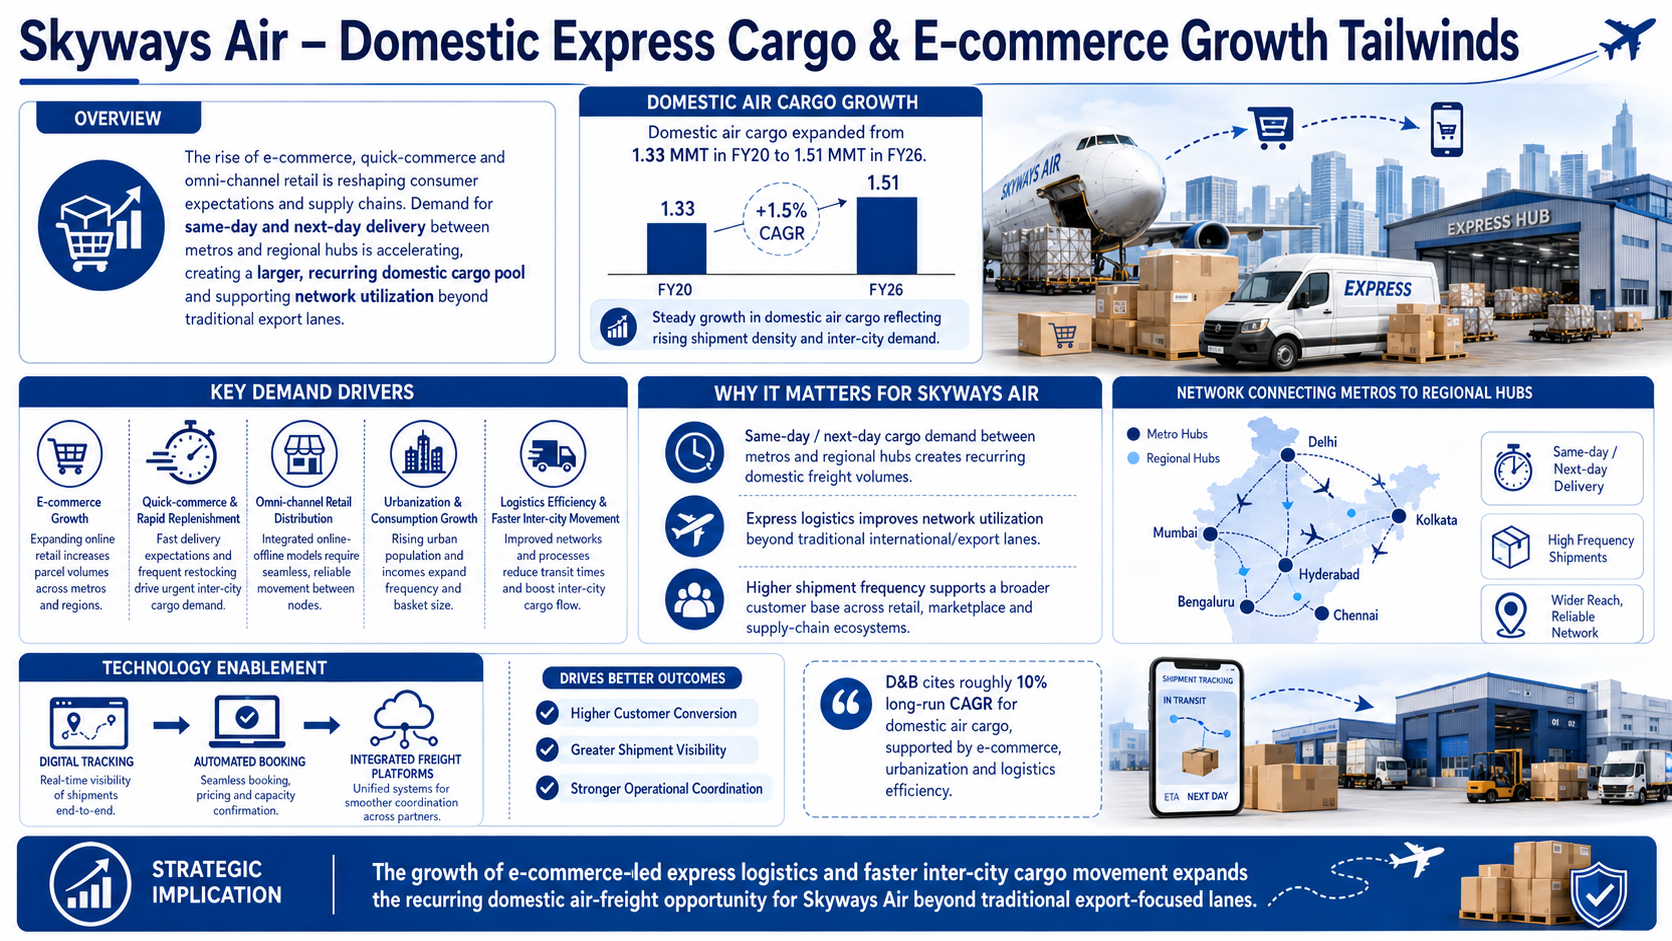
The rise of e-commerce, quick-commerce and omni-channel retail is increasing demand for same-day / next-day transportation between metros and regional hubs. Express logistics creates a larger recurring domestic cargo pool and supports network utilization outside traditional export lanes
The key drivers:
Domestic air cargo has expanded from 1.33 MMT in FY20 to 1.51 MMT in FY26
D&B; cites roughly 10% long-run CAGR for domestic air cargo, supported by e-commerce, urbanization and logistics efficiency
Digital tracking, automated booking and integrated freight platforms can improve customer conversion and shipment visibility
Risks in the Industry
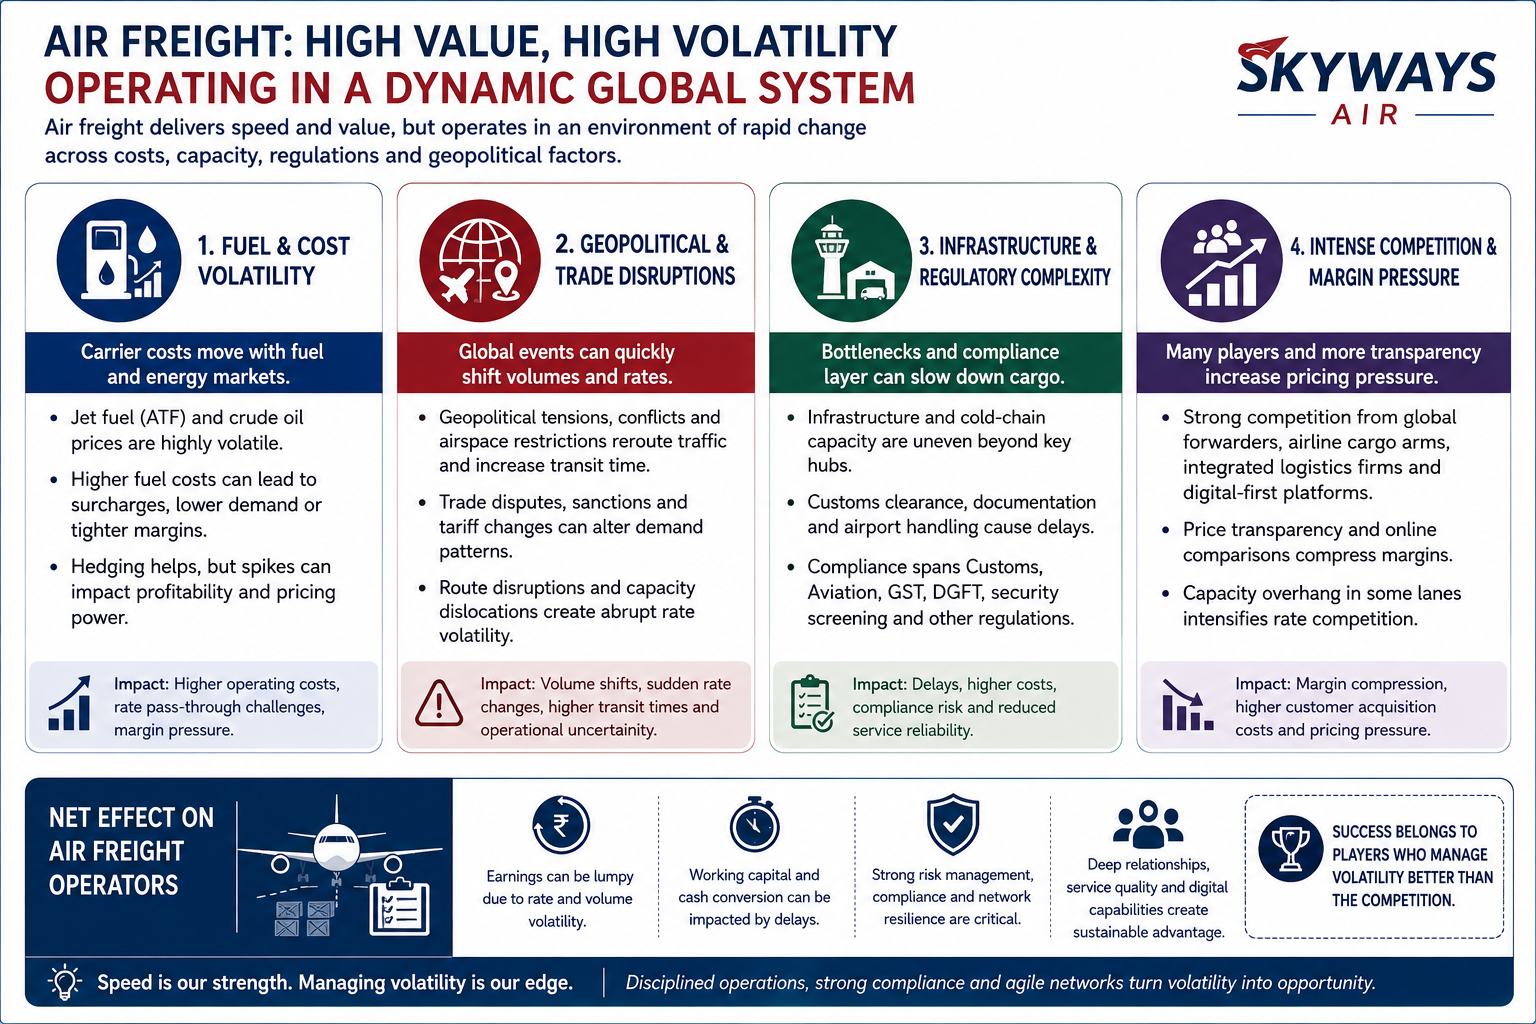
Air freight offers speed and high service value but operates inside a volatile global transport system. Freight rates, fuel prices, capacity availability and trade flows can change quickly, while customs and airport processes can create bottlenecks even when the physical line-haul is fast.
The key risks are:
Fuel / ATF and crude-oil volatility can raise carrier costs and indirectly pressure forwarding spreads or customer demand
Geopolitical disruptions, airspace restrictions, trade disputes and shipping-route shocks can cause both volume shifts and abrupt rate changes
Cargo infrastructure and cold-chain capacity remain uneven outside key hubs; regulatory complexity spans customs, aviation, GST, DGFT and security screening
Competition is intense across global forwarders, airline cargo divisions, integrated logistics companies and technology-led platforms; price transparency can compress margins
Government Policy Support
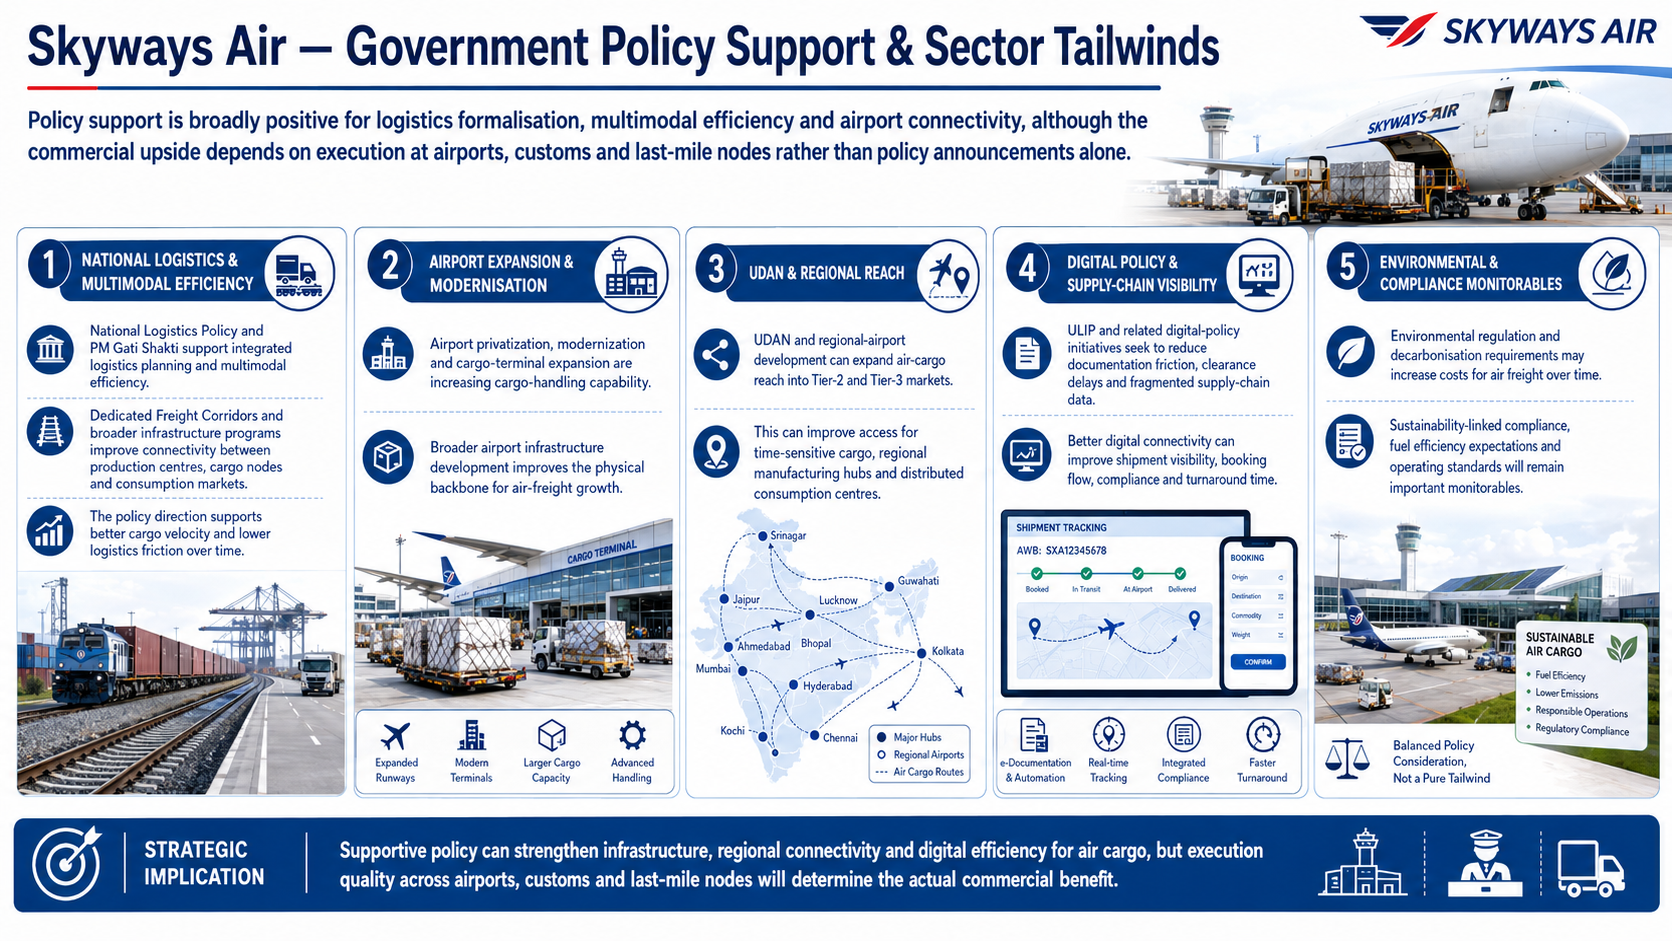
Government policy is broadly supportive of logistics formalisation and multimodal efficiency. National Logistics Policy, PM Gati Shakti, airport expansion, UDAN, ULIP, Dedicated Freight Corridors and broader infrastructure programs create better physical and digital connectivity. The upside, however, depends on execution at airports, customs and last-mile nodes rather than policy announcements alone.
The key policies are:
Airport privatization/modernization and regional-airport expansion are increasing cargo handling capability
UDAN and regional infrastructure can expand air-cargo reach into Tier-2 / Tier-3 markets
Digital policy initiatives seek to reduce documentation, clearance delays and fragmented supply-chain data
Environmental regulation and decarbonisation requirements may increase costs for air freight over time
Fundraise/Future Plans
Shareholding
Pre-issue shareholding
Promoter Holding 0.0%
Post-Issue Shareholding
Promoter Holding 0.0%
Category
Pre-Issue%Post-Issue%
Promoters
Yashpal Sharma
46.5%32.3%
Tarun Sharma
32.6%24.5%
Himanshu Chhabra
3.4%1.5%
Rohit Sehgal
4.0%1.9%
Total Promoter Holding
86.5%60.2%
Additional Shareholders
0.0%0.0%
Total Additional Holding
0.0%0.0%
Total Shareholding
86.5%60.2%
- Overview
- Business
- Financial Highlights
- Industry Overview
- Fundraise/Future Plans
- Documentation
Get the Preqt App and keep in touch around the clock!
 Monitor your investments in real-time.
- Receive tailored deal suggestions.
- Get real-time updates and alerts.
