

Sonaselection India
Textiles Built to PerformFabric Innovation at Scale
IPO Summary (PreQT)
Sonaselection India Limited is an integrated fabric manufacturing and processing company based in Bhilwara, Rajasthan, which transitioned from a predominantly job-work model to manufacturing-led operations after its expanded cotton fabric processing plant became operational in July 2024. The Company manufactures 100% cotton, cotton lycra, cotton blends and polyester blends, while also processing cotton, P/V and polyester fabrics and, from FY26, entering ready-made garments through its subsidiary. FY26 revenue from operations was INR 516.9 Cr, EBITDA INR 84.8 Cr and PAT INR 34.0 Cr; revenue grew 63.6% and PAT 83.3%, while EBITDA margin moderated to 16.4% as the revenue mix shifted toward raw-material-intensive manufacturing. Capacity utilisation was 82.7% on 82.4 million metres per annum. The IPO is a 100% fresh issue of 1.43 Cr shares aggregating up to INR 143.0 Cr at the cap price, with INR 80.0 Cr earmarked for debt reduction and INR 50.6 Cr for machinery. Key monitorables are negative operating cash flow, 134 working-capital days, leverage, single-facility concentration and successful execution of the manufacturing / RMG / technical-textile transition
IPO Review Rating
Above Avg
MainboardCreating Sustainable Fabrics Through Innovation, Precision, and Integrated Manufacturing
Sonaselection India Limited's strongest combination is unusual for a textile IPO: exceptionally high historical Revenue growth, 16.4% EBITDA Margin, 39.1% RoNW, low customer concentration and a valuation below the listed-peer average.
The financial risk is equally clear. Debt/Equity of 2.5x, negative operating cash flow for two consecutive years and 134 working-capital days mean the reported profitability has not yet translated into similarly strong cash generation. The FY24–FY26 Revenue CAGR of 106.7% also should not be extrapolated mechanically because it coincides with a major transition from job work to manufacturing and commissioning of the enlarged plant. Governance is reasonably structured but deserves monitoring. The promoters have substantial sector experience, the Board has 50% independent representation and there is no OFS. Against that, there are historically meaningful related-party transactions, promoter-linked financing/collateral arrangements, some promoter share sales after the DRHP and outstanding proceedings. These issues do not currently look severe enough to overwhelm the positives, but they prevent a top governance score. The valuation is the principal attraction. Post-issue P/E of ~16.5x is at a ~27% discount to the 22.6x peer average and ~9% below the peer median, while the Company's RoNW is substantially higher than all three disclosed peers. EV/EBITDA is closer to industry levels, so Sonaselection should be described as attractively valued on earnings rather than universally cheap across every metric. Finally, the IPO proceeds are constructive: approximately 92% of the gross Fresh Issue is specifically earmarked for debt repayment and plant/machinery capex. That directly attacks the Company's two biggest financial constraints,leverage and capacity.
PARAMETER
WEIGHT
SCORE
KEY FACTORS
Financial Perfornance
40.0%
4.0/5
The Company has exceptional Revenue growth, strong EBITDA Margin, very high RoNW and improving customer diversification. However, these positives are tempered by 2.48x leverage, two consecutive years of negative operating cash flow, increasing working-capital intensity and margin compression as the business mix shifts toward manufacturing
Show more
Detailed Analysis
Revenue increased from INR 121.0 Cr in FY24 to INR 516.9 Cr in FY26, implying an exceptional 106.7% CAGR, albeit from a low base following the manufacturing ramp-up
FY26 EBITDA Margin was a strong 16.4%, but has compressed from 23.6% in FY24 and 18.4% in FY25
FY26 PAT Margin was 6.6%, improving from 5.9% in FY25 but below 10.8% in FY24
FY26 D/E improved from 3.72x in FY24 to 2.5x, but absolute leverage remains high
FY26 RoNW was an exceptional 39.1%, with a three-year weighted RoNW of 37.6
OCF was negative INR 11.0 Cr in FY26 and negative INR 14.2 Cr in FY25 despite positive reported profits
Industry
15.0%
3.0/5
The underlying sector is structurally attractive but highly competitive. Sonaselection benefits from integrated manufacturing, strong certifications and rapid formal-sector growth, but its current business remains overwhelmingly domestic and exposed to textile pricing, working-capital and environmental-compliance risks
Show more
Detailed Analysis
Indian textile & apparel industry is projected to grow from USD 188 Bn in FY26 to USD 350 Bn by FY30 at 16.8% CAGR
Textiles are mature, but organized manufacturing, value-added fabrics, exports and formalization provide structural growth
Environmental compliance, BIS standards, raw-material volatility and sustainability requirements create moderate risk
Management
15.0%
4.0/5
Sonaselection’s management is backed by experienced promoters with 14–32+ years in textiles, supported by a balanced Board with independent representation. Governance is broadly sound, though promoter-linked guarantees, related-party processing arrangements and litigation exposure warrant continued monitoring
Show more
Detailed Analysis
Harshil Nuwal has 14+ years and Subhash Chandra Nuwal 32+ years of textile experience
Six-member Board with three Independent Directors, including one woman Independent Director
Minimum promoter contribution is unpledged, but personal promoter properties/guarantees support borrowings and litigation exists
Historically meaningful group-company processing charges and promoter financing transactions require monitoring
Valuation
20.0%
4.0/5
Sonaselection is valued at a ~27% P/E discount to peers and ~8% EV/EBITDA discount, while delivering materially superior RoNW of 39.1%. Valuation appears attractive relative to peers, supported by strong profitability and return ratios
Show more
Detailed Analysis
Sonaselection trades at 16.5x P/E, representing a ~26.8% discount to the peer average of 22.6x
Sonaselection trades at ~8.0x EV/EBITDA, representing a ~8.0% discount to the peer average of ~8.7x
Sonaselection trades at a pro-forma P/B of ~2.3x
Sonaselection reported 39.1% RoNW, which is ~334% higher than the peer average of ~9.0%
Merchant Banker Track Record
10.0%
4.0/5
Choice Capital has a credible and generally positive recent execution record, particularly across its 2025 mainboard transactions. However, the recent GenXAI negative listing demonstrates that the record is not uniformly strong, and the franchise is smaller than top-tier institutional BRLMs
Show more
Detailed Analysis
A recent six-issue sample gives approximately 7.8% average listing return, although results range from -20% to +14%+
Four 2025 mainboard mandates were subscribed ~57x–97x; 2026 SME outcomes were more moderate/mixed
5 of 6 recent sampled completed issues listed above issue price
TOTAL
100%
3.9/5
Weighted Composite Score
Issue Price
₹94.0 to ₹100.0
As of 17 Sep 2026
GMP
₹8.0
As of 17 Sep 2026
Estimated Gain / Loss
+8.1%
Lot Size
150.0 Shares
Grey Market Premium (GMPs) are shared for knowledge purpose only. PrEqt doesn’t promote or execute the trades.
| Issue Size (in Cr) | |
|---|---|
| Overall | ₹142.0 Cr |
| Fresh Issue | ₹142.0 Cr |
| Offer for Sale | ₹0.0 Cr |
Minimum Investment
₹15,000.0 / 22,500 shares

Merchant Banker
Choice Capital Advisors Pvt.Ltd.
Choice Capital Advisors Pvt.Ltd.
IPO Document
Offer Start Date
Offer End Date
Valuation
Revenue (FY'26)
PAT (FY'26)
Issue Size (in Cr)
Face Value
₹ 10.0Offer Price
₹ 100.0Lot Size
150.0 sharesSale Type
Fresh capital onlyPAT (FY'26)
₹ 34.0 CrPAT Margin (FY'26)
6.6 %P/E Multiple
16.5xEBITDA (FY'26)
₹ 84.8 CrCAGR Growth 2Y
106.7 %ROE (FY'26)
39.1 %ROCE (FY'26)
19.7 %Price to Book Value
2.3xDebt/Equity
2.5xCompany Website
www.sonaselection.comExplore new deals
Overview
Fund Allocation
Total: ₹0 CrSource:Company DRHP
Timeline
IPO Open Date
To Be Announced
IPO Close Date
To Be Announced
Tentative Allotment
To Be Announced
Initiation of Refunds
To Be Announced
Credit of Shares to Demat
To Be Announced
Tentative Listing Date
To Be Announced
Business
Business Model
Geographical Presence
Sales Channel
Key Risk Factor
Financial Highlights
Income Statement
Revenue growth with EBITDA and PAT margins
| Financial Metric | FY 2024 | FY 2025 | FY 2026 |
|---|---|---|---|
| Revenue (₹ Cr) | 121.3 | 316.5 | 517.6 |
| Growth (%) | - | 161.2% | 63.6% |
| EBITDA (₹ Cr) | 28.5 | 58.1 | 84.8 |
| EBITDA Margin (%) | 23.5% | 18.4% | 16.4% |
| PAT (₹ Cr) | 13.1 | 18.6 | 34.0 |
| PAT Margin (%) | 10.8% | 5.9% | 6.6% |
OBSERVATIONS & INSIGHTS
FY25 revenue surged 161.2% as the expanded cotton-processing plant commenced commercial operations in July 2024 and fabric sales scaled sharply; FY26 grew another 63.6% on a full year of plant operations, stabilized marketing, new customers and broader market penetration
EBITDA increased from INR 28.5 Cr in FY24 to INR 84.8 Cr in FY26 as the revenue base scaled and utilisation improved, although growth was slower than revenue because own manufacturing carries higher material and operating costs than job work. EBITDA Margin declined from 23.6% to 18.4% and 16.4% as the mix shifted from high-service / low-material job work toward raw-material-intensive manufacturing and the Company absorbed costs associated with scaling the new operating model
PAT increased 41.8% in FY25 and 83.3% in FY26, reaching INR 34.0 Cr, supported by scale, higher volumes and improved operating efficiency after the initial manufacturing ramp-up. PAT Margin fell from 10.8% in FY24 to 5.9% in FY25 due to the manufacturing transition, higher fixed costs, depreciation, finance costs and material expense; it recovered to 6.6% in FY26 as fixed-cost absorption improved and finance / depreciation grew more slowly than revenue
Balance Sheet
| Financial Metric | FY 2024 | FY 2025 | FY 2026 |
|---|---|---|---|
| Net Worth | ₹ 38.9 Cr | ₹ 70.1 Cr | ₹ 104.2 Cr |
| Total Assets | ₹ 203.5 Cr | ₹ 374.8 Cr | ₹ 475.0 Cr |
| Total Borrowing | ₹ 144.6 Cr | ₹ 207.4 Cr | ₹ 258.2 Cr |
| Reserves & Surplus | ₹ 35.8 Cr | ₹ 47.1 Cr | ₹ 61.6 Cr |
OBSERVATIONS & INSIGHTS
Fixed assets / PPE increased from INR 75.0 Cr in FY24 to INR 183.2 Cr in FY26 as CWIP was commissioned into the expanded processing plant, evidencing the major manufacturing transition
Inventory increased more than eightfold from FY24 to INR 153.9 Cr in FY26, becoming the largest current-asset line and the clearest balance-sheet consequence of own-manufacturing growth
Trade receivables increased from INR 14.0 Cr to INR 103.7 Cr as sales scaled and direct customer credit exposure increased; the rise is consistent with debtor days reaching 61
Reserves / total equity total equity rose to INR 104.2 Cr through earnings and equity-related changes; bonus issues increased share capital but largely represented reclassification within equity rather than new cash
Borrowings total current + non-current borrowings increased from INR 144.6 Cr in FY24 to INR 258.2 Cr in FY26, with a clear shift toward higher current borrowings to fund working capital
Trade payables expanded to INR 81.2 Cr as procurement scaled, providing partial supplier financing against the much larger inventory and receivable base
Cash Flow
| Financial Metric | FY 2024 | FY 2025 | FY 2026 |
|---|---|---|---|
CFO (₹ Cr) Cash generated from core business operations. | +17.6 Cr | -14.2 Cr | -11.0 Cr |
CFI (₹ Cr) Cash used for investments and long-term assets. | -108.1 Cr | -50.4 Cr | -20.0 Cr |
CFF (₹ Cr) Cash flow related to funding and borrowings. | +94.7 Cr | +60.7 Cr | +33.2 Cr |
Working Capital
| Efficiency Metric | FY 2023 | FY 2024 | FY 2025 |
|---|---|---|---|
Debtor Days Average number of days taken to collect customer payments. | - | - | - |
Creditor Days Average time taken to pay suppliers and vendors. | - | - | - |
Inventory Days Average number of days inventory remains unsold. | - | - | - |
CCC (Cash Conversion Cycle) (Debtor Days + Inventory Days - Creditor Days) | - | - | - |
Financial Ratios
Measures the company’s leverage relative to shareholder equity.
OBSERVATIONS & INSIGHTS
ROE remained high at 39.1% in FY26 as PAT grew strongly relative to the equity base, recovering from 34.1% in FY25
ROCE improved steadily to 19.7% in FY26, reflecting higher EBIT generation as the expanded manufacturing base scaled
ROA closing-balance proxy improved to 7.2% in FY26 as PAT growth outpaced asset growth after a weak FY25 transition year
Current Ratio remained around 1.2x-1.3x; liquidity is supported by large inventories / receivables rather than cash, so headline current ratio overstates immediately available liquidity
Debt / Equity improved from approximately 3.6x to 2.5x but remains elevated; the INR 80.0 Cr IPO debt-repayment object should materially reduce leverage
Interest Coverage fell during the FY25 capex / leverage step-up, then recovered to approximately 3.7x in FY26 as EBIT rose faster than finance cost
Industry Overview
Industry Drivers
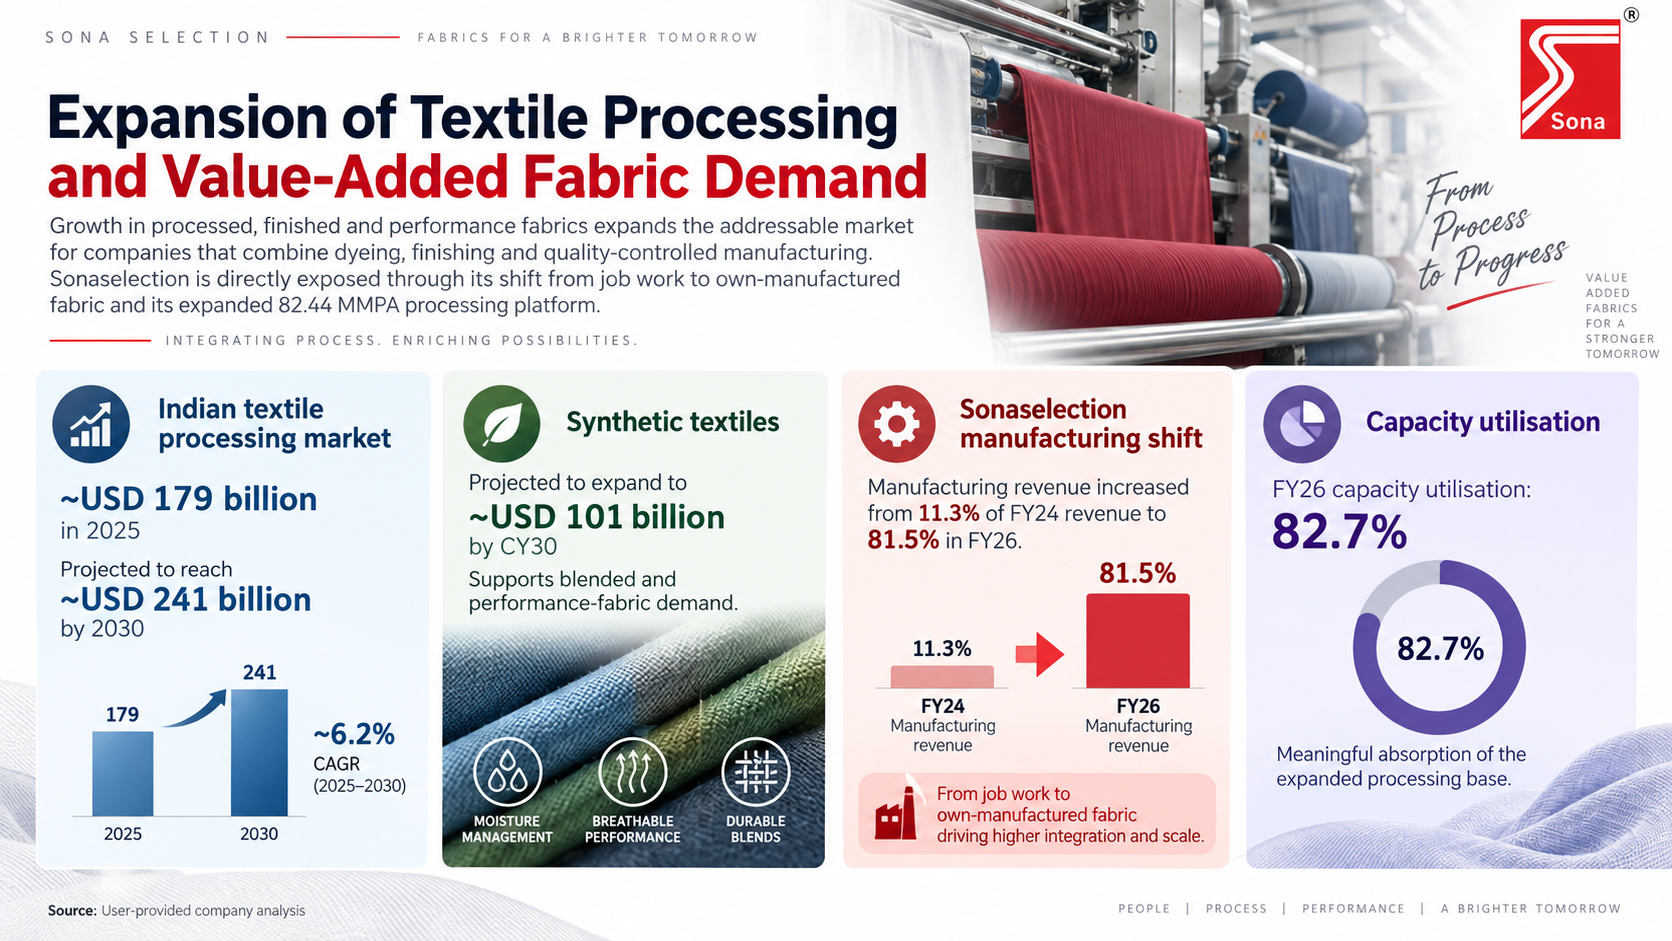
Expansion of Textile Processing and Value-Added Fabric Demand
Growth in processed, finished and performance fabrics expands the addressable market for companies that combine dyeing, finishing and quality-controlled manufacturing. Sonaselection is directly exposed through its shift from job work to own-manufactured fabric and its expanded 82.44 MMPA processing platform.
The key drivers are:
• Indian textile processing market: approximately USD 179 billion in 2025, projected to reach about USD 241 billion by 2030
• Synthetic textiles are projected to expand to approximately USD 101 billion by CY30, supporting blended and performance-fabric demand
• Sonaselection manufacturing revenue increased from 11.3% of FY24 revenue to 81.5% in FY26
• FY26 capacity utilisation was 82.7%, showing meaningful absorption of the expanded processing base
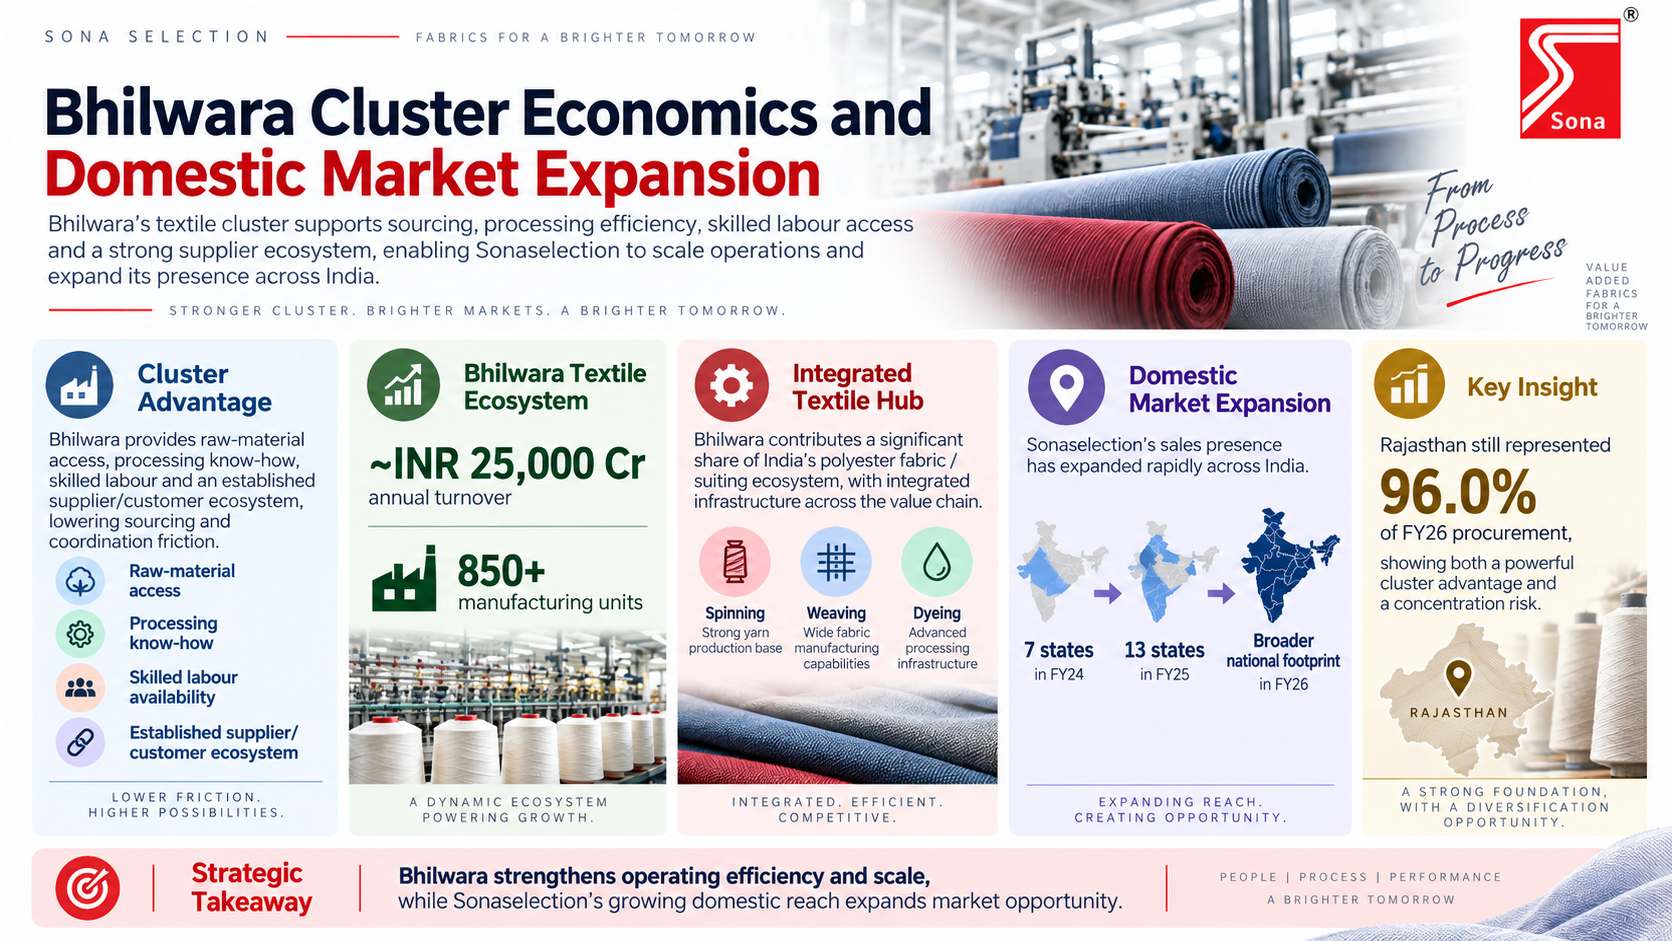
Bhilwara Cluster Economics and Domestic Market Expansion
Bhilwara provides raw-material access, processing know-how, skilled labour and an established supplier / customer ecosystem. This cluster advantage lowers sourcing and coordination friction as Sonaselection expands direct manufacturing sales across India.
The key drivers are:
• Bhilwara textile economy is cited at roughly INR 25,000 Cr annual turnover and more than 850 manufacturing units in the industry report
• Bhilwara contributes a significant share of India's polyester fabric / suiting ecosystem and has integrated spinning, weaving and dyeing infrastructure
• Sonaselection expanded sales presence from 7 states in FY24 to 13 states in FY25 and a broader national footprint in FY26
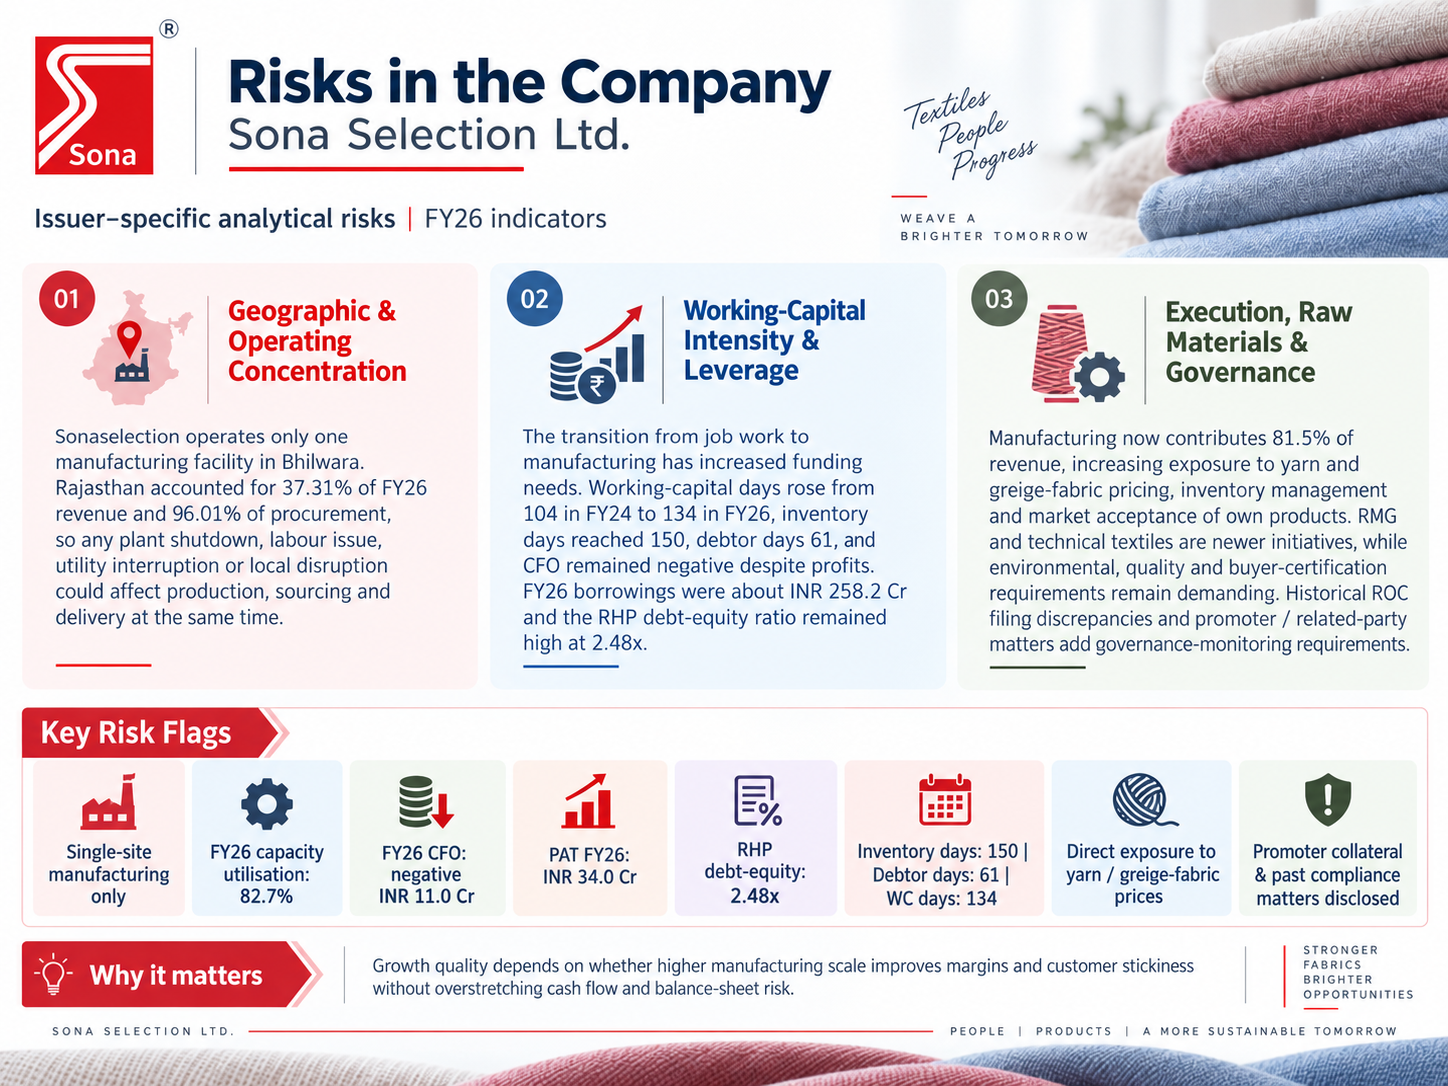
• Rajasthan still represented 96.0% of FY26 procurement, highlighting both cluster advantage and concentration risk
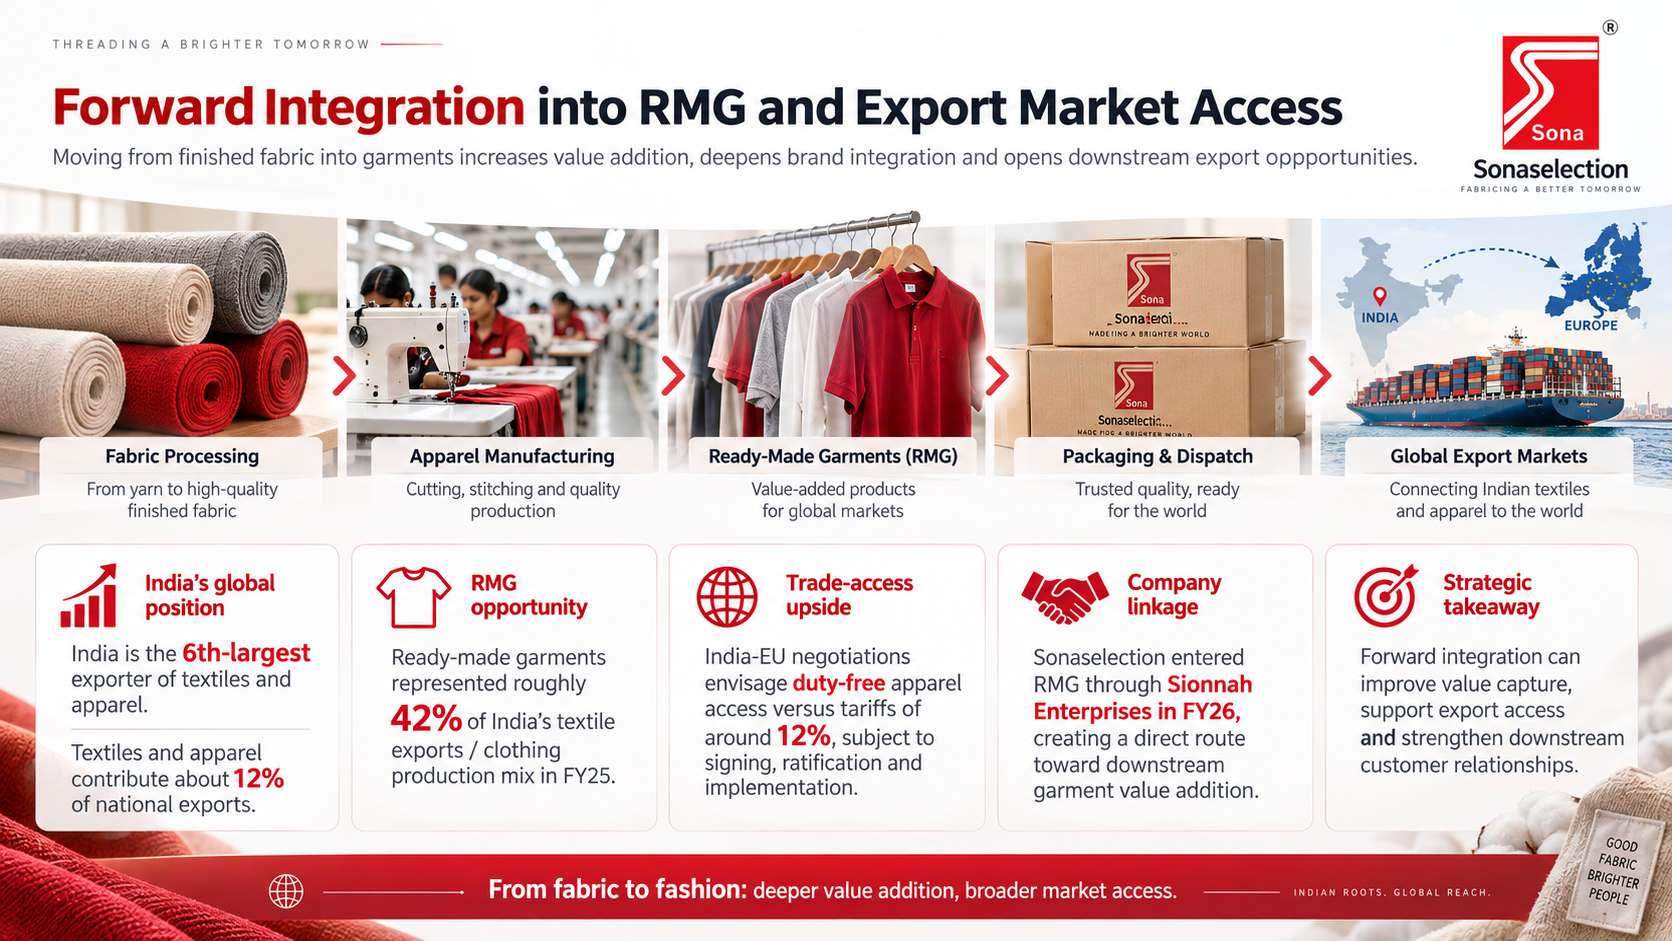
Forward Integration into RMG and Export Market Access
Moving from finished fabric into garments raises value addition and allows closer integration with apparel brands. India is a major textile / apparel exporter, and improved trade access can increase downstream garment orders and thereby fabric demand.
The key drivers are:
• India is the 6th-largest exporter of textiles and apparel according to the industry report; textiles / apparel contribute about 12% of national exports
• RMG represented roughly 42% of India's textile exports / clothing production mix cited for FY25 in the report
• India-EU negotiations envisage duty-free apparel access versus tariffs of around 12%, subject to signing / ratification and implementation
• Sonaselection entered RMG through Sionnah Enterprises in FY26, creating a direct route toward downstream garment value addition
Risks in the Industry
Textile manufacturing and processing remain exposed to raw-material price volatility, energy / water intensity, global trade cycles and intense price competition. Cotton and yarn pricing can move with crop conditions and government procurement; synthetic-fibre economics are linked to crude oil. Processors must also meet increasingly stringent environmental, traceability and buyer-quality standards, which can raise compliance and capex requirements.
The key risks are:
• Cotton / yarn volatility can compress spreads where input-cost increases cannot be passed through immediately
• Fragmented industry structure and surplus domestic capacity can trigger price undercutting and pressure processor margins
• Export demand is sensitive to global retail cycles, trade barriers, freight disruption and competition from China, Bangladesh and Vietnam
• Dyeing / processing is water-, chemical- and energy-intensive, making environmental compliance, ZLD and energy efficiency structurally important
Government Policy Support
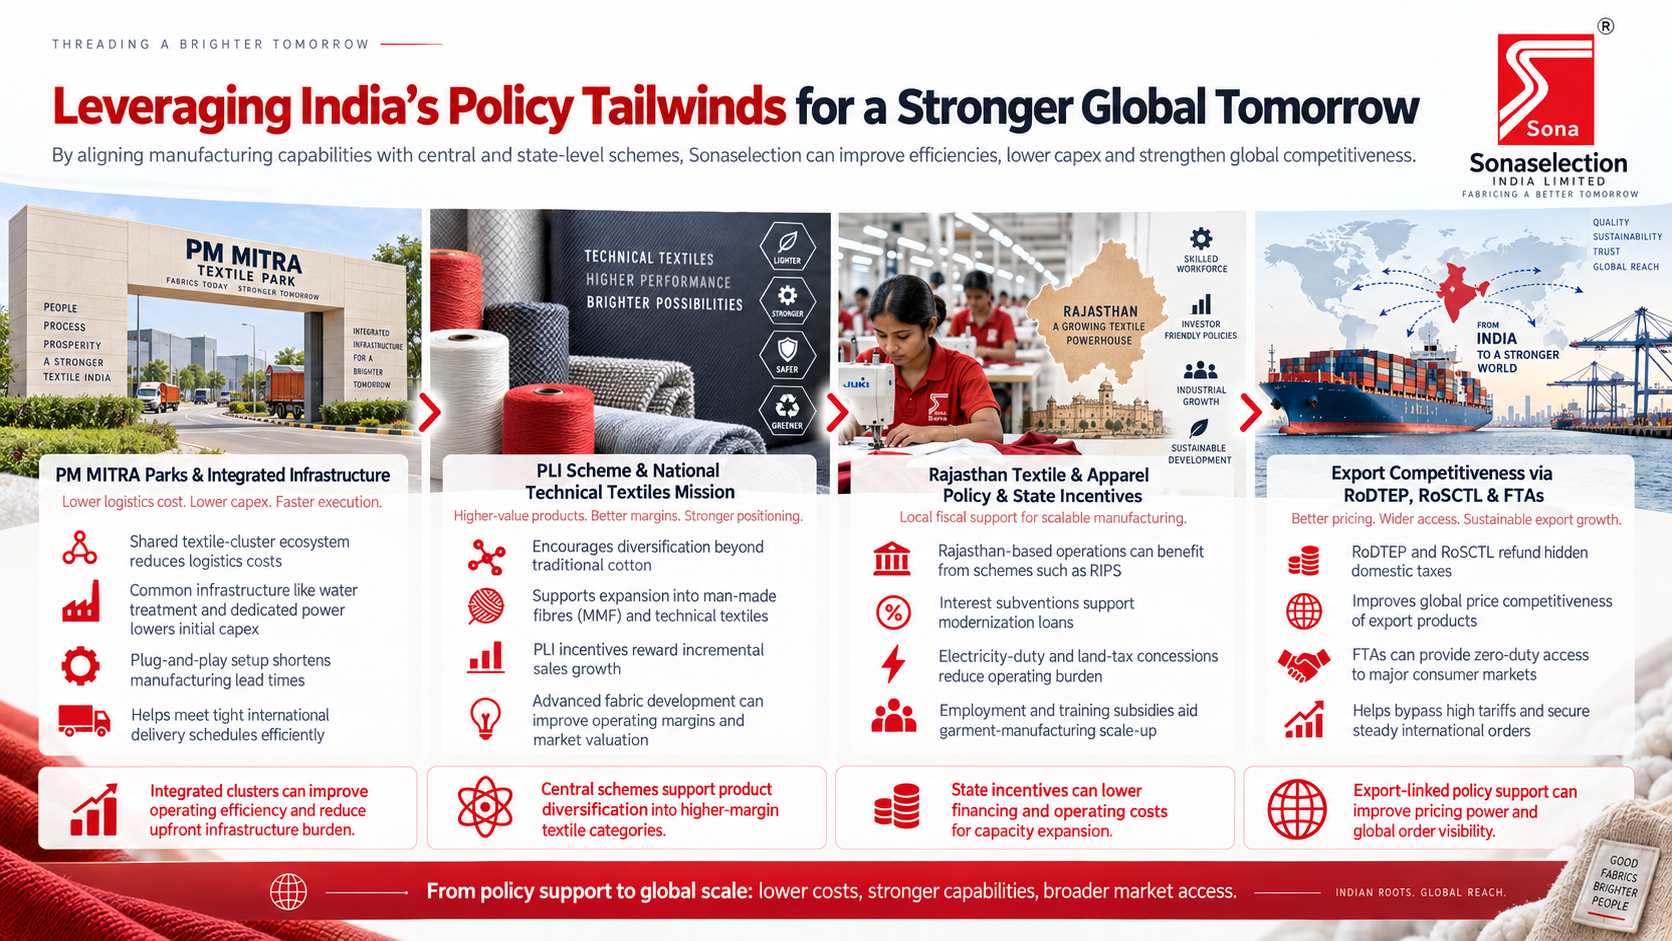
Sonaselection India Limited is strategically positioned to leverage India’s shifting regulatory landscape. By aligning its manufacturing capabilities with both central and state-level schemes, the company can drive operational efficiencies, reduce capital expenditure, and boost global competitiveness.
The key policies are:
PM MITRA Parks & Integrated Infrastructure: By tapping into integrated textile clusters, Sonaselection can drastically lower its logistics costs through shared supply chain ecosystems. Access to pre-built, common infrastructure, like mega water treatment plants and dedicated power lines, slashes initial capital expenditure. This localized plug-and-play setup shortens manufacturing lead times, allowing the company to meet tight international delivery schedules efficiently
PLI Scheme & National Technical Textiles Mission: These central initiatives incentivize Sonaselection to diversify beyond traditional cotton into high-margin man-made fibres (MMF) and functional technical textiles. Meeting the Production Linked Incentive (PLI) targets unlocks direct financial incentives on incremental sales, significantly boosting operating margins. Meanwhile, the technical mission provides a framework for advanced fabric development, elevating Sonaselection's market valuation
Rajasthan Textile & Apparel Policy & State Incentives: As a Rajasthan-based manufacturer, Sonaselection stands to gain immediate fiscal relief from state-level schemes like RIPS. The policy offers substantial interest subventions on modernization loans, alongside long-term concessions on electricity duties and land taxes. Furthermore, direct employment subsidies for training local workers help mitigate the operational costs of scaling up downstream garment manufacturing units
Export Competitiveness via RoDTEP, RoSCTL, and FTAs: Duty remission programs like RoSCTL and RoDTEP refund hidden domestic taxes, allowing Sonaselection to price its export products far more competitively on the global stage. Simultaneously, India’s newly signed and upcoming Free Trade Agreements (FTAs) grant zero-duty access to major consumer markets. This structural advantage helps Sonaselection bypass steep import tariffs and secure steady international orders
Fundraise/Future Plans
Shareholding
Pre-issue shareholding
Promoter Holding 0.0%
Post-Issue Shareholding
Promoter Holding 0.0%
Category
Pre-Issue%Post-Issue%
Promoters
Harshil Nuwal
17.0%12.8%
Subhash Chandra Nuwal
0.0%0.0%
Uma Nuwal
0.0%0.0%
Deepank Bhandari
41.5%31.0%
Sona Polyspin Pvt. Ltd.
27.7%20.7%
Total Promoter Holding
86.2%64.5%
Additional Shareholders
Other Shareholders
13.8%35.5%
Total Additional Holding
13.8%35.5%
Total Shareholding
100.0%100.0%
- Overview
- Business
- Financial Highlights
- Industry Overview
- Fundraise/Future Plans
- Documentation
Get the Preqt App and keep in touch around the clock!
 Monitor your investments in real-time.
- Receive tailored deal suggestions.
- Get real-time updates and alerts.
