


Spray Engineering Devices Ltd.
Engineering process EfficiencyTechnology that Optimizes
IPO Review and Rating
Strong Buy
Overall Recommendation
Spray Engineering Devices is an attractive company from an industry-positioning and technology perspective. It has experienced promoters, more than 100 patents, significant internal R&D capability, exposure to ethanol, biofuel, sugar-efficiency and water-recycling capex, and an order book of approximately INR 840.0 Cr. The balance sheet is also significantly stronger following the FY25 equity raise, with D/E around 0.4x. Revenue declined to INR 461.0 Cr, core EBITDA nearly halved to INR 38.8 Cr, PAT fell to INR 15.0 Cr, and CFO turned negative at INR 28.8 Cr. Receivables and inventory both increased to more than INR 114.0 Cr, while ICRA separately highlights the ageing of debtors and retention-money cycle
PARAMETER
WEIGHT
SCORE
KEY FACTORS
Financial Performance
25.0%
2.3/5
Strong balance-sheet capitalisation is offset by severe FY25 margin compression, declining PAT, negative operating cash flow and stretched receivables
Show more
Detailed Analysis
FY25 revenue declined 15.8% to INR 461.0 Cr after an exceptionally strong FY24. FY23-FY25 CAGR remains positive at approximately 8.4%, but near-term momentum weakened sharply
EBITDA fell to approximately INR 38.8 Cr, with margin compressing from 16.2% to 8.4%
PAT fell 71.7% to INR 15.0 Cr, while PAT margin declined from 9.7% to 3.3%
Gross debt was approximately INR 79.8 Cr, but the large equity infusion increased equity to INR 205.0 Cr, reducing D/E to a healthy 0.4x
FY25 ROE on average equity was approximately 9.2%, materially weaker than the company's earlier profitability profile
CFO reversed from positive INR 19.1 Cr in FY24 to INR (28.8) Cr in FY25 despite reported profitability
Industry
25.0%
3.7/5
Ethanol, energy-efficiency and ZLD investment provide strong structural demand, while SEDL's R&D and patent portfolio create meaningful entry barriers
Show more
Detailed Analysis
Biofuel, ethanol, energy-efficiency and industrial water-recycling investments provide strong structural equipment demand
Sugar equipment is mature, but ethanol, ZLD, water recycling and energy-efficient process systems remain in a strong investment cycle
SEDL's specialised engineering and extensive patent base create meaningful differentiation, although industrial project markets remain competitive
India's ethanol programme and industrial environmental requirements directly support several of SEDL's key end markets
Management
25.0%
3.5/5
Deep promoter experience, high ownership, strong R&D execution and clean consolidated audits are positives; subsidiary health and related-party activity require monitoring
Show more
Detailed Analysis
Ethanol, energy-efficiency and ZLD investment provide strong structural demand, while SEDL's R&D and patent portfolio create meaningful entry barriers
Consolidated audit is unmodified and internal controls are effective, but pending claims, guarantees and one subsidiary's net-worth erosion warrant monitoring
RPTs are disclosed, including subsidiary transactions and promoter/KMP remuneration
Valuation Metrics
25.0%
3.5/5
SEDL is inexpensive across earnings, sales, book value and enterprise-value metrics, but FY25's earnings deterioration explains part of the discount
Show more
Detailed Analysis
At 14.3x, SEDL trades at an approximately 68.2% discount to the supplied industry P/E of 45.0x
FY25 EV/EBITDA of approximately 7.2x is inexpensive, although FY25 EBITDA itself is depressed and requires normalisation evidence
At approximately 1.0x book, valuation provides good balance-sheet support, though FY25 ROE of only 9.2% explains part of the discount
TOTAL
100%
3.3/5
Weighted Composite Score
Per Share Price
₹85.0
As of 24 Oct 2026
Lot Size
12.0 Shares
Minimum Investment
₹1,020.0 / 12 shares
Market Cap. (₹ Cr)
Revenue FY’25
PAT FY’25
P/E Multiple
Face Value
₹ 10.0Lot Size
12.0 sharesSale Type
Secondary SalePAT FY’25
₹ 15.0 CrPAT Margin (%)
3.3 %P/E Multiple
14.3xCAGR Growth 3Y
8.4 %ROE (FY’25)
9.1 %ROCE (FY’25)
13.2 %Price to Book Value ratio
1.0xDebt/Equity (FY’25)
0.4xMerchant banker appointed
❌ NoCompany Website
www.sprayengineering.comDisclaimer: Unlisted shares are unregulated & illiquid. This is NOT investment advice. Please do your own due diligence before investing.
Minimum Investment
₹1,020.0 / 12 sharesShares Lot 12 X 1
Investment amount
₹1,020.0
Overview
Business
Products
Business Model
Geographical Presence
Sales Channel
Financial Highlights
Income Statement
Revenue growth with EBITDA and PAT margins
| Financial Metric | FY 2024 | FY 2025 |
|---|---|---|
| Revenue (₹ Cr) | 547.3 | 461.0 |
| Growth (%) | 39.4% | -15.8% |
| EBITDA (₹ Cr) | 88.7 | 38.7 |
| EBITDA Margin (%) | 16.2% | 8.4% |
| PAT (₹ Cr) | 53.2 | 15.0 |
| PAT Margin (%) | 9.7% | 3.3% |
OBSERVATIONS & INSIGHTS
Revenue fell 15.8% as export execution was delayed. Operating margin almost halved to 8.4%, showing meaningful operating and mix sensitivity
Revenue more than doubled between FY22 standalone and FY24 consolidated, supported by sugar-sector momentum and diversification into water, ethanol and biofuel
PAT declined 71.7% in FY25, materially faster than revenue. Fixed project costs, lower absorption, finance cost and input/mix effects amplified the revenue slowdown
Balance Sheet
| Financial Metric | FY 2024 | FY 2025 |
|---|---|---|
| EQUITY & LIABILITIES | ₹ 302.2 Cr | ₹ 419.6 Cr |
| Net Worth | ₹ 123.3 Cr | ₹ 205.0 Cr |
| Share Capital | ₹ 22.6 Cr | ₹ 25.1 Cr |
| Reserves & Surplus | ₹ 100.7 Cr | ₹ 179.9 Cr |
| Total Liabilities | ₹ 178.9 Cr | ₹ 214.6 Cr |
| Current Liabilities | ₹ 157.9 Cr | ₹ 196.9 Cr |
| Borrowings | ₹ 54.3 Cr | ₹ 62.1 Cr |
| Trade Payables | ₹ 56.0 Cr | ₹ 42.0 Cr |
| Other Current Liabilities | ₹ 47.6 Cr | ₹ 92.8 Cr |
| Non-Current Liabilities | ₹ 21.0 Cr | ₹ 17.7 Cr |
| Borrowings | ₹ 21.0 Cr | ₹ 17.7 Cr |
| Other Non-Current Liabilities | ₹ 0.0 Cr | ₹ 0.0 Cr |
| ASSETS | ₹ 301.6 Cr | ₹ 418.7 Cr |
| Current Assets | ₹ 204.0 Cr | ₹ 286.0 Cr |
| Trade Receivables | ₹ 86.8 Cr | ₹ 114.2 Cr |
| Inventory | ₹ 76.1 Cr | ₹ 114.2 Cr |
| Cash & Cash Equivalents | ₹ 11.6 Cr | ₹ 13.0 Cr |
| Other Current Assets | ₹ 29.5 Cr | ₹ 44.6 Cr |
| Non-Current Assets | ₹ 97.6 Cr | ₹ 132.7 Cr |
| Fixed Assets | ₹ 93.5 Cr | ₹ 127.6 Cr |
| Other Non-Current Assets | ₹ 4.1 Cr | ₹ 5.1 Cr |
OBSERVATIONS & INSIGHTS
Total assets increased 38.9%, driven mainly by working capital, PPE and intangibles rather than cash accumulation
Total equity increased to INR 205.0 Cr after private placement and retained earnings, improving book leverage and supporting the 1.0x supplied P/B
Receivables and inventory together represented 54.5% of FY25 assets. Their recoverability and project linkage are more important than the headline current ratio
Cash Flow
| Financial Metric | FY 2024 | FY 2025 |
|---|---|---|
CFO (₹ Cr) Cash generated from core business operations. | +19.1 Cr | -28.8 Cr |
CFI (₹ Cr) Cash used for investments and long-term assets. | -27.8 Cr | -40.6 Cr |
CFF (₹ Cr) Cash flow related to funding and borrowings. | +7.7 Cr | +71.3 Cr |
Working Capital
| Efficiency Metric | FY 2023 | FY 2024 | FY 2025 |
|---|---|---|---|
Debtor Days Average number of days taken to collect customer payments. | - | - | - |
Creditor Days Average time taken to pay suppliers and vendors. | - | - | - |
Inventory Days Average number of days inventory remains unsold. | - | - | - |
CCC (Cash Conversion Cycle) (Debtor Days + Inventory Days - Creditor Days) | - | - | - |
Financial Ratios
Measures the company’s leverage relative to shareholder equity.
OBSERVATIONS & INSIGHTS
Equity infusion improved debt/equity to 0.4x-0.5x despite higher working-capital borrowing. Balance-sheet leverage appears manageable on a book basis
Interest coverage fell from 8.9x to 3.4x and total debt/OPBDIT rose to 2.4x because FY25 operating profit contracted sharply
The current ratio improved to 1.6x, but the quality of current assets weakened as inventory and receivables expanded while operating cash flow turned negative
Industry Overview
Industry Drivers
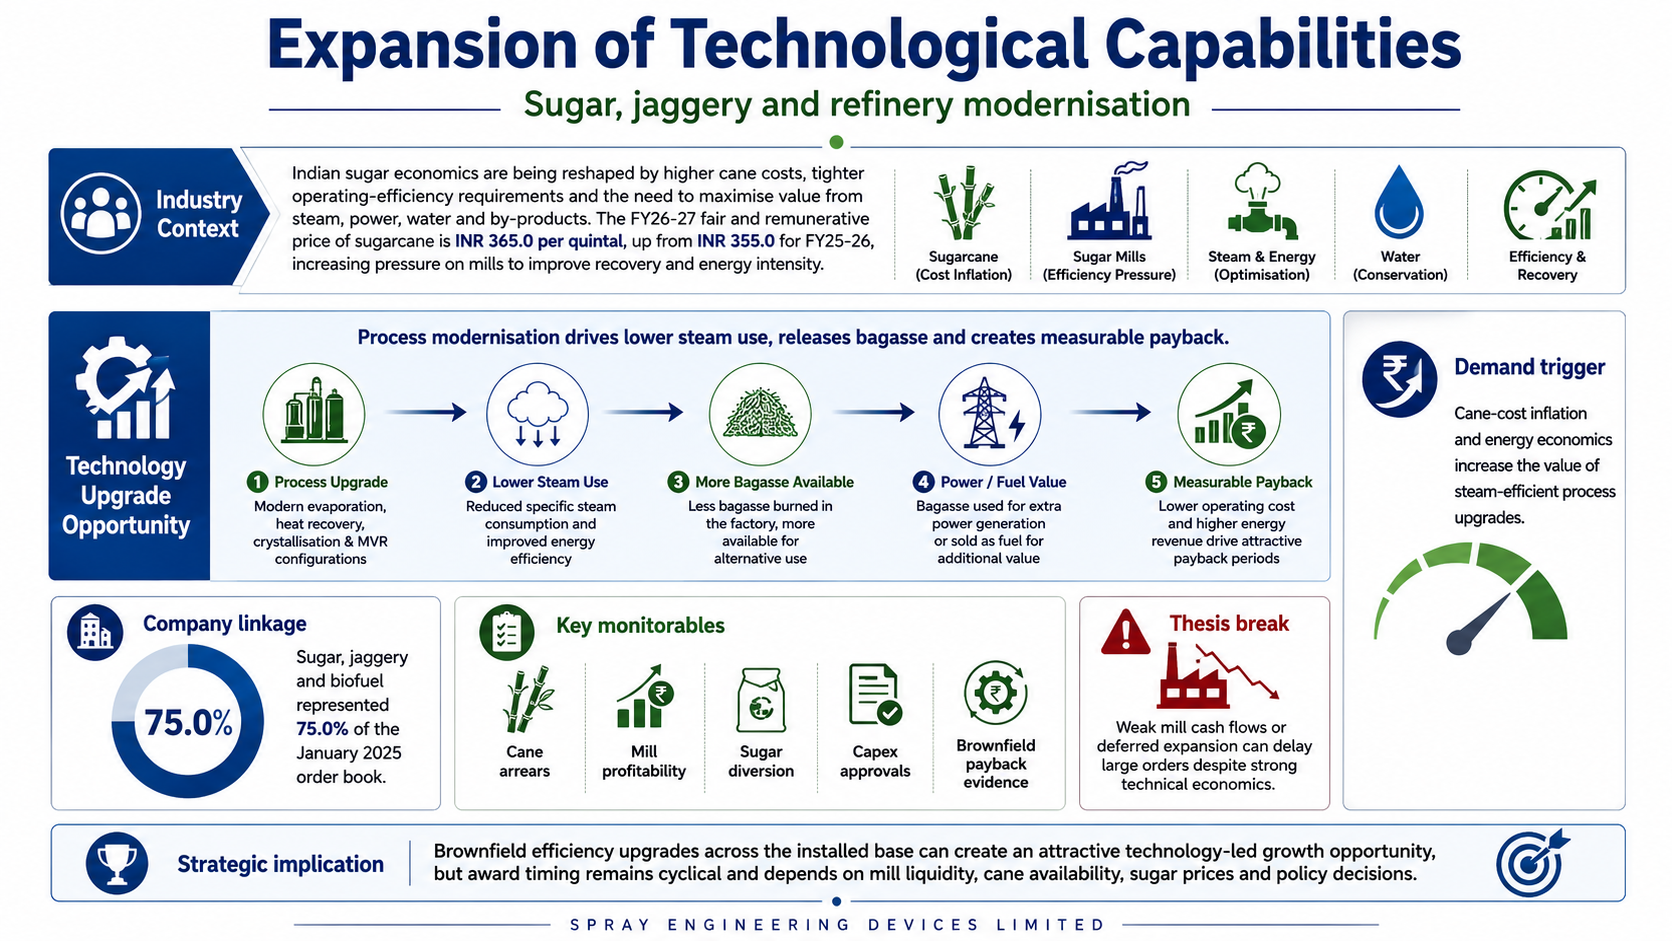
Sugar, jaggery and refinery modernisation
Indian sugar economics are being reshaped by higher cane costs, tighter operating efficiency requirements and the need to maximise value from steam, power, water and by-products
The FY26-27 fair and remunerative price of sugarcane is INR 365.0 per quintal, up from INR 355.0 for FY25-26, increasing the pressure on mills to improve recovery and energy intensity
Modern evaporation, heat recovery, crystallisation and MVR configurations can reduce steam demand and release bagasse for power or fuel, creating a measurable payback
The opportunity is not only new capacity: brownfield upgrades across a large installed base can be attractive where energy savings fund capex
However, mill liquidity, cane availability, sugar prices and government diversion/export decisions make award timing cyclical
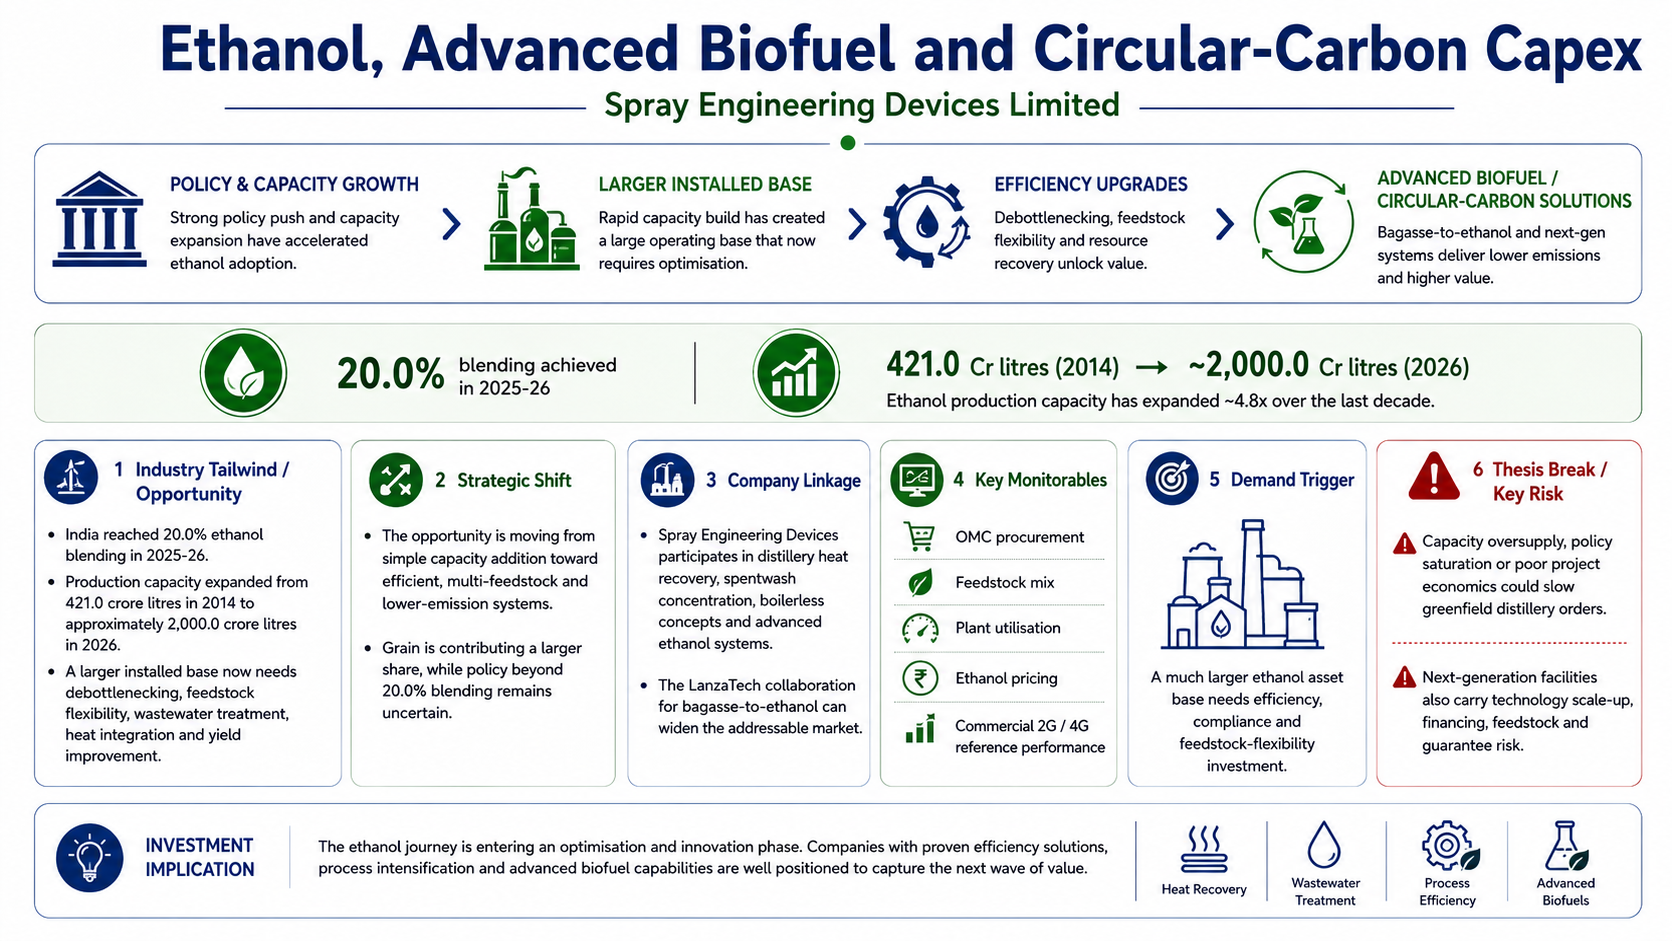
Ethanol, advanced biofuel and circular-carbon capex
India reached 20.0% ethanol blending in 2025-26, while production capacity expanded from 421.0 crore litres in 2014 to approximately 2,000.0 crore litres in 2026
This creates a large installed base that requires debottlenecking, feedstock flexibility, wastewater treatment, heat integration and yield improvement
The opportunity is shifting from simple capacity addition toward efficient, multi-feedstock and lower-emission systems as grain contributes a larger share and policy beyond 20.0% blending remains uncertain
The Company participates in distillery heat recovery, spentwash concentration, boilerless concepts and advanced ethanol
Its LanzaTech collaboration for bagasse-to-ethanol can widen the addressable market, but next-generation facilities carry technology scale-up, financing, feedstock and guarantee risk
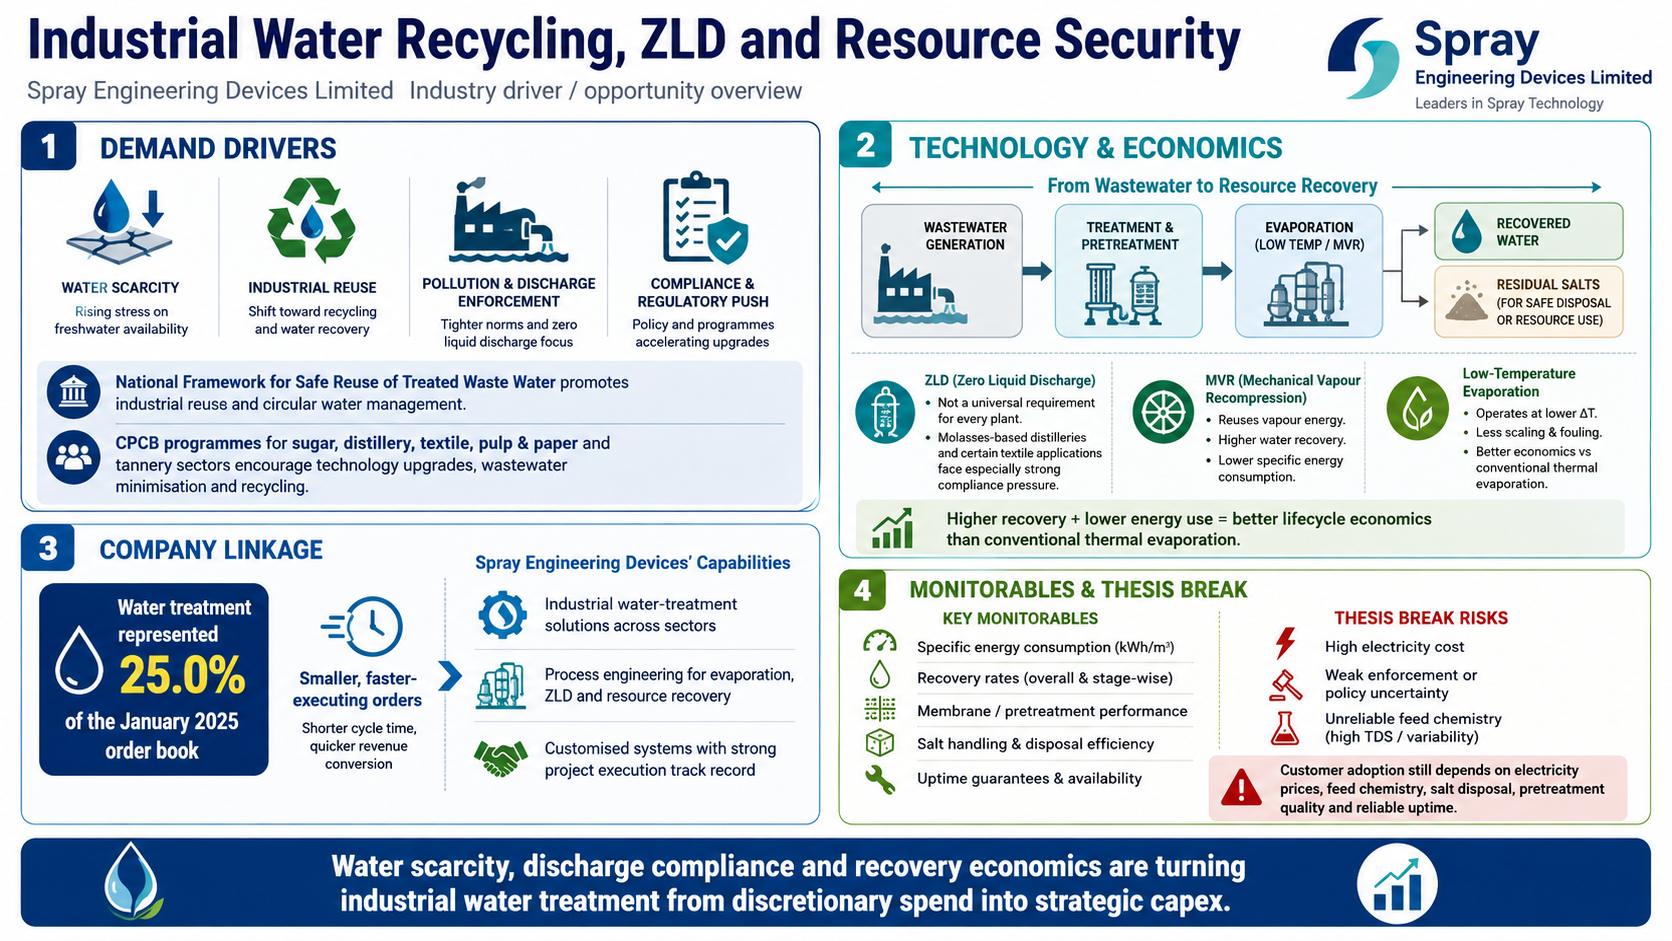
Industrial water recycling, ZLD and resource security
Industrial water demand, pollution enforcement and the economics of freshwater scarcity support investment in reuse, evaporation and zeroliquid-discharge systems
The National Framework for Safe Reuse of Treated Waste Water promotes industrial reuse, while CPCB programmes for sugar, distillery, textile, pulp and paper and tannery emphasise technology upgrades, wastewater minimisation and recycling
ZLD is not a universal requirement for every plant, but molasses-based distilleries and certain textile applications face particularly strong compliance pressure
MVR and low-temperature evaporation can recover water and reduce fuel use, which can improve lifecycle economics versus conventional thermal evaporation
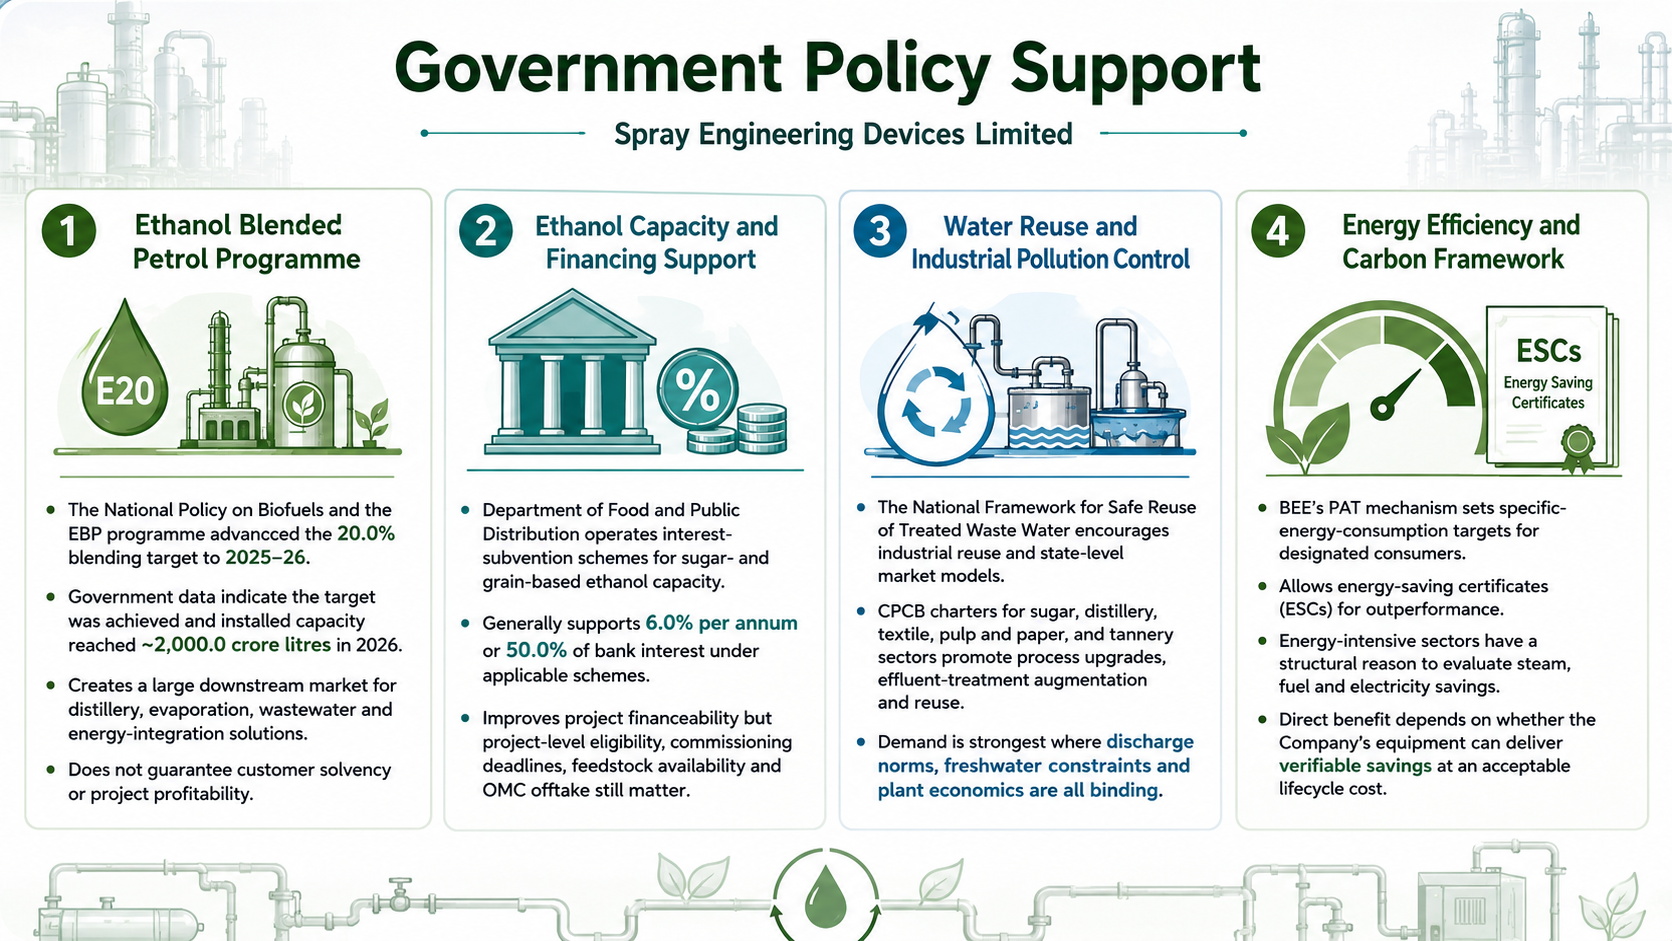
Government Policy Support
Ethanol Blended Petrol programme: The National Policy on Biofuels and the EBP programme advanced the 20.0% blending target to 2025-26
Government data show the target was achieved and installed capacity reached approximately 2,000.0 crore litres in 2026
This sustains a large downstream market for distillery, evaporation, wastewater and energy-integration solutions, although policy support does not guarantee individual customer solvency or project profitability
Ethanol capacity and financing support: The Department of Food and Public Distribution has operated interest-subvention schemes for sugar- and grain-based ethanol capacity, generally providing support at 6.0% per annum or 50.0% of bank interest under applicable schemes
Such support can improve project financeability, but eligibility, commissioning deadlines, feedstock availability and OMC offtake must be assessed project by project
Water reuse and industrial pollution control: The National Framework for Safe Reuse of Treated Waste Water encourages industrial reuse and state-level market models
CPCB charters for sugar, distillery, textile, pulp and paper and tannery focus on process upgrades, effluent-treatment augmentation and reuse
The demand linkage is strongest where discharge norms, freshwater constraints and plant economics are all binding
- Overview
- Business
- Financial Highlights
- Industry Overview
- Documentation
Get the Preqt App and keep in touch around the clock!
 Monitor your investments in real-time.
- Receive tailored deal suggestions.
- Get real-time updates and alerts.
