

Steamhouse India
Steaming Industrial ProgressCentralized Community Steam Infrastructure
IPO Summary (PreQt)
Steamhouse India Limited is a centralized industrial utility provider that generates and distributes steam and nitrogen through dedicated pipeline networks, with the community-boiler model at the core of its operations. As of July 31, 2026, the Company had 345 TPH of steam-generation capacity and 60.2 km of operational pipelines; it served 202 customers in FY26. FY26 revenue from operations was INR 491.5 Cr, EBITDA was INR 83.5 Cr and PAT was INR 38.6 Cr. Revenue grew 24.4%, although EBITDA margin moderated to 17.0% as coal trading and lower-margin purchased-steam operations increased in the mix. The IPO comprises a fresh issue of INR 353.0 Cr and an OFS of INR 61.0 Cr at the upper price band.
IPO Review Rating
Above Avg
MainboardBuilding Sustainable Industrial Utilities Through Innovative Steam Infrastructure
The Company has delivered 29.8% Revenue CAGR, 22.4% ROE, positive operating cash flow substantially above PAT, a growing customer base and a differentiated community-boiler infrastructure model. The Fresh Issue is also being put to sensible use: more than half toward debt reduction and another meaningful portion toward capacity expansion. The main operating weakness is margin compression. Revenue has grown rapidly, but EBITDA Margin has fallen from 23.5% to 17.0%, while PAT Margin has fallen from 9.3% to 7.8%. The Company is also still fairly leveraged at 1.6x Net Debt/Equity before the IPO.
The governance picture is more mixed. An independent Board and clean promoter litigation history are positives, but large related-party transactions and the fact that 76% of Company equity had until very recently been pledged against financing arrangements are material points to monitor. The planned INR 180.0 Cr debt repayment materially reduces the latter concern. On valuation, INR 81 is not cheap in absolute terms. The economically conservative post-issue P/E is approximately 57.9x. It trades below the RHP's average listed-peer P/E of 71.0x, but that average is distorted upward by Linde India's 99.2x valuation. Compared specifically with Ellenbarrie's 42.7x, Steamhouse is at a material premium.
PARAMETER
WEIGHT
SCORE
KEY FACTORS
Financial Performance
40.0%
4.0/5
Steamhouse scores well because it combines ~30% Revenue CAGR, >20% ROE and very strong operating cash conversion. The deductions are mainly for declining margins and relatively high leverage. The IPO's proposed debt repayment is therefore particularly relevant
Show more
Detailed Analysis
Revenue increased from INR 291.7 Cr in FY24 to INR 395.1 Cr in FY25 and INR 491.5 Cr in FY26, a 29.8% CAGR
FY26 EBITDA of INR 83.5 Cr with margin of 17.0%, down from 23.5% in FY24
FY26 Net Debt/Equity remained relatively high at 1.6x, though improved from 1.8x in FY24
FY26 ROE was a strong 22.4%
Positive OCF of INR 100.5 Cr in FY26, INR 107.1 Cr in FY25 and INR 21.0 Cr in FY24
Industry
15.0%
3.0/5
This is a good structural industry story, particularly because centralized steam allows customers to avoid boiler capex, compliance and maintenance. The limitation is that actual steam demand itself grows at roughly 9–10%, rather than at the Company's ~30% historical Revenue CAGR. Continued outperformance therefore depends on Steamhouse gaining new industrial clusters
Show more
Detailed Analysis
India's process-steam demand is projected to grow at 9.4% CAGR from FY26 to FY31
Community boiler / Steam-as-a-Service is an emerging growth model within the mature industrial-steam market
Environmental, boiler, emissions and safety compliance are meaningful, although policy is also supportive of centralized/common boilers
Management
15.0%
3.0/5
The Board comprises six Directors, including three Independent Directors, and the Company states that its Board and committees comply with applicable corporate-governance requirements. Vishal Budhia has been associated with the Company since incorporation and has more than 30 years of management experience; the RHP also identifies 11 years of specialised experience in community boilers
Show more
Detailed Analysis
Vishal Budhia has over 30 years of management experience and 11 years of specialised community-boiler experience
3 of 6 Directors are Independent, including one woman Independent Director
No promoter litigation and no current pledge, but 76.0% of Company equity had recently been pledged and may require re-pledging if specified debt is not repaid
Material transactions with Sanjoo Group entities, including the Company's largest customer and significant inter-company loans
Only 14.7% of the issue is OFS; promoter holding remains approximately 77.3% post issue assuming full allotment
Valuation
20.0%
4.0/5
At the upper price band of INR 81.0, Steamhouse is valued at approximately 57.9x FY26 post-issue earnings, compared with the RHP peer average of 71.0x. While this represents a discount to the peer average, the valuation is still above Ellenbarrie Industrial Gases at 42.7x, indicating that the IPO is reasonably valued relative to peers but not inexpensive on an absolute basis
Show more
Detailed Analysis
Post-issue FY26 P/E 57.9x vs RHP peer average 71.0x, ~18% discount
Indicative post-offer EV/EBITDA approximately 25.2x, substantially below listed industrial-gas peers
Historical FY26 P/B is much higher at 11.2x
FY26 Return on Net Worth was 23.6%
Merchant Banker Track Record
10.0%
5.0/5
The IPO is managed by Equirus Capital Limited, an established merchant banker with a generally strong recent IPO record. Of the latest 10 issues disclosed in the RHP, 8 listed above their issue price, with an average opening gain of approximately 23.6%, although post-listing performance across issues has been mixed
Show more
Detailed Analysis
Last 10 RHP-disclosed IPOs produced approximately 23.6% average opening return
Recent 2026 Equirus IPOs show mixed but overall healthy demand; latest five average roughly 40x
8 of the latest 10 disclosed issues opened above issue price; one flat and one below
Established institutional investment-bank/merchant-banker franchise
TOTAL
100%
3.8/5
Weighted Composite Score
Issue Price
₹335.0 to ₹353.0
As of 9 Sep 2026
GMP
₹18.0
As of 9 Sep 2026
Estimated Gain / Loss
+22.2%
Lot Size
185.0 Shares
Grey Market Premium (GMPs) are shared for knowledge purpose only. PrEqt doesn’t promote or execute the trades.
| Issue size | |
|---|---|
| Overall | ₹414.0 Cr |
| Fresh Issue | ₹353.0 Cr |
| Offer for Sale | ₹61.0 Cr |
Minimum Investment
₹14,985.0 / 34,225 shares

Merchant Banker
Equirus Capital Ltd;
IPO Document
RHP / Anchor Document
Offer Start Date
9th Sept 2026
Offer End Date
11th Sept 2026
Valuation
₹2,238.9 Cr
Revenue (FY'26)
₹495.0 Cr
PAT (FY'26)
₹38.6 Cr
Issue Size
₹414.0 Cr
Face Value
₹ 2.0Offer Price
₹ 353.0Lot Size
185.0 sharesSale Type
Fresh capital cum OFSPAT (FY'26)
₹ 38.6 CrPAT Margin (FY'26)
7.8 %P/E Multiple
57.9xEBITDA (FY'26)
₹ 83.5 CrCAGR Growth 3Y
29.9 %ROE (FY'26)
22.4 %ROCE (FY'26)
16.1 %Price to Book Value
11.2xDebt/Equity
1.6xCompany Website
steamhouse.inExplore new deals
Overview
Fund Allocation
Total: ₹0 CrSource:Company DRHP
Timeline
IPO Open Date
To Be Announced
IPO Close Date
To Be Announced
Tentative Allotment
To Be Announced
Initiation of Refunds
To Be Announced
Credit of Shares to Demat
To Be Announced
Tentative Listing Date
To Be Announced
Business
Business Model
Geographical Presence
Sales Channel
Clients
Key Risk Factor
Financial Highlights
Income Statement
Revenue growth with EBITDA and PAT margins
| Financial Metric | FY 2024 | FY 2025 | FY 2026 |
|---|---|---|---|
| Revenue (₹ Cr) | 293.2 | 398.5 | 495.0 |
| Growth (%) | - | 35.4% | 24.4% |
| EBITDA (₹ Cr) | 68.4 | 69.3 | 83.5 |
| EBITDA Margin (%) | 23.3% | 17.4% | 16.9% |
| PAT (₹ Cr) | 27.2 | 31.2 | 38.6 |
| PAT Margin (%) | 9.3% | 7.8% | 7.8% |
OBSERVATIONS & INSIGHTS
Revenue increased from INR 291.7 Cr in FY24 to INR 395.1 Cr in FY25 and INR 491.5 Cr in FY26. FY25 growth reflected the shift to purchased-steam distribution and coal sales after the Sachin operating-model change; FY26 growth was driven by 8.2% higher steam sales, 73.6% higher coal sales and new AMC waste-to-steam service revenue
EBITDA rose only 1.3% in FY25 despite 35.4% revenue growth because lower-margin purchased steam and coal trading increased sharply; EBITDA then grew 20.4% in FY26 as the larger operating base and Panoli ramp-up added absolute earnings
EBITDA margin compressed from 23.5% in FY24 to 17.5% in FY25 and 17.0% in FY26 because the revenue mix shifted away from owned steam generation toward coal trading and purchased-steam operations with higher cost-of-goods intensity
PAT increased from INR 27.2 Cr in FY24 to INR 31.2 Cr in FY25 and INR 38.6 Cr in FY26. FY26 PBT growth of 31.5% supported earnings, partly offset by a 61.4% increase in tax expense, including higher deferred tax from the expanded fixed-asset base
Balance Sheet
| Financial Metric | FY 2024 | FY 2025 | FY 2026 |
|---|---|---|---|
| Net Worth | ₹ 102.7 Cr | ₹ 131.0 Cr | ₹ 163.8 Cr |
| Total Assets | ₹ 422.3 Cr | ₹ 543.7 Cr | ₹ 679.5 Cr |
| Total Borrowing | ₹ 202.7 Cr | ₹ 223.0 Cr | ₹ 281.6 Cr |
| Reserves & Surplus | ₹ 58.4 Cr | ₹ 87.3 Cr | ₹ 127.6 Cr |
OBSERVATIONS & INSIGHTS
Total assets increased 24.9% in FY26, driven primarily by Panoli commissioning, additional pipelines and higher CWIP for ongoing expansion projects
Total equity increased to INR 172.8 Cr, primarily through retained earnings, which rose to INR 108.9 Cr as cumulative profits were retained in the business
Borrowings shifted toward the current bucket: current borrowings rose to INR 182.5 Cr while non-current borrowings remained around INR 99.1 Cr, reflecting funding of working capital and the expansion cycle
Cash Flow
| Financial Metric | FY 2024 | FY 2025 | FY 2026 |
|---|---|---|---|
CFO in Cr Cash generated from core business operations. | +21.0 Cr | +107.1 Cr | +100.5 Cr |
CFI in Cr Cash used in / generated from investing activities. | -125.9 Cr | -123.0 Cr | -144.6 Cr |
CFF in Cr Cash from / used in financing activities. | +103.7 Cr | +12.3 Cr | +48.0 Cr |
Working Capital
| Efficiency Metric | FY 2023 | FY 2024 | FY 2025 |
|---|---|---|---|
Debtor Days Average number of days taken to collect customer payments. | - | - | - |
Creditor Days Average time taken to pay suppliers and vendors. | - | - | - |
Inventory Days Average number of days inventory remains unsold. | - | - | - |
CCC (Cash Conversion Cycle) (Debtor Days + Inventory Days - Creditor Days) | - | - | - |
Financial Ratios
Measures the company’s leverage relative to shareholder equity.
OBSERVATIONS & INSIGHTS
Current ratio declined to 0.36x as current liabilities - particularly supplier payables and working-capital borrowings - expanded faster than current assets
Net debt/equity improved from 1.77x in FY24 to 1.57x in FY26 as retained earnings and total equity grew faster than net debt; leverage nevertheless remains material, making the IPO debt-repayment object strategically relevant
ROE moderated from 26.3% to 22.4% because equity accumulated faster than PAT, even though absolute earnings increased
ROCE declined to 16.1% as capital employed expanded with new plants, pipelines and borrowings ahead of full utilisation / mature earnings from those assets
ROA fell to 6.3% because Panoli, pipeline additions and CWIP expanded the asset base faster than PAT growth
Interest coverage recovered to 3.4x in FY26 as PBT increased and finance cost eased slightly, after weakening to 2.8x in FY25
Industry Overview
Industry Drivers
Expansion in Steam-Intensive Manufacturing
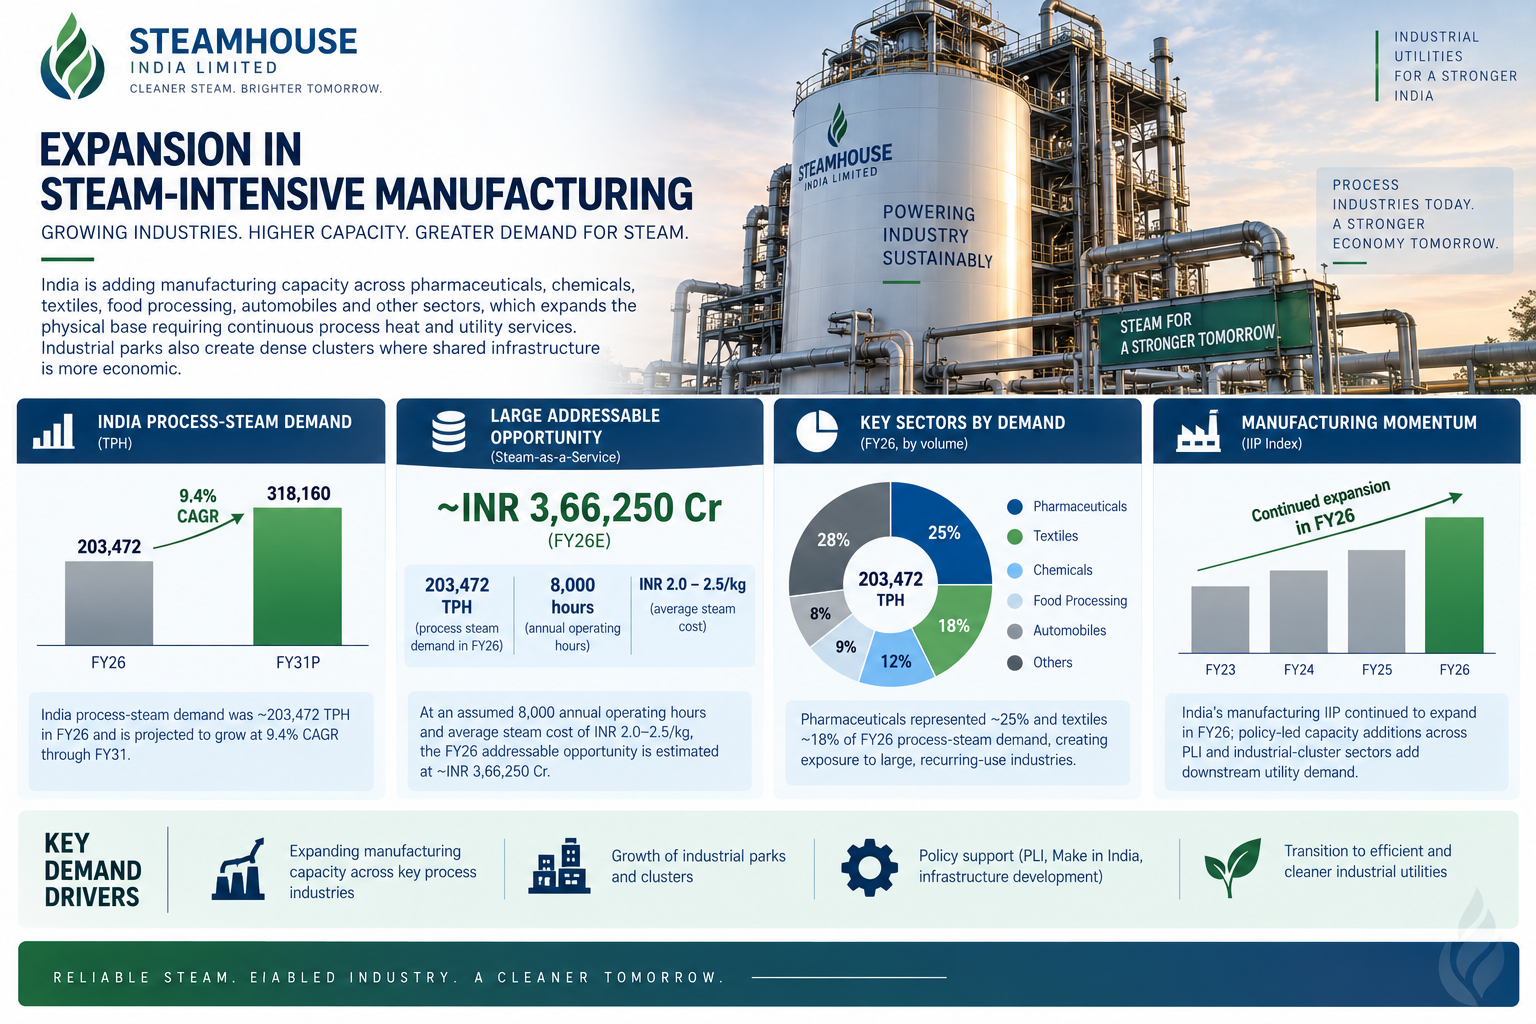
Demand for industrial steam is ultimately tied to production activity in process industries. India is adding manufacturing capacity across pharmaceuticals, chemicals, textiles, food processing, automobiles and other sectors, which expands the physical base requiring continuous process heat and utility services. Industrial parks also create dense clusters where shared infrastructure is more economic
India process-steam demand was approximately 203,472 TPH in FY26 and is projected to grow at 9.4% CAGR through FY31
At an assumed 8,000 annual operating hours and average steam cost of INR 2.0-2.5/kg, the FY26 Steam-as-a-Service addressable opportunity is estimated at approximately INR 3,66,250 Cr
Pharmaceuticals represented about 25% and textiles about 18% of FY26 process-steam demand by volume, creating exposure to large recurring-use industries
India manufacturing IIP continued to expand in FY26; policy-led capacity additions across PLI and industrial-cluster sectors add downstream utility demand
Captive-to-Community Boiler Economics
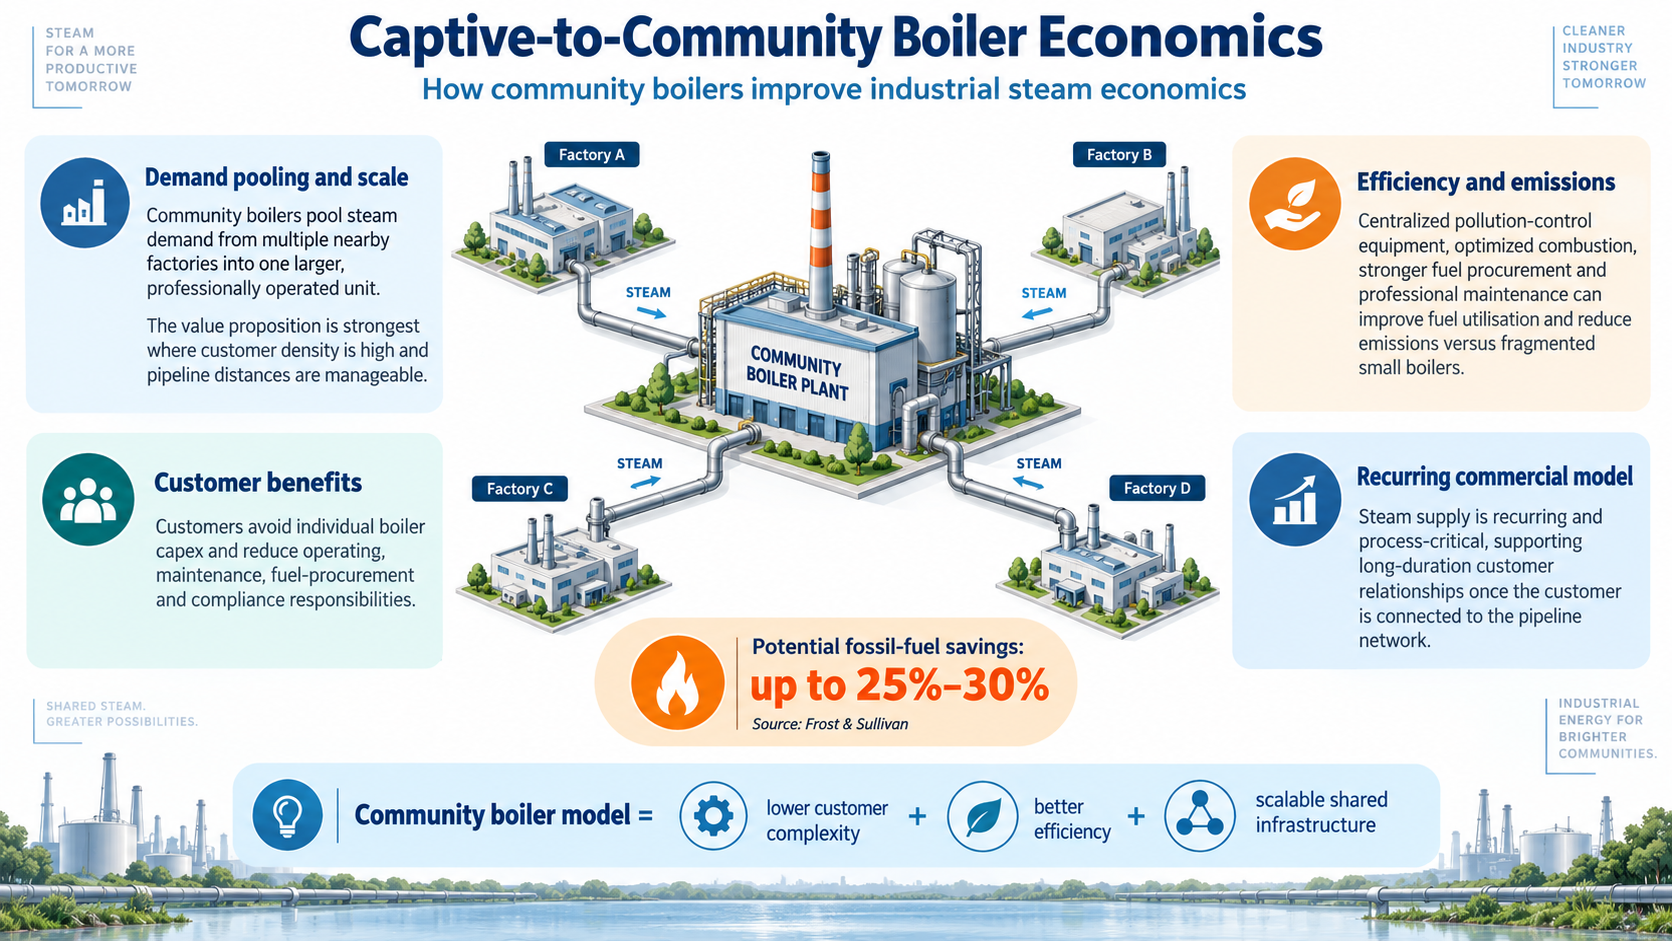
Community boilers pool steam demand from multiple nearby factories into a larger, professionally operated unit. The customer can avoid boiler capex and day-to-day operating complexity, while the service provider can improve combustion efficiency, pollution-control economics, fuel procurement and maintenance through scale. The value proposition strengthens where customer density is high and pipeline distances are manageable
Frost & Sullivan estimates potential fossil-fuel savings of up to 25%-30% when captive boilers are replaced by community boilers
Customers can avoid investment in individual boilers and reduce operating, maintenance, fuel-procurement and compliance responsibilities
Centralized pollution-control equipment and optimized combustion can reduce emissions and improve fuel utilisation versus fragmented small boilers
Steam supply is recurring and process-critical, supporting long-duration commercial relationships once the customer is connected to the pipeline network
Industrial Clusters and Pipeline-Network Economics
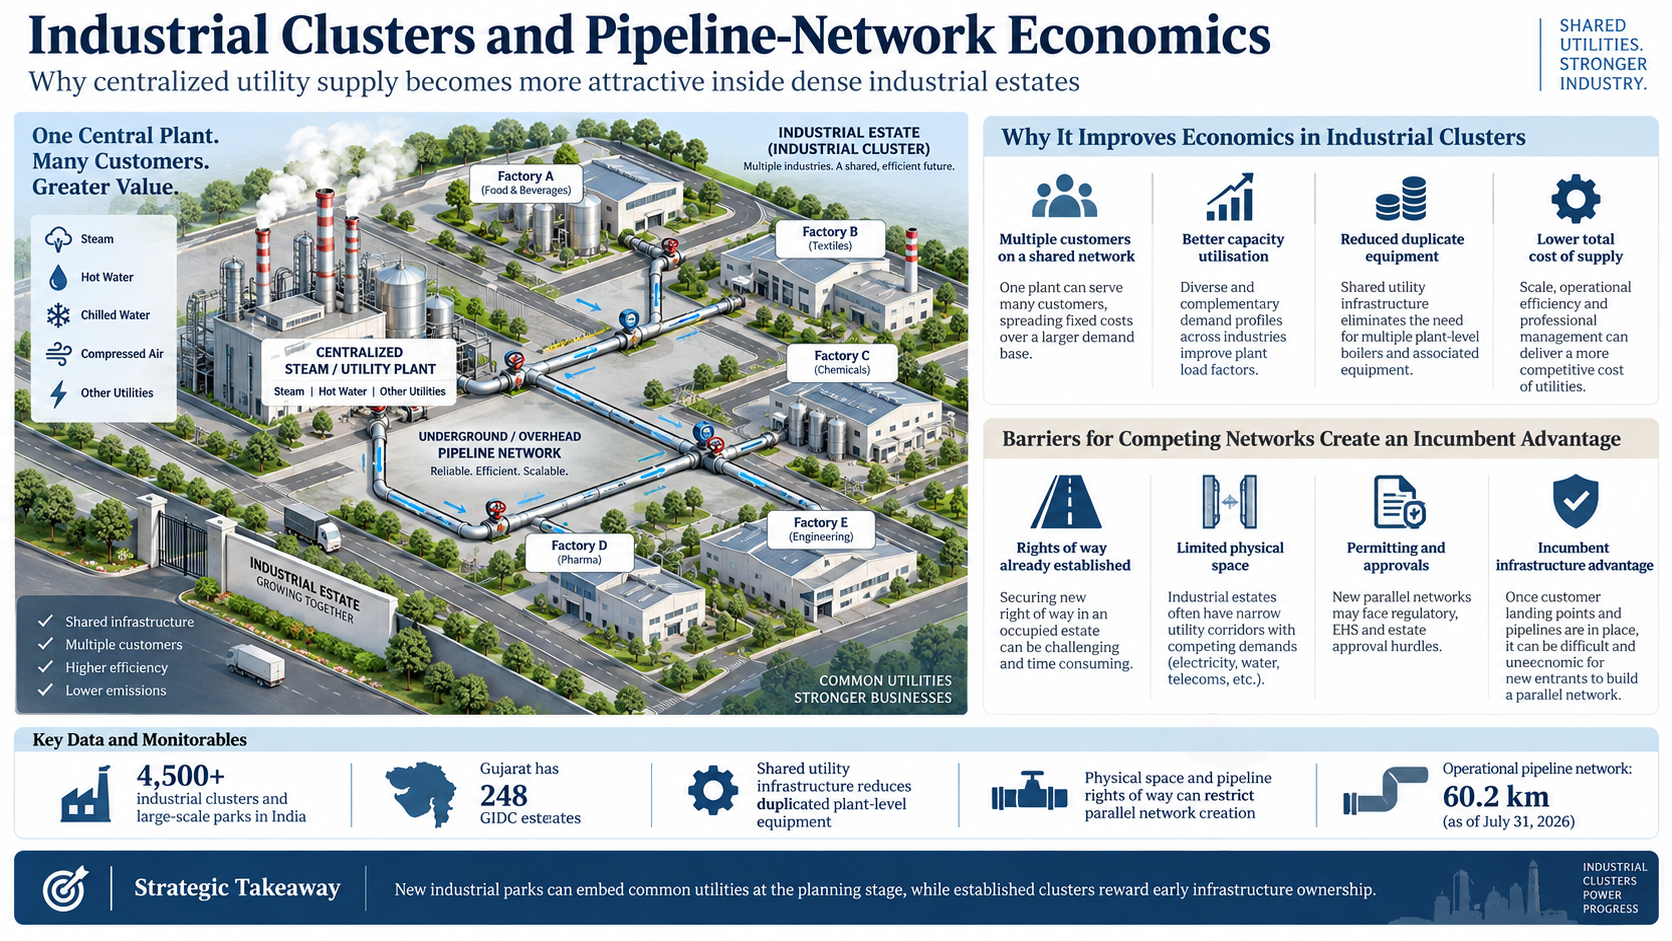
The economics of centralized utility supply improve sharply inside industrial estates because multiple customers can be reached from a common plant through a finite pipeline network. Once rights of way, customer landing points and pipelines are established, physical space and permitting constraints can raise barriers for competing networks. New industrial parks can therefore embed common utilities at the planning stage rather than retrofit them later
India has more than 4,500 industrial clusters and large-scale parks; Gujarat alone has 248 GIDC estates
Pipeline rights of way and limited physical space in established clusters can restrict parallel network creation and support incumbent infrastructure positions
Shared utility infrastructure reduces duplicated plant-level equipment and can improve capacity utilisation where customers have complementary demand profiles
Steamhouse had 60.2 km of operational pipelines by July 31, 2026, illustrating the infrastructure intensity required to build a cluster utility network
Risks in the Industry
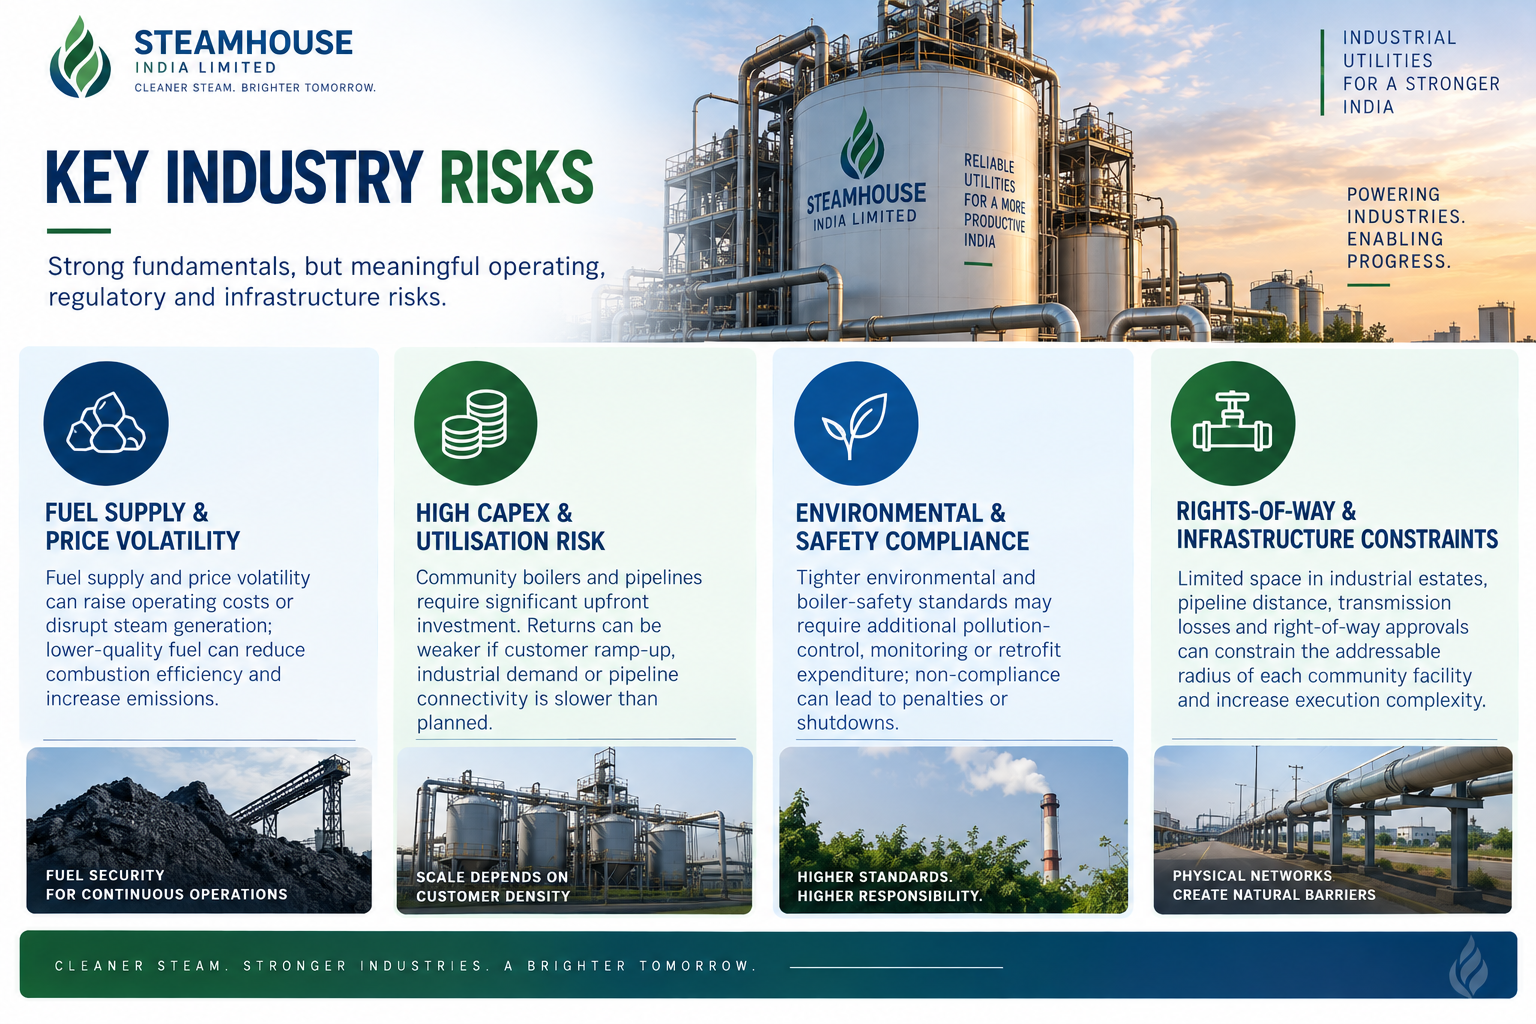
Community-boiler economics depend on safe continuous operation, reliable fuel supply, regulatory compliance and adequate customer density around each asset. The model requires meaningful upfront capex in boilers and pipelines, while fuel price volatility or under-utilisation can weaken returns. Because steam is process-critical, outages, water-treatment failures or pressure-control issues can also create customer and safety consequences
Fuel supply and price volatility can raise operating costs or disrupt steam generation; lower-quality fuel can reduce combustion efficiency and increase emissions
High fixed capex and maintenance requirements create utilisation risk when customer ramp-up, industrial demand or pipeline connectivity is slower than planned
Tighter environmental and boiler-safety standards may require additional pollution-control, monitoring or retrofit expenditure; non-compliance can lead to penalties or shutdowns
Rights-of-way, limited space in industrial estates, pipeline distance and transmission losses constrain the addressable radius of each community facility
Fundraise/Future Plans
Shareholding
Pre-issue shareholding
Promoter Holding 0.0%
Post-Issue Shareholding
Promoter Holding 0.0%
Category
Pre-Issue%Post-Issue%
Promoters
Vishal Sanwarprasad Budhia
87.0%70.5%
VSB Business Trust
3.4%2.9%
Budhia Business Trust
2.7%2.3%
VB Business Trust
1.8%1.5%
Total Promoter Holding
94.9%77.2%
Additional Shareholders
0.0%0.0%
Total Additional Holding
0.0%0.0%
Total Shareholding
94.9%77.2%
- Overview
- Business
- Financial Highlights
- Industry Overview
- Fundraise/Future Plans
- Documentation
Get the Preqt App and keep in touch around the clock!
 Monitor your investments in real-time.
- Receive tailored deal suggestions.
- Get real-time updates and alerts.
