

Sterlite Electric Ltd.
Powering Grid TransformationEngineering Energy Networks
IPO Review and Rating
Watchlist
DRHP filedOverall Recommendation
Sterlite Electric has improved materially after the infrastructure demerger. FY26 revenue increased 26.2% to INR 6,253.6 Cr, PAT recovered to INR 237.2 Cr, the order book exceeded INR 8,000.0 Cr, and the balance sheet is now particularly strong with INR 1,401.7 Cr of cash against only INR 609.1 Cr of borrowings. The multi-year Indian transmission and distribution capex cycle provides a strong structural demand backdrop. EBITDA margin has declined from 10.3% in FY24 to 9.5% in FY25 and 7.8% in FY26. CRISIL has specifically highlighted aluminium-premium volatility and delays in higher-margin orders, while the Vadodara cable facility has also faced commissioning delays. This means the investment thesis cannot rest only on revenue/order-book growth; margin recovery is essential
PARAMETER
WEIGHT
SCORE
KEY FACTORS
Financial Performance
25.0%
3.0/5
The balance sheet has undergone a major structural improvement. Borrowings have reduced dramatically from FY23 levels, equity has strengthened to nearly INR 2,000.0 Cr, and FY26 cash of INR 1,401.7 Cr is more than twice reported borrowings
Show more
Detailed Analysis
Revenue increased from INR 4,917.9 Cr in FY24 to INR 6,253.6 Cr in FY26, implying a two-year CAGR of 12.8%. Importantly, FY26 revenue growth accelerated sharply to 26.2% YoY after only 0.8% growth in FY25
FY26 EBITDA was INR 490.6 Cr, translating into a margin of 7.8%. Margin has consistently compressed from 10.3% in FY24 and 9.5% in FY25 despite revenue growth
FY26 PAT increased to INR 237.2 Cr, but PAT margin remained modest at 3.8%
Borrowings were INR 609.1 Cr against equity of INR 1,991.9 Cr, giving D/E of only 0.3x. Cash equivalents of INR 1,401.7 Cr also exceed reported borrowings, leaving the Company in a strong net-cash position
FY26 ROE stood at approximately 11.9%
CFO remained positive in both latest years at INR 646.6 Cr in FY25 and INR 359.1 Cr in FY26, a major improvement from negative CFO in FY23 and FY24
Industry
25.0%
3.0/5
The structural demand opportunity is strong. Electrification, renewable-energy evacuation, grid strengthening and increasing high-voltage requirements should sustain demand for cables and conductors for several years
Show more
Detailed Analysis
India's wires and cables market is projected to grow at 11.0-13.0% CAGR between FY25 and FY30, from approximately INR 195,100.0 Cr to INR 335,000.0-355,000.0 Cr
Power T&D is in a structural investment cycle driven by grid modernisation, renewable-energy evacuation, electrification, data centres and rising electricity demand
Competition is substantial across APAR, KEI, KEC, Kalpataru, Universal Cables, Bajel and other domestic/global players. Tendering and commodity-linked product economics restrict pricing power
Regulation is moderate rather than extreme. Product standards, utility qualification, environmental approvals, tender conditions and international trade requirements can affect execution
Sterlite has supplied products to 70.0+ countries, but FY26 export contribution declined to approximately 8.0% from materially higher levels in FY25
Management
25.0%
4.0/5
The underlying management and governance structure is strong: experienced promoters, 50.0% independent Board representation, clean FY25 audit reports and a relatively balanced IPO structure
Show more
Detailed Analysis
Sterlite belongs to the Vedanta promoter ecosystem. Chairman Pravin Agarwal has 30.0+ years of experience, while MD Pratik Agarwal has 15.0+ years of experience
The current Board comprises 8.0 directors, including 4.0 Independent Directors, translating into 50.0% independence
The operating-company audit position is clean, but the IPO has gone through an extended SEBI clarification/addendum process. This creates disclosure/execution risk, although it should not be interpreted as a finding of wrongdoing
RPTs are meaningful because of the wider group structure, but FY25 disclosures state that all contracts and arrangements were in the ordinary course and at arm's length
Valuation Metrics
25.0%
3.6/5
The valuation is reasonable but not outright cheap on P/E. At 32.2x, Sterlite still requires meaningful earnings growth to justify the current unlisted price, particularly because FY26 EBITDA margin is only 7.8%
Show more
Detailed Analysis
Sterlite trades at roughly 32.2x P/E versus approximately 37.0x average for the selected peer set, implying a 13.0% discount
Estimated EV is approximately INR 5,961.4 Cr, producing FY26 EV/EBITDA of approximately 12.2x versus about 22.2x average for the peer set, a substantial discount
FY26 book value is approximately INR 141.0/share, resulting in P/B of approximately 3.4x
TOTAL
100%
3.4/5
Weighted Composite Score
Per Share Price
₹489.3
As of 10 Sep 2026
Lot Size
20.0 Shares
Minimum Investment
₹9,786.0 / 20 shares
Market Cap. (₹ Cr)
Revenue FY’26
PAT FY’26
P/E Multiple
Face Value
₹ 2.0Lot Size
20.0 sharesPAT FY’26
₹ 237.2 CrPAT Margin (%)
3.8 %P/E Multiple
37.2xCAGR Growth 2Y
12.8 %ROE (FY’26)
11.9 %ROCE (FY’26)
13.0 %Price to Book Value ratio
3.4xDebt/Equity (FY’26)
0.3xMerchant banker appointed
✅ YesCompany Website
www.sterliteelectric.comDisclaimer: Unlisted shares are unregulated & illiquid. This is NOT investment advice. Please do your own due diligence before investing.
Minimum Investment
₹9,786.0 / 20 sharesShares Lot 20 X 1
Investment amount
₹9,786.0
Overview
Business
Products
Business Model
Geographical Presence
Sales Channel
Financial Highlights
Income Statement
Revenue growth with EBITDA and PAT margins
| Financial Metric | FY 2024 | FY 2025 | FY 2026 |
|---|---|---|---|
| Revenue (₹ Cr) | 4,905.6 | 4,924.4 | 6,253.6 |
| Growth (%) | 50.2% | 0.8% | 2.2% |
| EBITDA (₹ Cr) | 456.0 | 421.4 | 490.6 |
| EBITDA Margin (%) | 10.0% | 9.4% | 7.8% |
| PAT (₹ Cr) | 295.0 | 315.5 | 237.2 |
| PAT Margin (%) | 6.0% | 6.4% | 3.8% |
OBSERVATIONS & INSIGHTS
Standalone revenue increased 25.1% to INR 6,253.6 Cr after being broadly flat in FY25. The FY24-FY26 revenue CAGR was approximately 12.1%, showing that the post-demerger products-and-solutions platform has retained strong demand momentum
EBITDA declined from INR 456.0 Cr in FY24 to INR 421.4 Cr in FY25 and INR 490.6 Cr in FY26, taking margin from 10.0% to 7.8%. Commodity-linked input premiums, revenue mix and the cost of scaling the operating platform are therefore the central profitability issues
PAT rose to INR 237.2 Cr from FY24's INR 217.8 Cr. Lower finance cost and tax supported the bottom line, while declining EBIT limited the benefit of the 25.1% revenue growth
Balance Sheet
| Financial Metric | FY 2024 | FY 2025 | FY 2026 |
|---|---|---|---|
| EQUITY & LIABILITIES | ₹ 6,868.1 Cr | ₹ 3,994.8 Cr | ₹ 5,679.5 Cr |
| Net Worth | ₹ 2,086.5 Cr | ₹ 1,741.8 Cr | ₹ 2,290.9 Cr |
| Share Capital | ₹ 24.5 Cr | ₹ 25.2 Cr | ₹ 25.2 Cr |
| Reserves & Surplus | ₹ 2,062.0 Cr | ₹ 1,716.6 Cr | ₹ 2,265.7 Cr |
| Total Liabilities | ₹ 4,781.6 Cr | ₹ 2,253.0 Cr | ₹ 3,388.6 Cr |
| Current Liabilities | ₹ 4,672.1 Cr | ₹ 2,113.6 Cr | ₹ 2,979.0 Cr |
| Borrowings | ₹ 670.5 Cr | ₹ 195.7 Cr | ₹ 442.7 Cr |
| Trade Payables | ₹ 389.9 Cr | ₹ 493.9 Cr | ₹ 542.0 Cr |
| Other Current Liabilities | ₹ 3,611.7 Cr | ₹ 1,424.0 Cr | ₹ 1,994.3 Cr |
| Non-Current Liabilities | ₹ 109.5 Cr | ₹ 139.4 Cr | ₹ 409.6 Cr |
| Borrowings | ₹ 43.0 Cr | ₹ 124.5 Cr | ₹ 209.4 Cr |
| Other Non-Current Liabilities | ₹ 66.5 Cr | ₹ 14.9 Cr | ₹ 200.2 Cr |
| ASSETS | ₹ 6,868.2 Cr | ₹ 3,994.8 Cr | ₹ 5,679.4 Cr |
| Current Assets | ₹ 5,929.0 Cr | ₹ 3,008.7 Cr | ₹ 4,371.2 Cr |
| Trade Receivables | ₹ 1,200.7 Cr | ₹ 1,090.7 Cr | ₹ 1,258.4 Cr |
| Inventory | ₹ 468.3 Cr | ₹ 366.6 Cr | ₹ 551.7 Cr |
| Cash & Cash Equivalents | ₹ 54.2 Cr | ₹ 331.3 Cr | ₹ 265.0 Cr |
| Other Current Assets | ₹ 4,205.8 Cr | ₹ 1,220.1 Cr | ₹ 2,296.1 Cr |
| Non-Current Assets | ₹ 939.2 Cr | ₹ 986.1 Cr | ₹ 1,308.2 Cr |
| Fixed Assets | ₹ 280.7 Cr | ₹ 423.2 Cr | ₹ 709.6 Cr |
| Other Non-Current Assets | ₹ 658.5 Cr | ₹ 562.9 Cr | ₹ 598.6 Cr |
OBSERVATIONS & INSIGHTS
Assets classified as held for sale of INR 3,357.2 Cr and related liabilities of INR 2,101.0 Cr were present in FY24 and were removed from the FY25 continuing-company balance sheet. The fall in total assets in FY25 is therefore structural rather than an operating contraction
Total assets increased 42.2% to INR 5,679.4 Cr, driven by working capital and investment in manufacturing. Fixed assets including CWIP, ROU assets and intangibles increased to INR 709.6 Cr from INR 423.2 Cr
Cash and cash equivalents were INR 265.0 Cr and other bank balances were INR 763.7 Cr, while conventional gross borrowings were INR 652.1 Cr. Supplier-finance acceptances of INR 1,476.3 Cr materially change the economic leverage picture and should be analysed alongside borrowings
Equity strengthened to INR 2,290.9 Cr in FY26 from INR 1,741.8 Cr, supported by retained earnings and other reserves. However, higher net worth has not yet translated into proportionate earnings, as reflected in the decline in ROE and ROCE
Cash Flow
| Financial Metric | FY 2024 | FY 2025 | FY 2026 |
|---|---|---|---|
CFO (₹ Cr) Cash generated from core business operations. | +524.1 Cr | +646.6 Cr | +359.1 Cr |
CFI (₹ Cr) Cash used for investments and long-term assets. | -892.4 Cr | -569.6 Cr | -239.6 Cr |
CFF (₹ Cr) Cash flow related to funding and borrowings. | +100.3 Cr | +134.5 Cr | +22.6 Cr |
Financial Ratios
Measures the company’s leverage relative to shareholder equity.
OBSERVATIONS & INSIGHTS
Company-reported ROE declined from 16.0% to 12.0% and ROCE from 21.0% to 13.0%. Equity, working capital and capital work-in-progress expanded faster than operating earnings, reducing the productivity of the capital base
The current ratio moved from 1.0x in FY24 to 1.4x in FY25 and 1.5x in FY26. This provides a larger short-term buffer, although a significant portion of current assets is tied up in receivables, inventory, bank deposits and contract assets rather than unrestricted cash alone
Debt/equity rose from 0.2x to 0.3x as borrowings increased for working capital and expansion. More importantly, supplier-finance acceptances of ₹1,476.3 Cr sit outside the simple debt figure and should be considered when assessing economic leverage
Coverage fell from 2.4x in FY24 to 1.8x in FY25 and recovered only to 1.9x in FY26. The business therefore has less operating cushion against margin pressure than its low headline D/E ratio might imply
Industry Overview
Industry Drivers
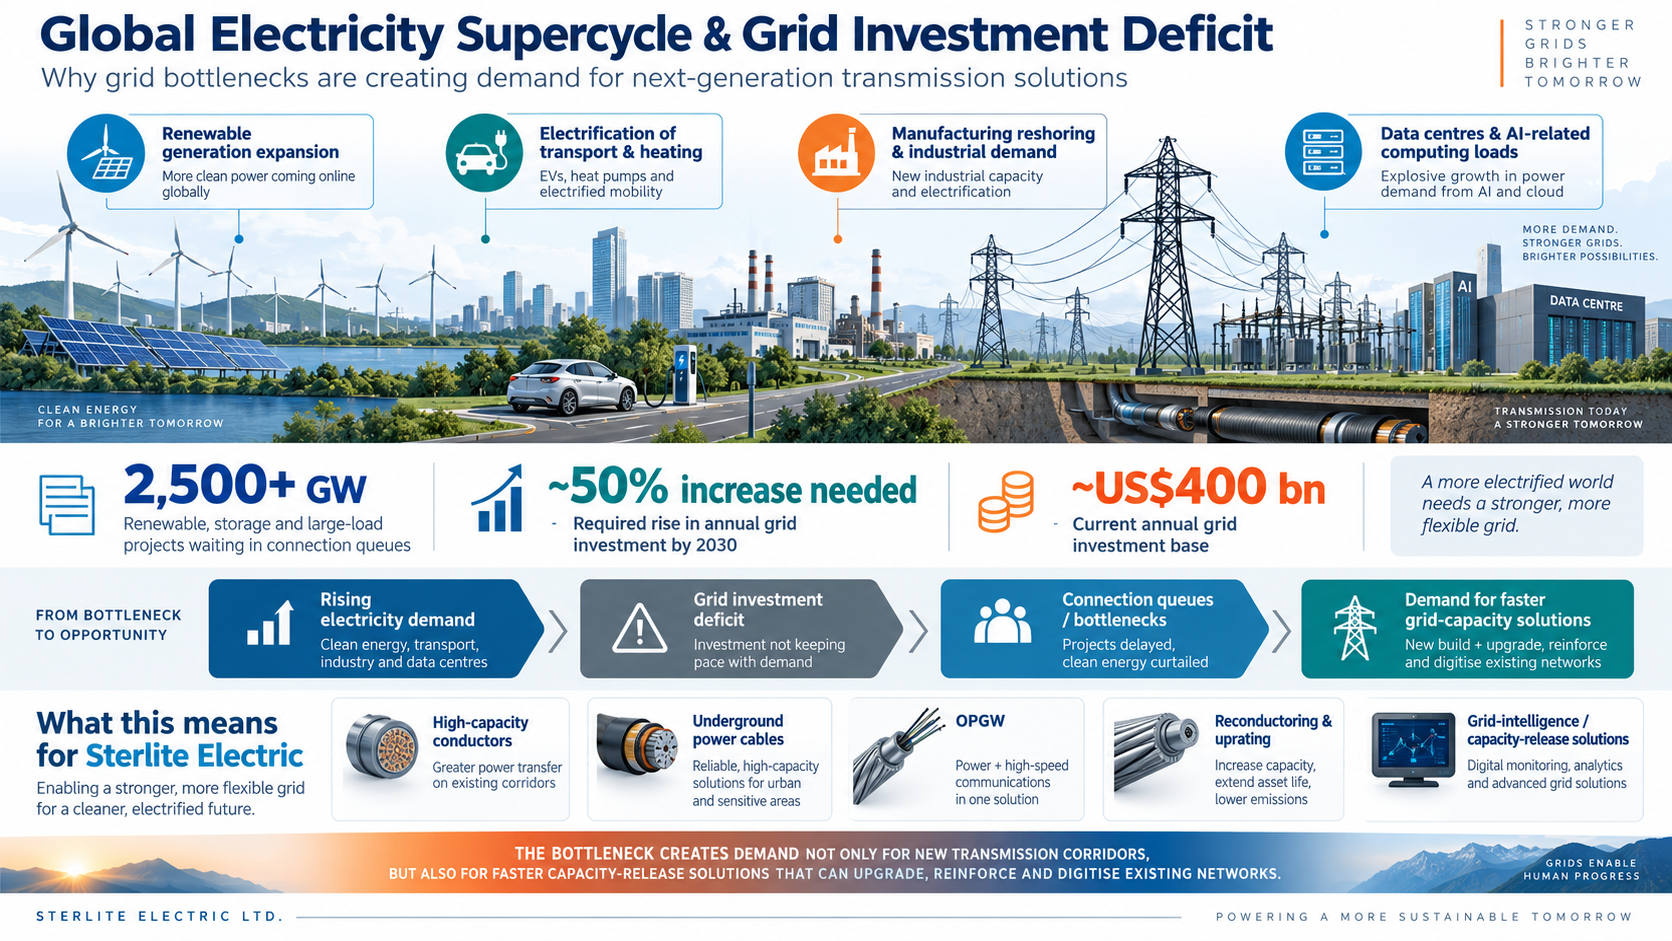
Global electricity supercycle and grid investment deficit
Electricity demand growth is broadening from traditional industrialisation into a structural global cycle driven by renewable generation, electrification of transport and heating, manufacturing reshoring, data centres and AI-related computing loads
Grid investment has not kept pace with generation and load additions
IEA Electricity 2026 estimates that more than 2,500 GW of renewable, storage and large-load projects are waiting in connection queues and that annual grid investment must increase by roughly 50% from about US$400 billion by 2030
For Sterlite, this matters because the bottleneck creates demand not only for new lines, but also for high-capacity conductors, underground power cables, OPGW, reconductoring, uprating and grid-intelligence solutions that can release capacity faster than completely new corridors
India’s transmission build-out under the National Electricity Plan
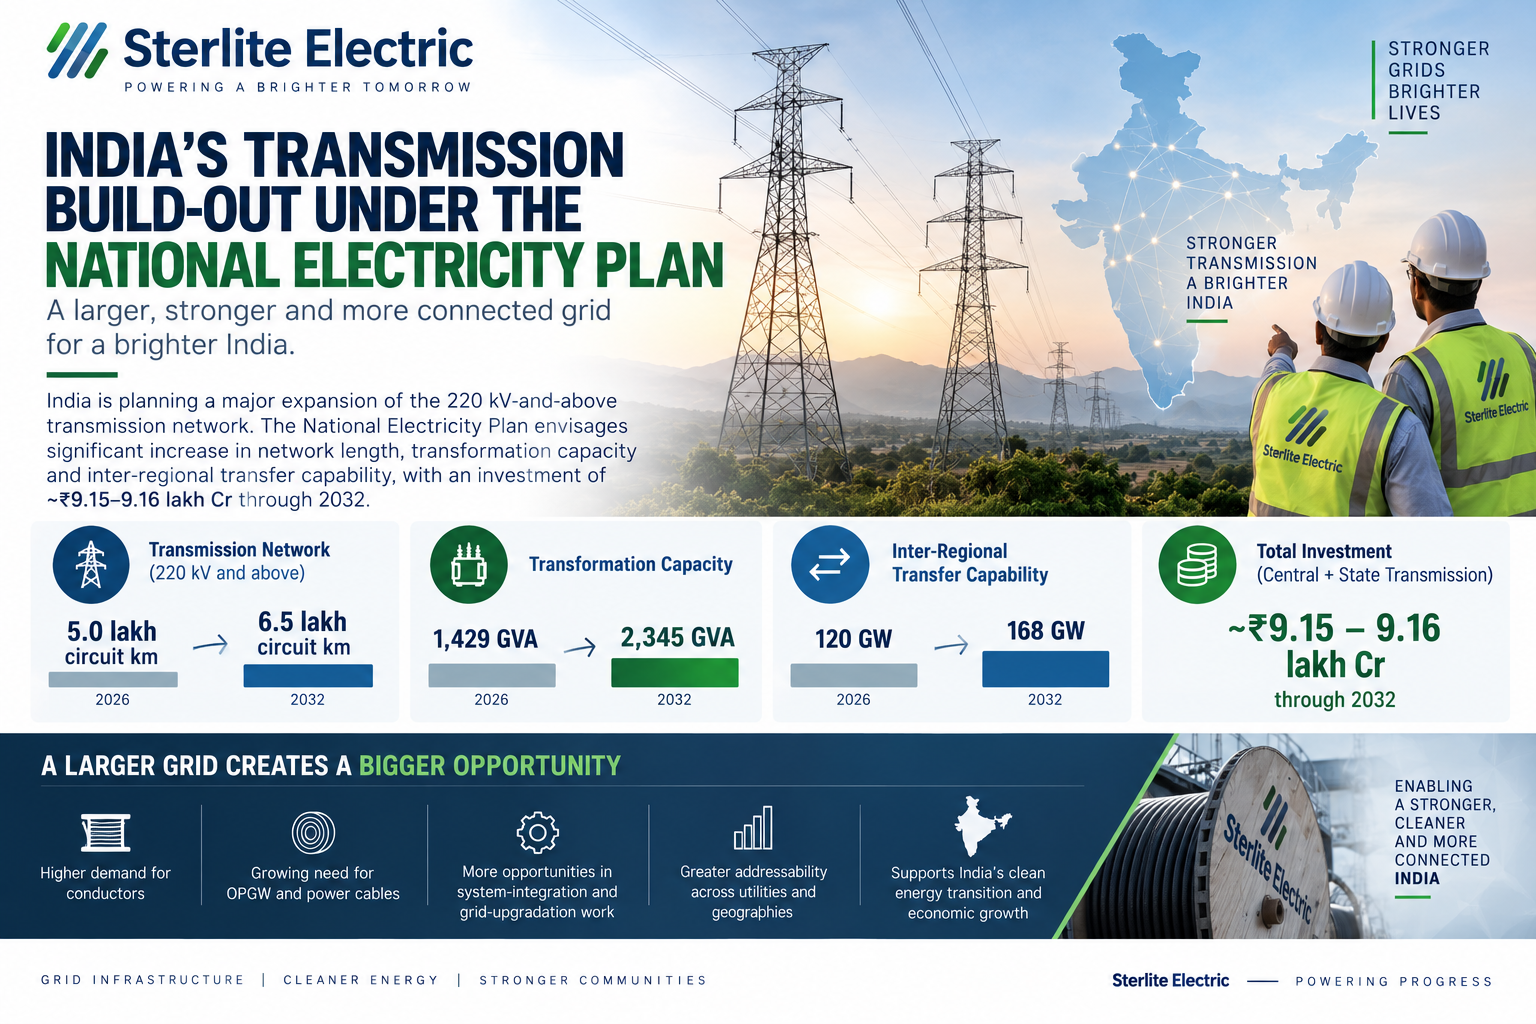
India is planning a major expansion of the 220 kV-and-above network
Ministry of Power / PIB disclosures in 2026 indicate that the transmission system is planned to expand from roughly 5.0 lakh circuit kilometres to 6.5 lakh circuit kilometres by 2032, while transformation capacity rises from about 1,429 GVA to 2,345 GVA and inter-regional transfer capability from 120 GW to 168 GW
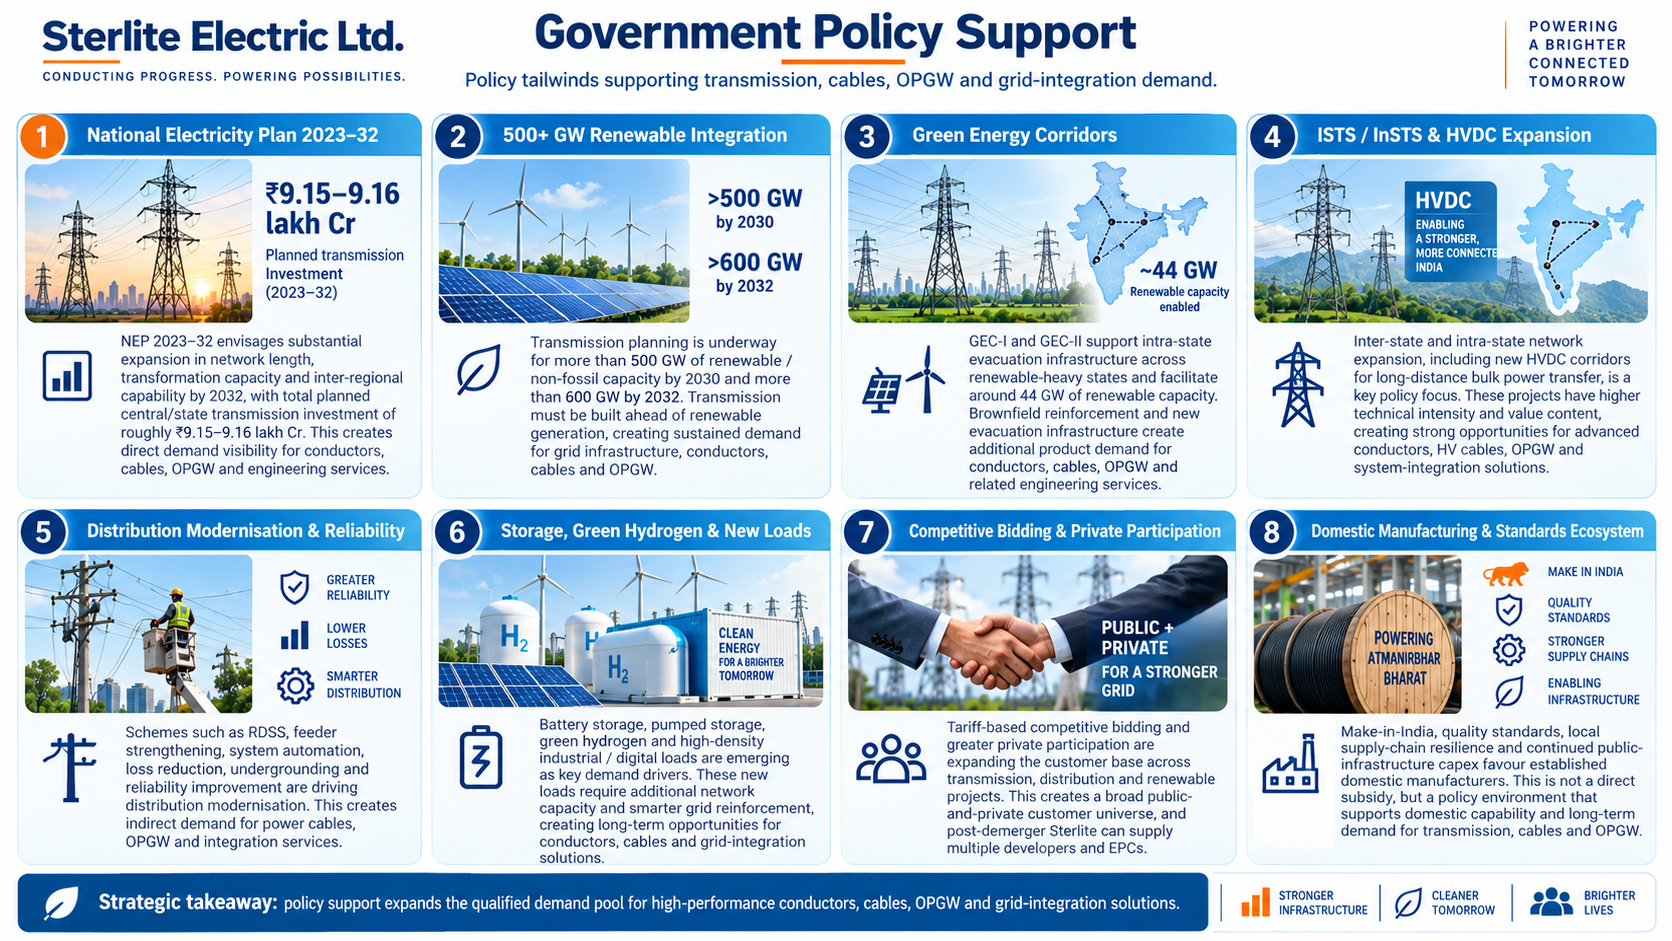
The broader National Electricity Plan carries investment of roughly ₹9.15-9.16 lakh Cr for central and state transmission systems through 2032
This directly expands the addressable pool for conductors, OPGW, cables and system-integration work and also raises the value of suppliers that can deliver across multiple voltage classes, utilities and geographies
Renewable-energy evacuation and Green Energy Corridors
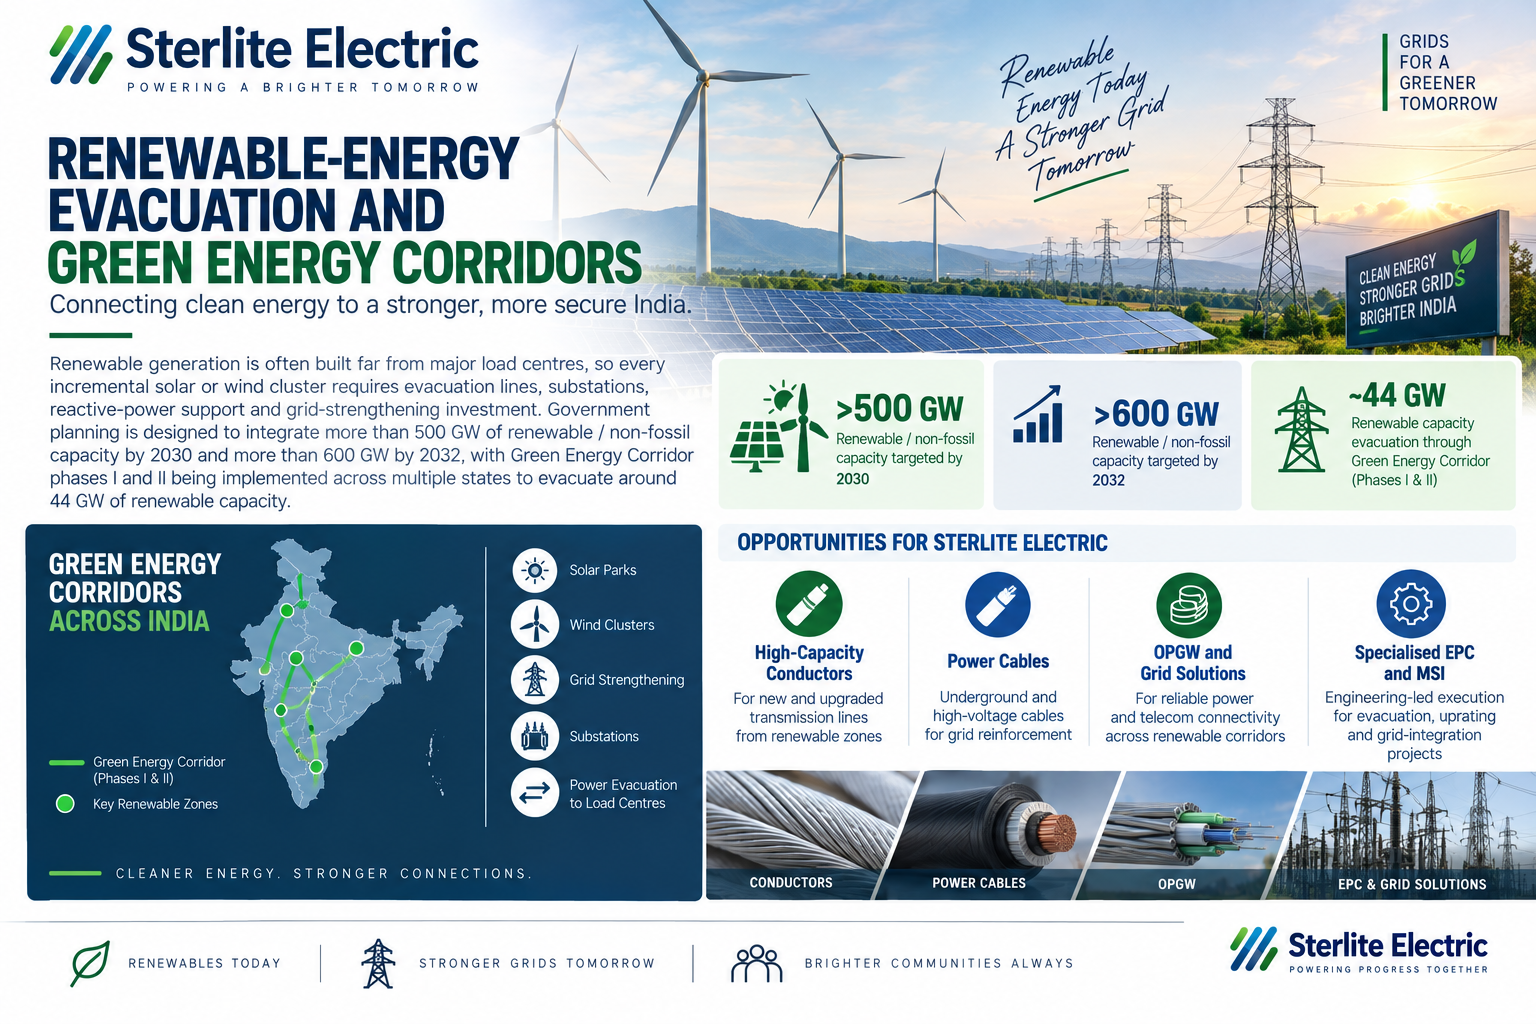
Renewable generation is often built far from major load centres, so every incremental solar or wind cluster requires evacuation lines, substations, reactive-power support and grid-strengthening investment
Government planning is designed to integrate more than 500 GW of renewable / non-fossil capacity by 2030 and more than 600 GW by 2032
Green Energy Corridor phases I and II are being implemented across multiple states and are intended to evacuate around 44 GW of renewable capacity, while dedicated ISTS and InSTS schemes are being developed for larger renewable zones
For Sterlite, the impact is visible across both new-build products and specialised EPC: high-capacity conductors and EHV cables support evacuation, while OPGW and grid-upgrade solutions improve communication, protection and control
Government Policy Support
National Electricity Plan 2023-32: The Government’s transmission plan targets substantial expansion in network length, transformation capacity and inter-regional capability by 2032, with total planned central/state transmission investment of roughly ₹9.15-9.16 lakh Cr. This creates direct demand visibility for conductors, cables, OPGW and associated engineering services
500+ GW renewable-integration planning: Ministry of Power has planned transmission systems to integrate more than 500 GW of renewable / nonfossil capacity by 2030 and more than 600 GW by 2032. Transmission must be built ahead of shorter-gestation renewable projects, increasing the policy priority of grid procurement and execution
Green Energy Corridors: GEC-I and GEC-II support intra-state evacuation infrastructure across major renewable states and are intended to facilitate around 44 GW of renewable capacity. These programmes create product demand as well as brownfield reinforcement opportunities around renewable zones
ISTS / InSTS and HVDC expansion: The policy framework supports both inter-state and intra-state network expansion, including new HVDC corridors for long-distance bulk power transfer. Higher voltage and longer-distance systems increase the technical intensity and value content of conductors, cables and communication infrastructure
Distribution modernisation and reliability: Reforms such as the Revamped Distribution Sector Scheme and state-level network investment encourage feeder strengthening, system automation, loss reduction, undergrounding and improved reliability. Sterlite is more directly exposed to transmission than retail distribution, but grid-hardening investment broadens demand for cables, OPGW and integration services
Storage, green hydrogen and new-load planning: Government planning increasingly incorporates battery storage, pumped storage, green hydrogen and high-density industrial / digital loads. These new loads require additional network capacity and more sophisticated grid management, which expands the need for reinforcement and high-performance equipment
Fundraise/Future Plans
Shareholding
Pre-issue shareholding
Promoter Holding 0.0%
Category
Pre-Issue%
Promoters
0.0%
Total Promoter Holding
0.0%
Additional Shareholders
0.0%
Total Additional Holding
0.0%
Total Shareholding
0.0%
- Overview
- Business
- Financial Highlights
- Industry Overview
- Fundraise/Future Plans
- Documentation
Get the Preqt App and keep in touch around the clock!
 Monitor your investments in real-time.
- Receive tailored deal suggestions.
- Get real-time updates and alerts.
