

Symbiotec Pharmalab
Advancing Complex APIsInnovation Through Chemistry
IPO Summary (PrEqT)
Symbiotec is a specialist pharmaceutical manufacturing platform built around corticosteroid and steroidal-hormone APIs, with newer growth engines in fermentation-led CDMO services and complex double-chamber injectables. The core API franchise remains the earnings base, while recent capex has materially expanded fermentation and injectable capacity. FY26 global volume share was 38.2% in corticosteroid APIs and 23.8% in steroidal-hormone APIs; Hydrocortisone, Testosterone and Methylprednisolone shares were 80.1%, 76.4% and 76.0%, respectively. FY26 revenue was INR 869.1 Cr, EBITDA INR 232.0 Cr and PAT INR 109.9 Cr. FY24-FY26 revenue CAGR was ~10.2%; EBITDA CAGR ~14.5%; PAT CAGR ~4.8%. : FY26 CFO recovered to INR 174.6 Cr after only INR 47.3 Cr in FY25; net debt / EBITDA improved from 2.5x to 1.6x. Current ratio, however, declined to 0.9x because current borrowings increased. The IPO, however, is overwhelmingly an OFS: only INR 150.0 Cr is fresh capital and INR 112.5 Cr of the Net Proceeds is proposed for debt repayment.
IPO Review Rating
Above Avg
MainboardPowering Global Pharma Through Advanced Chemistry and Biotech Manufacturing
Symbiotec is a high-quality, highly specialised API manufacturer with substantially better business economics than its moderate topline growth suggests. The strongest aspects are its 26.6% EBITDA margin, global product leadership, difficult-to-replicate fermentation capabilities, regulated-market credentials, long customer relationships and large export franchise. The valuation is reasonable relative to listed API/CDMO peers but not cheap in absolute terms. At INR 988.0, investors are paying approximately 52.0x FY26 earnings and 5.3x book for a Company producing only 9.5% RoNW, although the relative peer discount is substantial.
PARAMETER
WEIGHT
SCORE
KEY FACTORS
Financial Performance
40.0%
4.0/5
Symbiotec has a strong financial-quality profile, with a 26.6% EBITDA margin, 12.6% PAT margin, 0.3x D/E, positive cash generation and low single-customer concentration.
Show more
Detailed Analysis
Revenue from operations increased from INR 716.2 Cr in FY24 to INR 751.6 Cr in FY25 and INR 869.1 Cr in FY26, representing FY24-FY26 CAGR of approximately 10.2%
EBITDA increased from INR 177.0 Cr in FY24 to INR 206.1 Cr in FY25 and INR 232.0 Cr in FY26, with FY26 EBITDA margin of 26.6%
PAT stood at INR 100.1 Cr in FY24, INR 96.8 Cr in FY25 and INR 109.9 Cr in FY26, translating into FY26 PAT margin of 12.6%
FY26 total borrowings were approximately INR 387.9 Cr against total equity of approximately INR 1,149.6 Cr, resulting in D/E of approximately 0.3x
ROE moderated from 15.0% in FY24 to 12.7% in FY25 and 11.2% in FY26
Operating cash flow remained positive at approximately INR 47.3 Cr in FY25 and INR 174.6 Cr in FY26
The largest customer contributed 16.1% of FY26 product revenue; Top 5 and Top 10 customers contributed 43.0% and 57.6%, respectively
Industry
15.0%
3.0/5
The underlying API market is moderate-growth and increasingly mature, but Symbiotec has an unusually strong competitive position in complex steroid and fermentation APIs.
Show more
Detailed Analysis
The global API market was approximately USD 305.5 billion in 2025 and is projected to reach USD 424.6 billion by 2030, representing CAGR of approximately 6.8%
APIs are an established pharmaceutical segment; moreover, Symbiotec's core corticosteroid and steroidal-hormone API categories are forecast to grow only approximately 1.0-3.0% annually through 2030
API manufacturing involves US FDA DMFs, EDQM CEPs, cGMP compliance and extensive customer/regulatory validation; failures can directly affect market access
Management
15.0%
4.0/5
Promoter operating experience is very strong, Board independence is adequate at 50.0%, and consolidated external operating RPT intensity is low.
Show more
Detailed Analysis
Anil Satwani has been associated with Symbiotec since incorporation in 2002 and with the predecessor business since 1995, giving 30+ years of pharmaceutical-sector experience
The Board has 6 Directors, including 3 Independent Directors, resulting in exactly 50.0% independent representation
13.2% of pre-Offer capital had been pledged at DRHP stage. It was released before the RHP, but the agreement requires relevant shares to be re-pledged after listing. A material writ petition against Anil Satwani also seeks, inter alia, a forensic audit of offer-document disclosures
Total OFS is very large, but the promoter-selling portion is only approximately INR 144.0 Cr, or about 8.2% of the INR 1,757.0 Cr IPO; most of the OFS is PE-investor exit
Valuation
20.0%
3.0/5
Symbiotec is reasonably attractive relative to its listed API/CDMO peers, with 52.0x P/E versus 88.3x peer average and 28.6x EV/EBITDA versus approximately 44.43x peers. However, 5.3x P/B and only 9.5% RoNW reduce absolute valuation comfort
Show more
Detailed Analysis
At INR 988.0, Symbiotec trades at approximately 52.0x FY26 P/E, versus RHP peer average of 88.3x, representing a discount of approximately 41.1%
Symbiotec's estimated EV/EBITDA is approximately 28.6x versus latest accessible selected-peer average of approximately 44.4x
The cap price of INR 988.0 represents approximately 5.3x FY26 NAV of INR 184.7
FY26 RoNW is 9.5%
Merchant Banker Track Record
10.0%
5.0/5
Symbiotec has a high-quality institutional BRLM consortium. The representative recent mainboard sample produces a strong 16.9% average listing return, 29.9x average subscription and 100.0% positive-listing rate, although the three-deal sample should not be confused with a complete multi-year track-record study.
Show more
Detailed Analysis
The representative recent mainboard sample generated average listing return of approximately 16.9%
Representative average overall subscription was approximately 29.9x
All 3 of 3 representative transactions listed above issue price, implying 100.0% positive-listing success in the sample
The four-BRLM consortium comprises established institutional mainboard investment-banking franchises
TOTAL
100%
3.8/5
Weighted Composite Score
Issue Price
₹938.0 to ₹988.0
As of 29 Aug 2026
GMP
₹350.0
As of 29 Aug 2026
Estimated Gain / Loss
+35.4%
Lot Size
15.0 Shares
Grey Market Premium (GMPs) are shared for knowledge purpose only. PrEqt doesn’t promote or execute the trades.
| Issue size | |
|---|---|
| Overall | ₹1,757.0 Cr |
| Fresh Issue | ₹150.0 Cr |
| Offer for Sale | ₹1,607.0 Cr |
Minimum Investment
₹14,820.0 / 225 shares

Merchant Banker
JM Financial Ltd.; Avendus Capital; Motilal Oswal Investment Advisors; Nomura Financial Advisory & Securities
IPO Document
RHP / Anchor Document
Offer Start Date
24th Aug 2026
Offer End Date
27th Aug 2026
Valuation
₹6,244.4 Cr
Revenue (FY'26)
₹872.3 Cr
PAT (FY'26)
₹109.9 Cr
Issue Size
₹1,757.0 Cr
Face Value
₹ 2.0Offer Price
₹ 988.0Lot Size
15.0 sharesSale Type
Fresh capital cum OFSPAT (FY'26)
₹ 109.9 CrPAT Margin (FY'26)
12.6 %P/E Multiple
52.0xEBITDA (FY'26)
₹ 232.0 CrCAGR Growth 2Y
10.2 %ROE (FY'26)
11.2 %ROCE (FY'26)
11.6 %Price to Book Value
5.3xDebt/Equity
0.3xCompany Website
www.symbiotec.comExplore new deals
Overview
Fund Allocation
Total: ₹0 CrSource:Company DRHP
Timeline
IPO Open Date
To Be Announced
IPO Close Date
To Be Announced
Tentative Allotment
To Be Announced
Initiation of Refunds
To Be Announced
Credit of Shares to Demat
To Be Announced
Tentative Listing Date
To Be Announced
Business
Business Model
Geographical Presence
Sales Channel
Key Risk Factor
Financial Highlights
Income Statement
Revenue growth with EBITDA and PAT margins
| Financial Metric | FY 2024 | FY 2025 | FY 2026 |
|---|---|---|---|
| Revenue (₹ Cr) | 723.3 | 756.0 | 872.3 |
| Growth (%) | 26.4% | 4.9% | 15.6% |
| EBITDA (₹ Cr) | 177.0 | 206.1 | 232.0 |
| EBITDA Margin (%) | 24.5% | 27.3% | 26.6% |
| PAT (₹ Cr) | 100.1 | 96.8 | 109.9 |
| PAT Margin (%) | 13.8% | 12.8% | 12.6% |
OBSERVATIONS & INSIGHTS
FY26 revenue increased 15.7% because finished-goods sales increased to INR 808.2 Cr and service revenue increased to INR 33.1 Cr on milestone recognition
EBITDA continued to grow, but FY26 margin moderated because employee costs rose with headcount / increments and power, repairs and professional expenses increased after new capacity was commissioned
FY25 PAT declined mainly because income-tax expense increased to INR 50.2 Cr; FY26 PAT recovered as tax expense fell to INR 43.5 Cr despite higher finance costs and the INR 9.0 Cr wage-code exceptional charge
Balance Sheet
| Financial Metric | FY 2024 | FY 2025 | FY 2026 |
|---|---|---|---|
| Net Worth | ₹ 714.8 Cr | ₹ 814.7 Cr | ₹ 1,149.6 Cr |
| Total Assets | ₹ 1,294.8 Cr | ₹ 1,579.7 Cr | ₹ 1,780.8 Cr |
| Total Borrowing | ₹ 247.2 Cr | ₹ 540.9 Cr | ₹ 387.9 Cr |
| Reserves & Surplus | ₹ 709.5 Cr | ₹ 810.0 Cr | ₹ 1,146.0 Cr |
OBSERVATIONS & INSIGHTS
Reserves & Surplus increased from INR 709.5 Cr in FY24 to INR 810.0 Cr in FY25 mainly through retained profits and the new share-based payment reserve. It then increased sharply to INR 1,146.0 Cr in FY26 because the rights issue added approximately INR 191.8 Cr to securities premium, ESOP allotments added approximately INR 24.8 Cr, and FY26 profits further increased retained earnings
Total Equity increased from INR 714.8 Cr in FY24 to INR 1,149.6 Cr in FY26 because of retained profits, the FY26 rights issue, ESOP allotments and higher paid-up share capital. This larger equity base strengthened leverage but diluted ROE until earnings catch up
Total Borrowings increased from INR 247.2 Cr in FY24 to INR 540.9 Cr in FY25 because higher working-capital needs and capex projects were debt funded. Borrowings then fell to INR 387.9 Cr in FY26 after INR 237.4 Cr of long-term debt repayment, supported by operating cash generation and rights / ESOP equity proceeds
Total Assets the FY24-FY26 increase to INR 1,780.8 Cr was primarily capex-led rather than working-capital-led, with newly commissioned projects moving from CWIP into PPE; future returns therefore depend on commercial utilisation of this enlarged fixed-asset base
Cash Flow
| Financial Metric | FY 2023 | FY 2024 | FY 2025 |
|---|---|---|---|
CFI (₹ Cr) Cash used for investments and long-term assets. | -206.4 Cr | -306.5 Cr | -226.9 Cr |
CFO (₹ Cr) Cash generated from core business operations. | +187.5 Cr | +47.3 Cr | +174.6 Cr |
CFF (₹ Cr) Cash flow related to funding and borrowings. | +21.8 Cr | +278.2 Cr | +36 Cr |
Working Capital
| Efficiency Metric | FY 2023 | FY 2024 | FY 2025 |
|---|---|---|---|
Debtor Days Average number of days taken to collect customer payments. | - | - | - |
Creditor Days Average time taken to pay suppliers and vendors. | - | - | - |
Inventory Days Average number of days inventory remains unsold. | - | - | - |
CCC (Cash Conversion Cycle) (Debtor Days + Inventory Days - Creditor Days) | - | - | - |
Financial Ratios
Measures the company’s leverage relative to shareholder equity.
OBSERVATIONS & INSIGHTS
ROE declined from 15.0% to 11.2% because the equity base expanded faster than PAT, especially in FY26 after the rights issue and ESOP allotments; PAT growth was not yet sufficient to absorb the larger capital base
Debt / Equity increased to 0.7x in FY25 because borrowings were raised for higher working-capital needs and capex projects, then fell to 0.3x in FY26 after long-term debt repayments and a material increase in equity from the rights issue / ESOPs
Interest Coverage declined from 19.1x to 7.1x because finance cost rose from INR 7.2 Cr in FY24 to INR 25.3 Cr in FY26 as borrowing increased during the capex cycle; the rise in PBT was not enough to offset the higher interest burden
Current Ratio fell from 1.4x to 0.9x because current borrowings increased from INR 52.0 Cr in FY24 to INR 319.5 Cr in FY26 and current liabilities grew while current assets remained broadly flat to lower
ROA declined from 7.7% to 6.5% because the asset base expanded sharply through greenfield fermentation / injectables capex, while PAT was broadly flat in FY25 and grew only moderately in FY26
ROCE declined from 14.0% to 11.6% because capital employed expanded faster than EBIT as newly commissioned facilities were not yet fully commercialised; this is also why the RHP discloses a materially higher adjusted ROCE for the mature operating base
Industry Overview
Industry Drivers
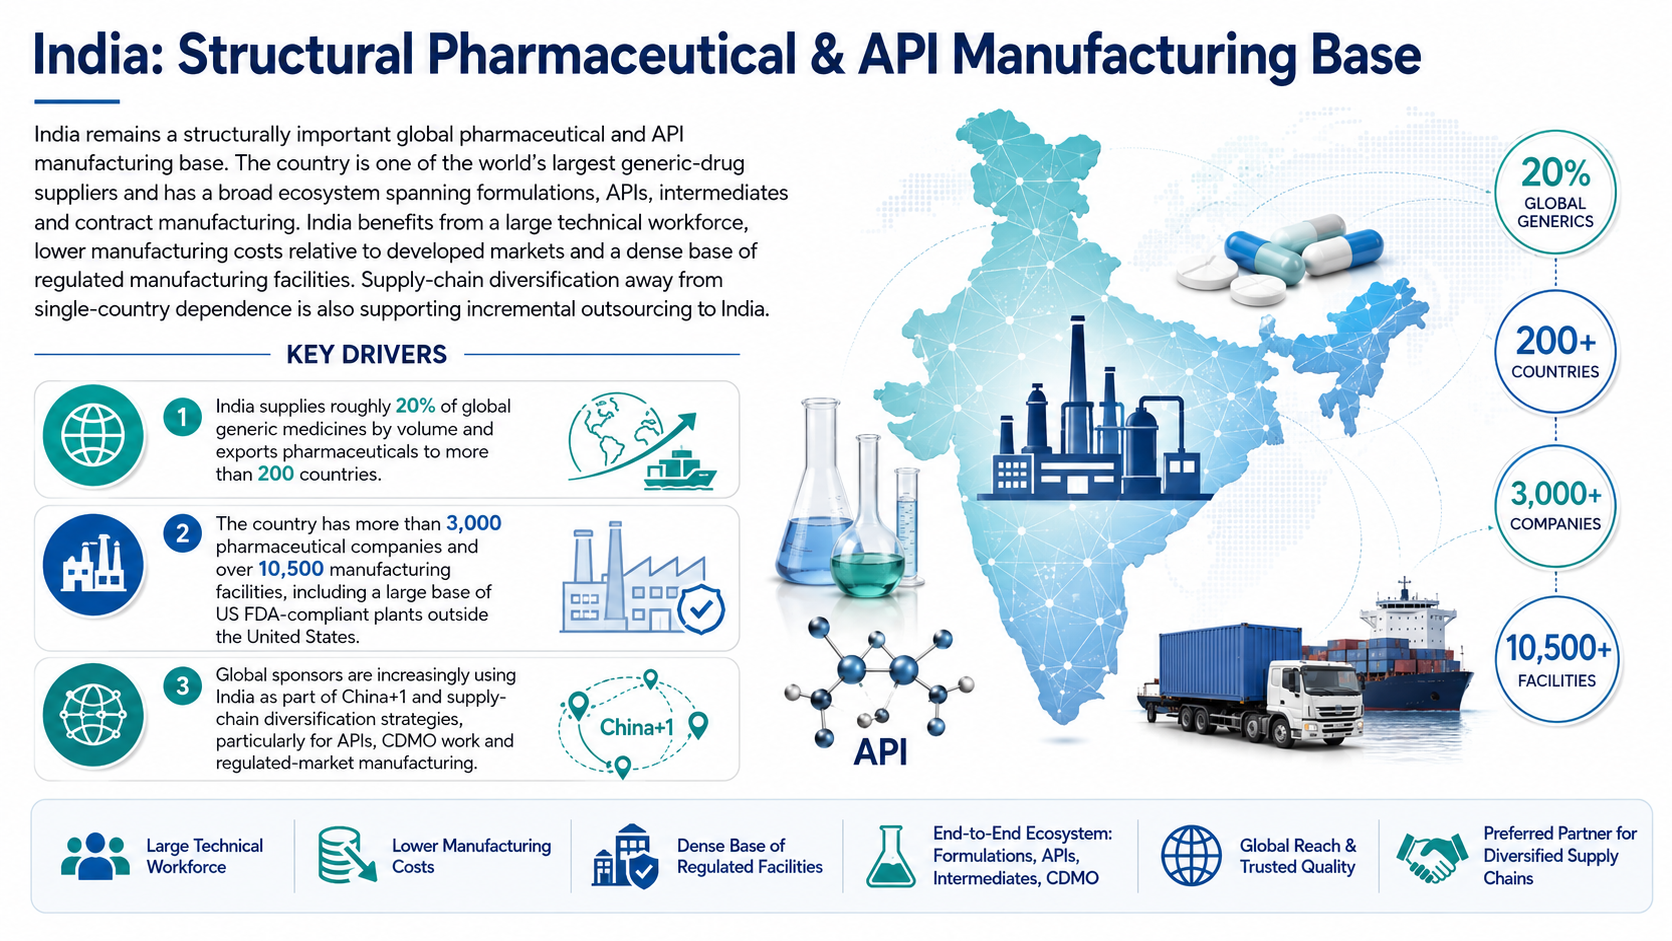
India: Structural Pharmaceutical & API Manufacturing Base
India remains a structurally important global pharmaceutical and API manufacturing base. India is one of the world's largest generic-drug suppliers and has a broad manufacturing ecosystem spanning formulations, APIs, intermediates and contract manufacturing. The country benefits from a large technical workforce, lower manufacturing costs relative to developed markets and a dense base of regulated manufacturing facilities. Supply-chain diversification away from single-country dependence is also supporting incremental outsourcing to India.
The key drivers are:
India supplies roughly 20% of global generic medicines by volume and exports pharmaceuticals to more than 200 countries
The country has more than 3,000 pharmaceutical companies and over 10,500 manufacturing facilities, including a large base of US FDA-compliant plants outside the United States
The country has more than 3,000 pharmaceutical companies and over 10,500 manufacturing facilities, including a large base of US FDA-compliant plants outside the United States
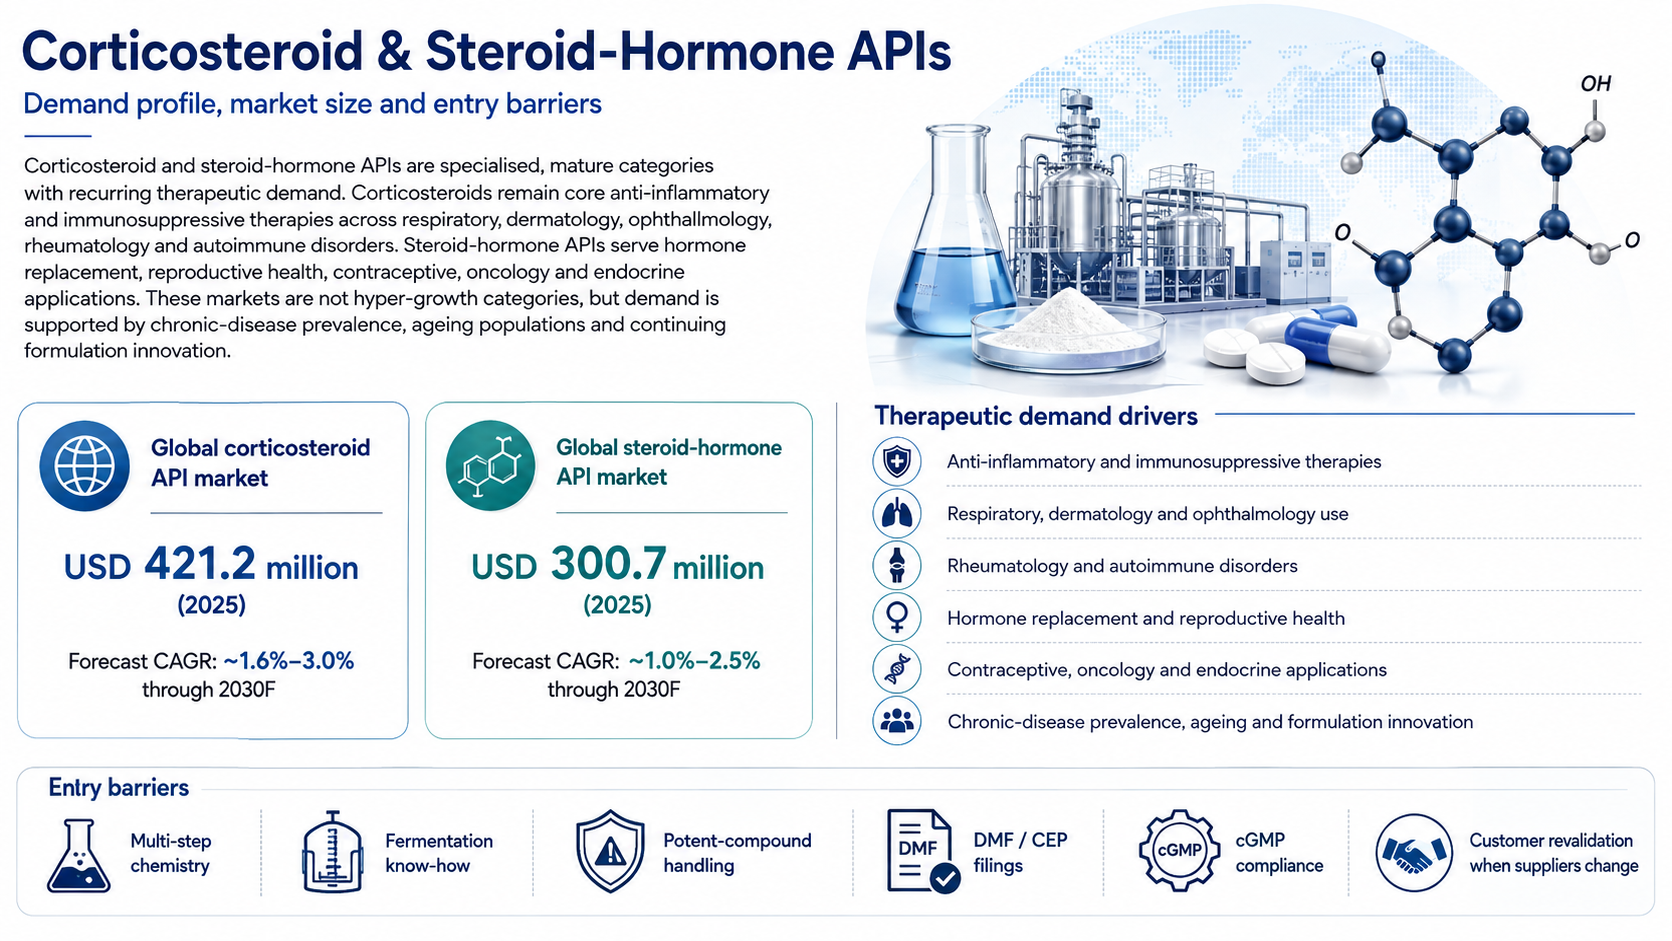
Corticosteroid & Steroid-Hormone APIs: Demand Profile, Market Size & Entry Barriers
Corticosteroid and steroid-hormone APIs are specialised, mature categories with recurring therapeutic demand. Corticosteroids remain core anti-inflammatory and immunosuppressive therapies across respiratory, dermatology, ophthalmology, rheumatology and autoimmune disorders. Steroid-hormone APIs serve hormone replacement, reproductive health, contraceptive, oncology and endocrine applications. These markets are not hyper-growth categories, but demand is supported by chronic-disease prevalence, ageing populations and continuing formulation innovation.
The key details are:
The global corticosteroid API market was valued at approximately USD 421.2 million in 2025 and is forecast to grow at roughly 1.6%-3.0% CAGR through 2030F
The global steroid-hormone API market was valued at approximately USD 300.7 million in 2025 and is forecast to grow at roughly 1.0%-2.5% CAGR through 2030F
Entry barriers arise from multi-step chemistry, fermentation know-how, potent-compound handling, DMF/CEP filings, cGMP compliance and customer revalidation requirements when suppliers are changed
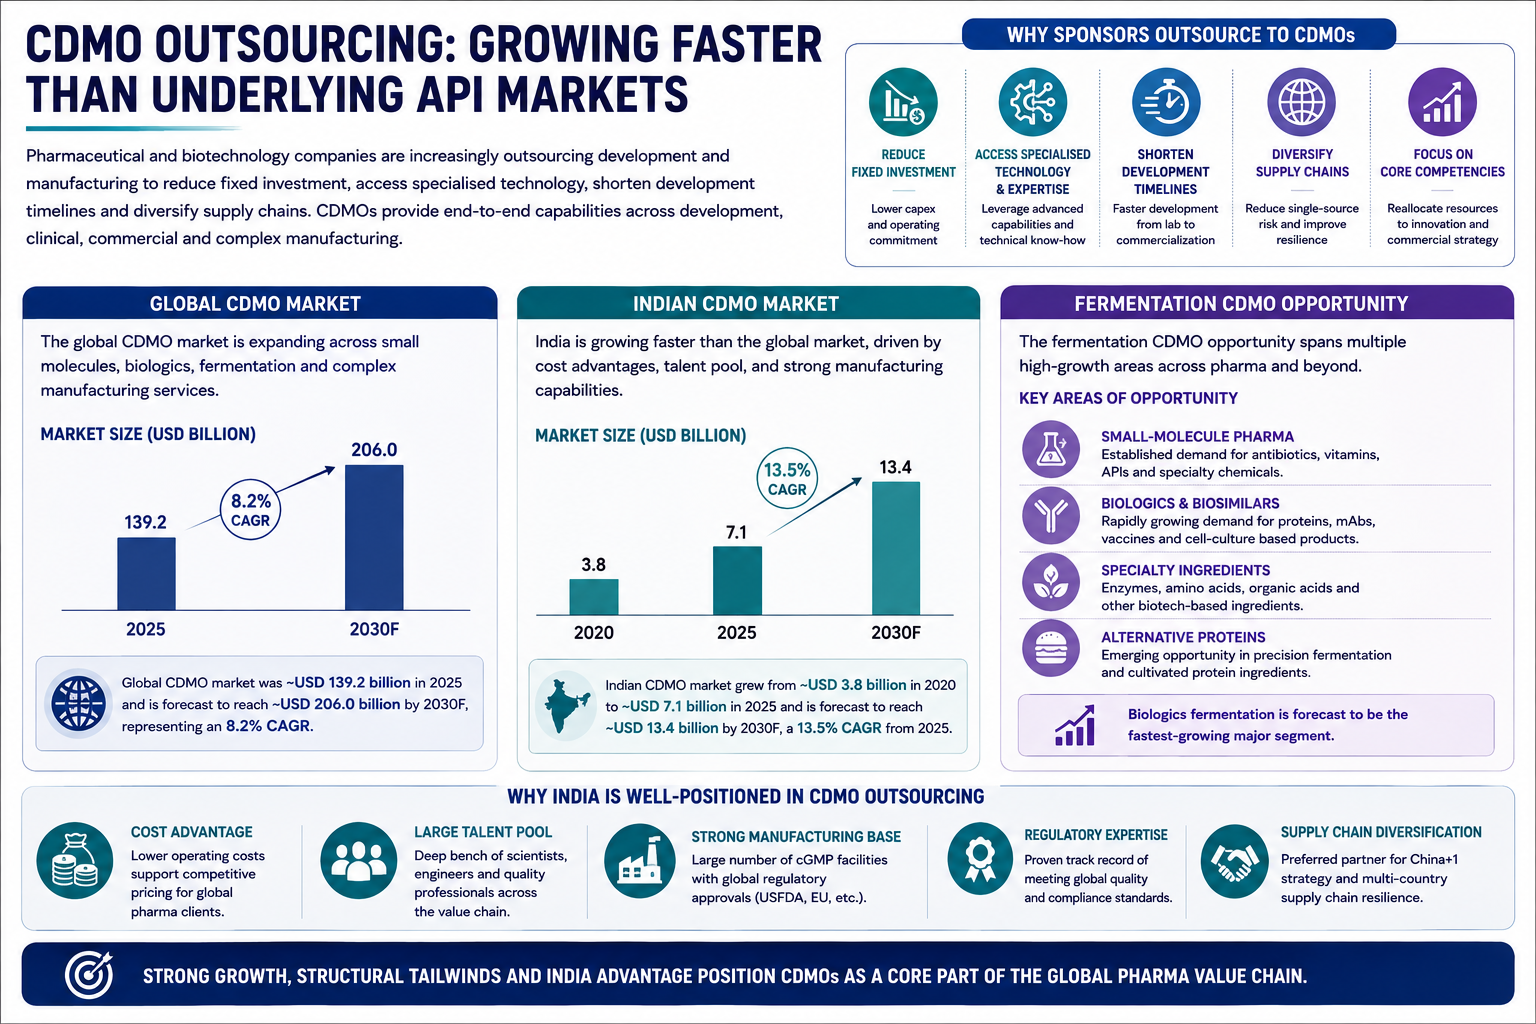
CDMO Outsourcing: Growing Faster Than Underlying API Markets
CDMO outsourcing is growing faster than the underlying mature API markets. Pharmaceutical and biotechnology companies increasingly outsource development and manufacturing to reduce fixed investment, access specialised technology, shorten development timelines and diversify supply chains. The global CDMO market is expanding across small molecules, biologics, fermentation and complex manufacturing services, while India is growing faster than the global market because of cost, talent and manufacturing advantages.
The key details are:
The global CDMO market was approximately USD 139.2 billion in 2025 and is forecast to reach USD 206.0 billion by 2030F, representing an 8.2% CAGR
The Indian CDMO market grew from approximately USD 3.8 billion in 2020 to USD 7.1 billion in 2025 and is forecast to reach USD 13.4 billion by 2030F, a 13.5% CAGR from 2025
The fermentation CDMO opportunity spans small-molecule pharma, biologics, specialty ingredients and alternative proteins; biologics fermentation is forecast to be the fastest-growing major segment in the cited industry report
Risks in the Industry
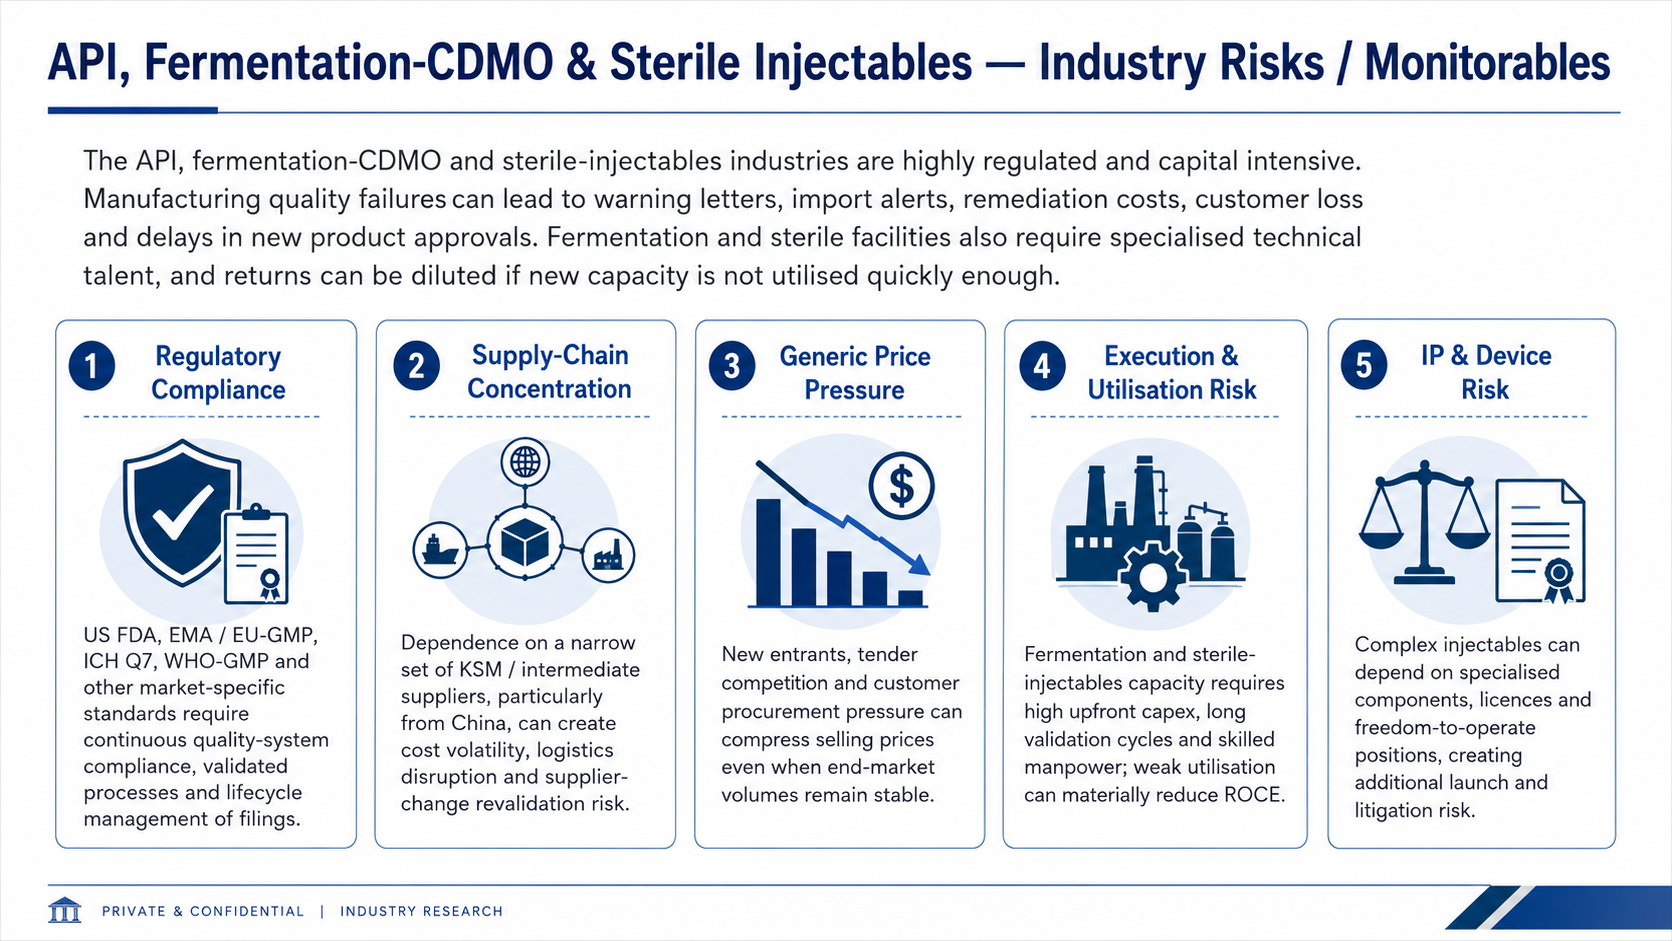
The API, fermentation-CDMO and sterile-injectables industries are highly regulated and capital intensive. Manufacturing quality failures can lead to warning letters, import alerts, remediation costs, customer loss and delays in new product approvals. In addition, fermentation and sterile facilities require specialised technical talent and can experience significant return dilution if new capacity is not utilised quickly enough.
The key risks are:
Regulatory compliance: US FDA, EMA/EU-GMP, ICH Q7, WHO-GMP and other market-specific standards require continuous quality-system compliance, validated processes and lifecycle management of filings
Supply-chain concentration: Dependence on a narrow set of KSM/intermediate suppliers, particularly from China, can create cost volatility, logistics disruption and supplier-change revalidation risk
Generic price pressure: New entrants, tender competition and customer procurement pressure can compress selling prices even when end-market volumes remain stable
Execution and utilisation risk: Fermentation and sterile-injectables capacity requires high upfront capex, long validation cycles and skilled manpower; weak utilisation can materially reduce ROCE
IP and device risk: Complex injectables can depend on specialised components, licences and freedom-to-operate positions, creating additional launch and litigation risk
Government Policy Support
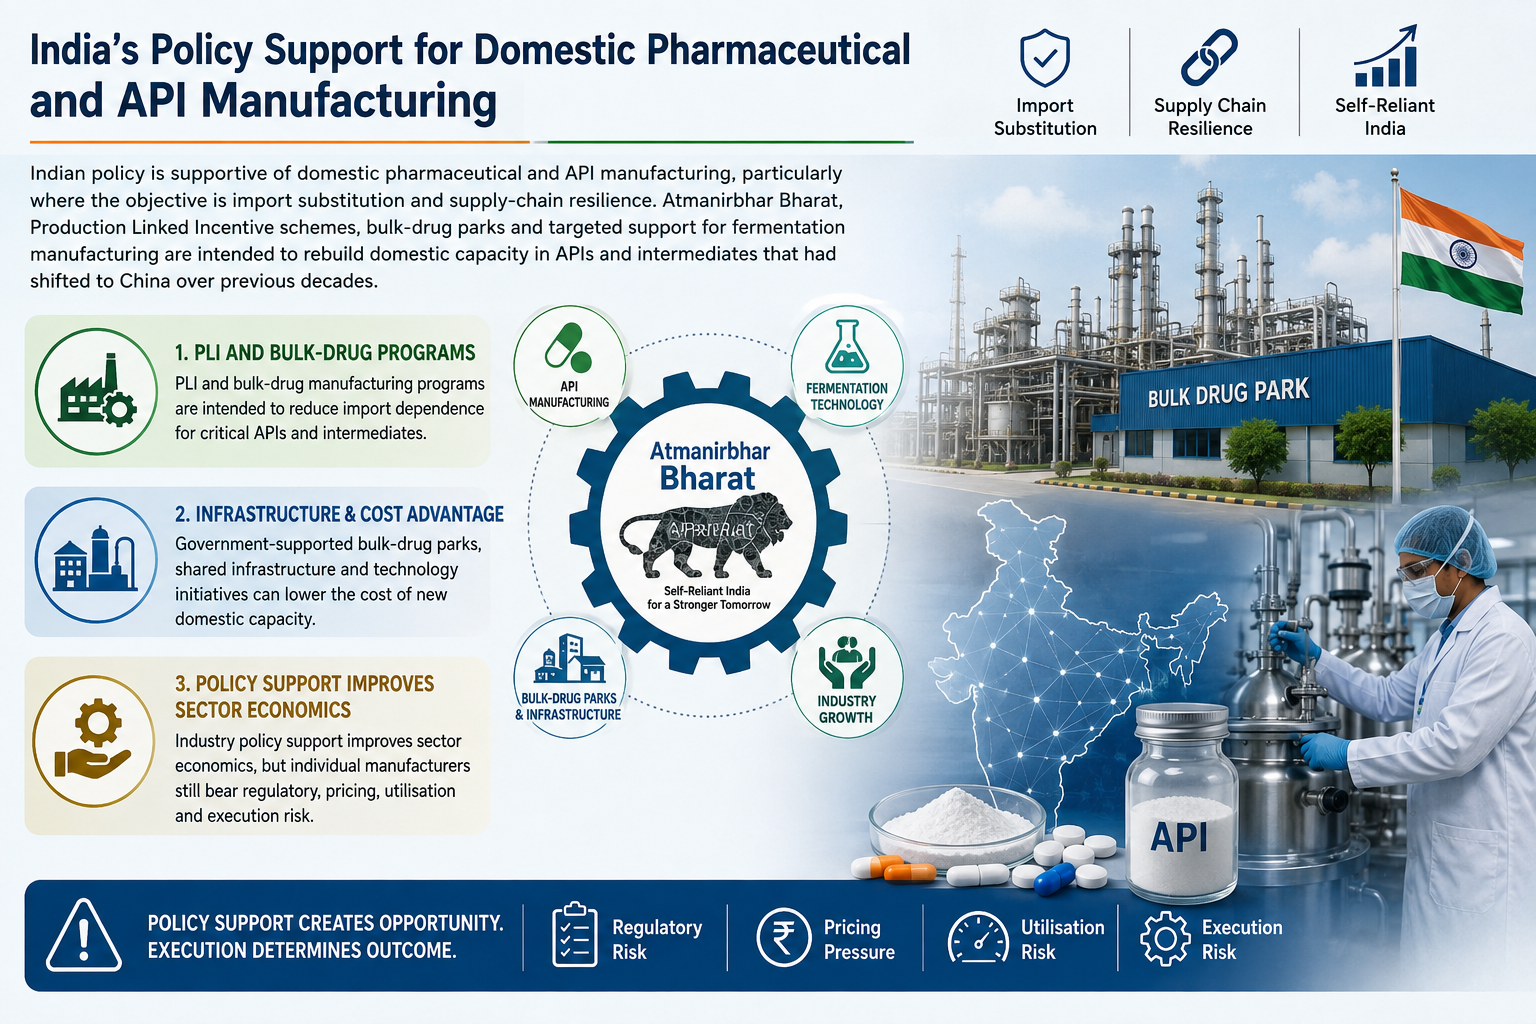
Indian policy is supportive of domestic pharmaceutical and API manufacturing, particularly where the objective is import substitution and supply-chain resilience. Atmanirbhar Bharat, Production Linked Incentive schemes, bulk-drug parks and targeted support for fermentation manufacturing are intended to rebuild domestic capacity in APIs and intermediates that had shifted to China over previous decades.
The key policies are:
PLI and bulk-drug manufacturing programs are intended to reduce import dependence for critical APIs and intermediates
Government-supported bulk-drug parks, shared infrastructure and technology initiatives can lower the cost of new domestic capacity
Industry policy support improves sector economics, but individual manufacturers still bear regulatory, pricing, utilisation and execution risk
Fundraise/Future Plans
Shareholding
Pre-issue shareholding
Promoter Holding 0.0%
Post-Issue Shareholding
Promoter Holding 0.0%
Category
Pre-Issue%Post-Issue%
Promoters
Anil Satwani
4.5%4.4%
Kashish Satwani
4.4%4.3%
Sushil Satwani
2.0%1.9%
Satwani Holdings LLP
18.0%15.3%
Total Promoter Holding
28.9%25.9%
Additional Shareholders
Rosewood Investments
34.8%18.4%
India Business Excellence Fund - III
24.2%16.1%
Total Additional Holding
59.0%34.5%
Total Shareholding
87.9%60.4%
- Overview
- Business
- Financial Highlights
- Industry Overview
- Fundraise/Future Plans
- Documentation
Get the Preqt App and keep in touch around the clock!
 Monitor your investments in real-time.
- Receive tailored deal suggestions.
- Get real-time updates and alerts.
