


Taparia Tools Ltd.
Precision in Every ToolTools Built to Last
IPO Review and Rating
Speculative
DRHP Not FiledOverall Recommendation
Taparia Tools has excellent profitability, high ROE, positive cash generation, no financial debt, a recognised brand and consistent dividend distributions. Nevertheless, the ₹8,190 crore valuation represents 54.1x earnings, 8.0x sales and 18.8x book value for a business growing revenue at approximately 11.1% annually. More importantly, the enormous difference between dealer quotations and the almost non-traded BSE price creates exceptional price-discovery and exit risk. The Company merits monitoring, but investment should require a materially lower valuation and documented evidence that shares can be sold at comparable off-market prices.
PARAMETER
WEIGHT
SCORE
KEY FACTORS
Financial Performance
25.0%
4.0/5
Taparia combines double-digit growth, strong margins, debt-free operations and excellent returns, supported by consistently positive cash generation
Show more
Detailed Analysis
Revenue increased from ₹828.5 crore in FY24 to ₹1,023.4 crore in FY26, representing approximately 11.1% CAGR
FY26 operating margin was 18.7, profit before interest and depreciation was approximately ₹205.38 crore.
FY26 PAT of ₹151.53 crore produced a strong 14.8% margin
The Company had no bank or financial-institution borrowings, only ordinary lease liabilities remained
FY26 ROE was approximately 37.6%, reflecting strong profitability and efficient utilisation of shareholder capital
Industry
25.0%
2.0/5
Hand-tool demand is steady and policy-supported, but mature markets, fragmented competition and minimal exports restrict structural upside.
Show more
Detailed Analysis
The global hand-tools market is projected to increase from approximately $34 billion to $60 billion by 2035, implying about 5.8% CAGR
Hand tools represent an early-mature industry, although organised brands and export-oriented Indian manufacturers retain growth opportunities
Manufacturing policies are supportive, but raw-material duties, quality-control requirements and structural cost disadvantages create a mixed environment
Global demand is growing, but Taparia’s FY25 foreign-exchange earnings were only ₹7.3 crore, below 1% of revenue
Management
25.0%
4.0/5
Long promoter experience, adequate independence and negligible operating related-party transactions support governance, despite minor legacy claims.
Show more
Detailed Analysis
Taparia was incorporated in 1965 and commenced hand-tool manufacturing in 1969, providing the promoter group over 50 years’ experience
Three of nine FY25 directors were independent, equalling 33.3% and meeting the framework’s intermediate threshold
Operating RPTs were well below 5% of revenue and were reported as ordinary-course, arm’s-length transactions
Valuation Metrics
25.0%
2.0/5
Strong fundamentals are overwhelmed by premium off-market multiples and an extraordinary disconnect between dealer quotations and executable exchange prices.
Show more
Detailed Analysis
The supplied 54.08x P/E is approximately 80% above the stated industry P/E of 30x
Off-market valuation implies approximately 39x EV/EBITDA
The supplied P/B of 18.81x
TOTAL
100%
3.0/5
Weighted Composite Score
Per Share Price
₹5395.9
As of 29 Aug 2026
Lot Size
20.0 Shares
Minimum Investment
₹1,07,918.0 / 20 shares
Market Cap. (₹ Cr)
Revenue FY’26
PAT FY’26
P/E Multiple
Face Value
₹ 10.0Offer Price
₹ 5,395.9Lot Size
20.0 sharesSale Type
Secondary SalePAT FY’26
₹ 151.5 CrPAT Margin (%)
14.8 %P/E Multiple
54.1xCAGR Growth 3Y
11.1 %ROE (FY’26)
34.8 %ROCE (FY’26)
46.3 %Price to Book Value ratio
18.8xDebt/Equity (FY’26)
0.0xMerchant banker appointed
❌ NoCompany Website
www.tapariatools.comDisclaimer: Unlisted shares are unregulated & illiquid. This is NOT investment advice. Please do your own due diligence before investing.
Minimum Investment
₹1,07,918.0 / 20 sharesShares Lot 20 X 1
Investment amount
₹1,07,918.0
Overview
Business
Products
Business Model
Geographical Presence
Sales Channel
Key Investment Monitorables
Financial Highlights
Income Statement
Revenue growth with EBITDA and PAT margins
| Financial Metric | FY 2024 | FY 2025 | FY 2026 |
|---|---|---|---|
| Revenue (₹ Cr) | 828.5 | 912.9 | 1,023.4 |
| Growth (%) | 8.4% | 10.2% | 12.1% |
| EBITDA (₹ Cr) | 135.1 | 167.8 | 205.4 |
| EBITDA Margin (%) | 16.3% | 18.4% | 20.1% |
| PAT (₹ Cr) | 99.8 | 122.5 | 151.5 |
| PAT Margin (%) | 12.0% | 13.4% | 14.8% |
OBSERVATIONS & INSIGHTS
Revenue increased from ₹828.5 Cr in FY24 to ₹1,023.4 Cr in FY26, representing an 11.1% CAGR. Annual revenue growth also accelerated from 8.4% to 12.1%
EBITDA increased from ₹135.1 Cr to ₹205.4 Cr at a 23.3% CAGR, while EBITDA margin expanded by 3.8 percentage points from 16.3% to 20.1%
PAT increased from ₹99.8 Cr in FY24 to ₹151.5 Cr in FY26, representing a 23.2% CAGR. PAT margin consequently improved from 12.0% to 14.8%
Balance Sheet
| Financial Metric | FY 2023 | FY 2024 | FY 2025 |
|---|---|---|---|
| EQUITY & LIABILITIES | ₹ 409.6 Cr | ₹ 441.7 Cr | ₹ 520.6 Cr |
| Net Worth | ₹ 316.6 Cr | ₹ 371.1 Cr | ₹ 435.5 Cr |
| Share Capital | ₹ 15.2 Cr | ₹ 15.2 Cr | ₹ 15.2 Cr |
| Reserves & Surplus | ₹ 301.4 Cr | ₹ 355.9 Cr | ₹ 420.3 Cr |
| Total Liabilities | ₹ 93.0 Cr | ₹ 70.6 Cr | ₹ 85.1 Cr |
| Current Liabilities | ₹ 89.5 Cr | ₹ 65.2 Cr | ₹ 80.0 Cr |
| Borrowings | ₹ 0.2 Cr | ₹ 1.2 Cr | ₹ 1.0 Cr |
| Trade Payables | ₹ 62.6 Cr | ₹ 52.5 Cr | ₹ 65.4 Cr |
| Other Current Liabilities | ₹ 26.7 Cr | ₹ 11.5 Cr | ₹ 13.6 Cr |
| Non-Current Liabilities | ₹ 3.5 Cr | ₹ 5.4 Cr | ₹ 5.1 Cr |
| Borrowings | ₹ 0.1 Cr | ₹ 0.9 Cr | ₹ 0.6 Cr |
| Other Non-Current Liabilities | ₹ 3.4 Cr | ₹ 4.5 Cr | ₹ 4.5 Cr |
| ASSETS | ₹ 409.6 Cr | ₹ 441.6 Cr | ₹ 520.7 Cr |
| Current Assets | ₹ 383.9 Cr | ₹ 398.7 Cr | ₹ 485.8 Cr |
| Trade Receivables | ₹ 78.3 Cr | ₹ 79.3 Cr | ₹ 87.1 Cr |
| Inventory | ₹ 126.2 Cr | ₹ 150.5 Cr | ₹ 172.1 Cr |
| Cash & Cash Equivalents | ₹ 10.8 Cr | ₹ 7.0 Cr | ₹ 7.8 Cr |
| Other Current Assets | ₹ 168.6 Cr | ₹ 161.9 Cr | ₹ 218.8 Cr |
| Non-Current Assets | ₹ 25.7 Cr | ₹ 42.9 Cr | ₹ 34.9 Cr |
| Fixed Assets | ₹ 19.5 Cr | ₹ 26.7 Cr | ₹ 29.8 Cr |
| Other Non-Current Assets | ₹ 6.2 Cr | ₹ 16.2 Cr | ₹ 5.1 Cr |
OBSERVATIONS & INSIGHTS
Shareholders' wealth increased 37.6% from FY24 to ₹435.5 Cr in FY26, driven by retained earnings after substantial dividend distributions
Other current assets increased to ₹218.8 Cr, principally reflecting ₹215.5 Cr of current investments. Liquidity quality depends on instrument type, valuation and accessibility
Inventory increased to ₹172.1 Cr and represented 33.1% of total assets, reinforcing the need to monitor ageing, obsolescence and sourcing efficiency
Mapped fixed assets increased to ₹29.8 Cr, while the earlier Vapi plant project remained stalled and management indicated that completing it may not be feasible
Cash Flow
| Financial Metric | FY 2024 | FY 2025 | FY 2026 |
|---|---|---|---|
CFO (₹ Cr) Cash generated from core business operations. | +116.5 Cr | +79.2 Cr | +137.3 Cr |
CFI (₹ Cr) Cash used for investments and long-term assets. | -58.5 Cr | -11.3 Cr | -49.1 Cr |
CFF (₹ Cr) Cash flow related to funding and borrowings. | -54.7 Cr | -69.2 Cr | -87.9 Cr |
Working Capital
| Efficiency Metric | FY 2023 | FY 2024 | FY 2025 |
|---|---|---|---|
Debtor Days Average number of days taken to collect customer payments. | - | - | - |
Creditor Days Average time taken to pay suppliers and vendors. | - | - | - |
Inventory Days Average number of days inventory remains unsold. | - | - | - |
CCC (Cash Conversion Cycle) (Debtor Days + Inventory Days - Creditor Days) | - | - | - |
Financial Ratios
Measures the company’s leverage relative to shareholder equity.
OBSERVATIONS & INSIGHTS
ROE increased from 31.5% in FY24 to 34.8% in FY26, while ROA improved from 26.3% to 31.5%, reflecting stronger earnings generated from the Company’s equity and asset base
The debt-to-equity ratio remained at 0.0x throughout FY24–FY26. Interest coverage increased from 460.1x to 781.2x, indicating negligible finance-cost pressure and substantial debt-servicing capacity
The current ratio improved from 4.3x in FY24 to 6.1x in FY25 and remained at 6.1x in FY26. ROCE simultaneously increased from 42.2% to 46.3%
Industry Overview
Industry Drivers
Expansion of Technological Capabilities
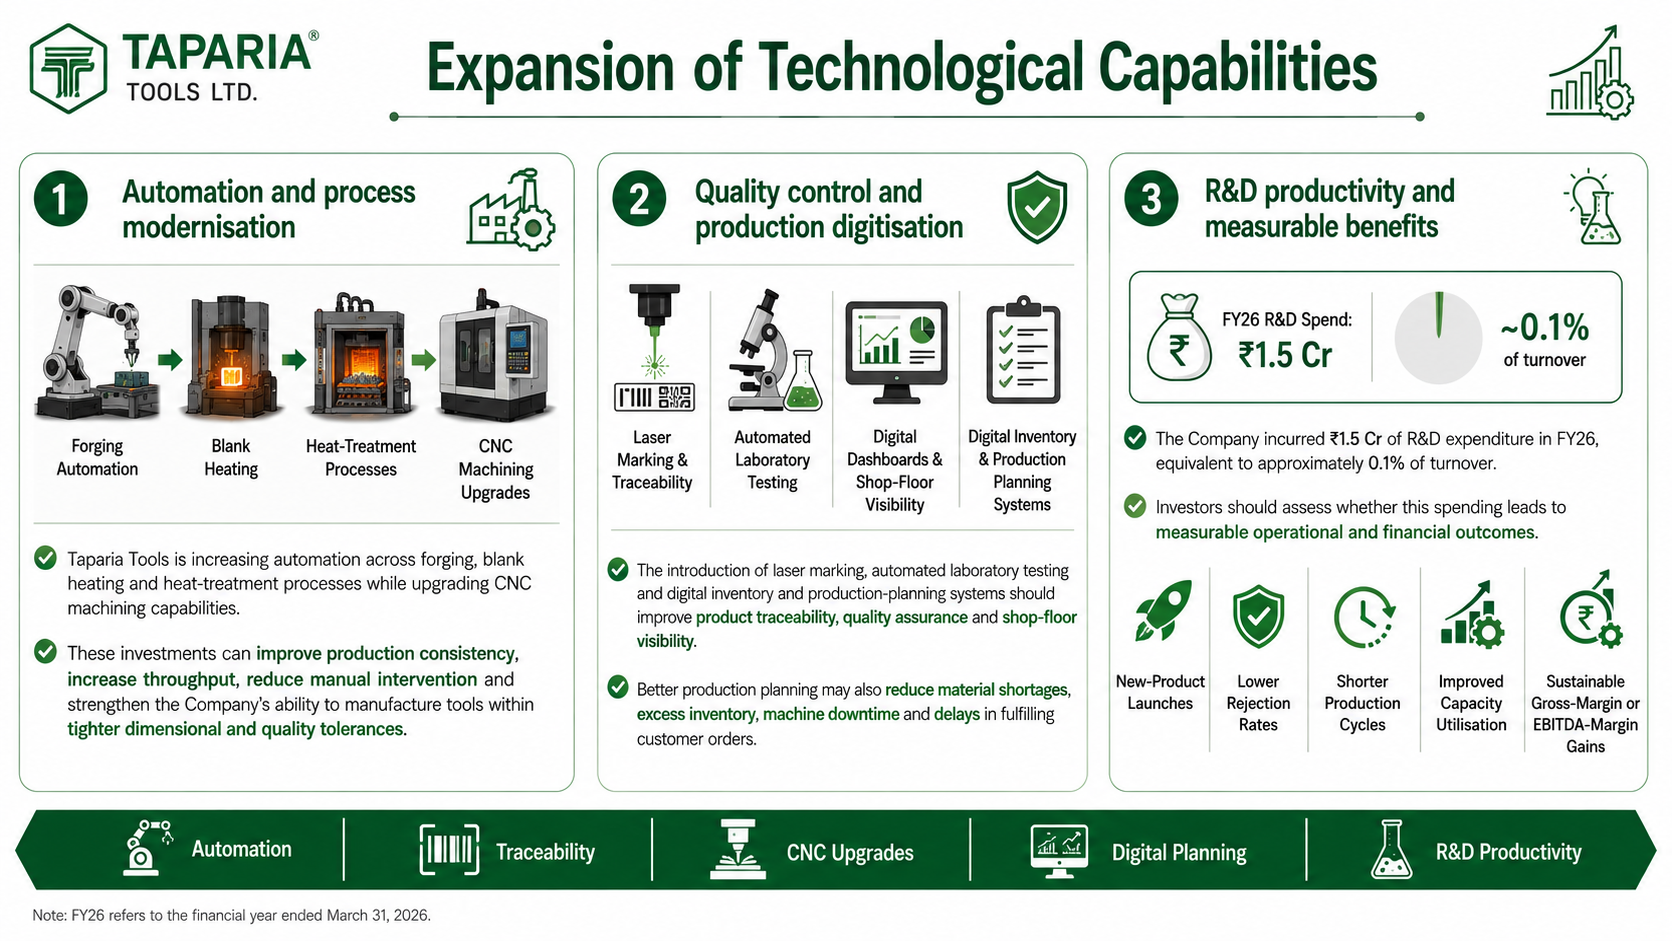
Taparia Tools is increasing automation across forging, blank heating and heat-treatment processes while upgrading CNC machining capabilities. These investments can improve production consistency, increase throughput, reduce manual intervention and strengthen the Company’s ability to manufacture tools within tighter dimensional and quality tolerances
The introduction of laser marking, automated laboratory testing and digital inventory and production-planning systems should improve product traceability, quality assurance and shop-floor visibility. Better production planning may also reduce material shortages, excess inventory, machine downtime and delays in fulfilling customer orders
The Company incurred ₹1.5 Cr of R&D expenditure in FY26, equivalent to approximately 0.1% of turnover. Investors should assess whether this spending leads to new-product launches, lower rejection rates, shorter production cycles, improved capacity utilisation and sustainable gross-margin or EBITDA-margin gains
Capacity Expansion
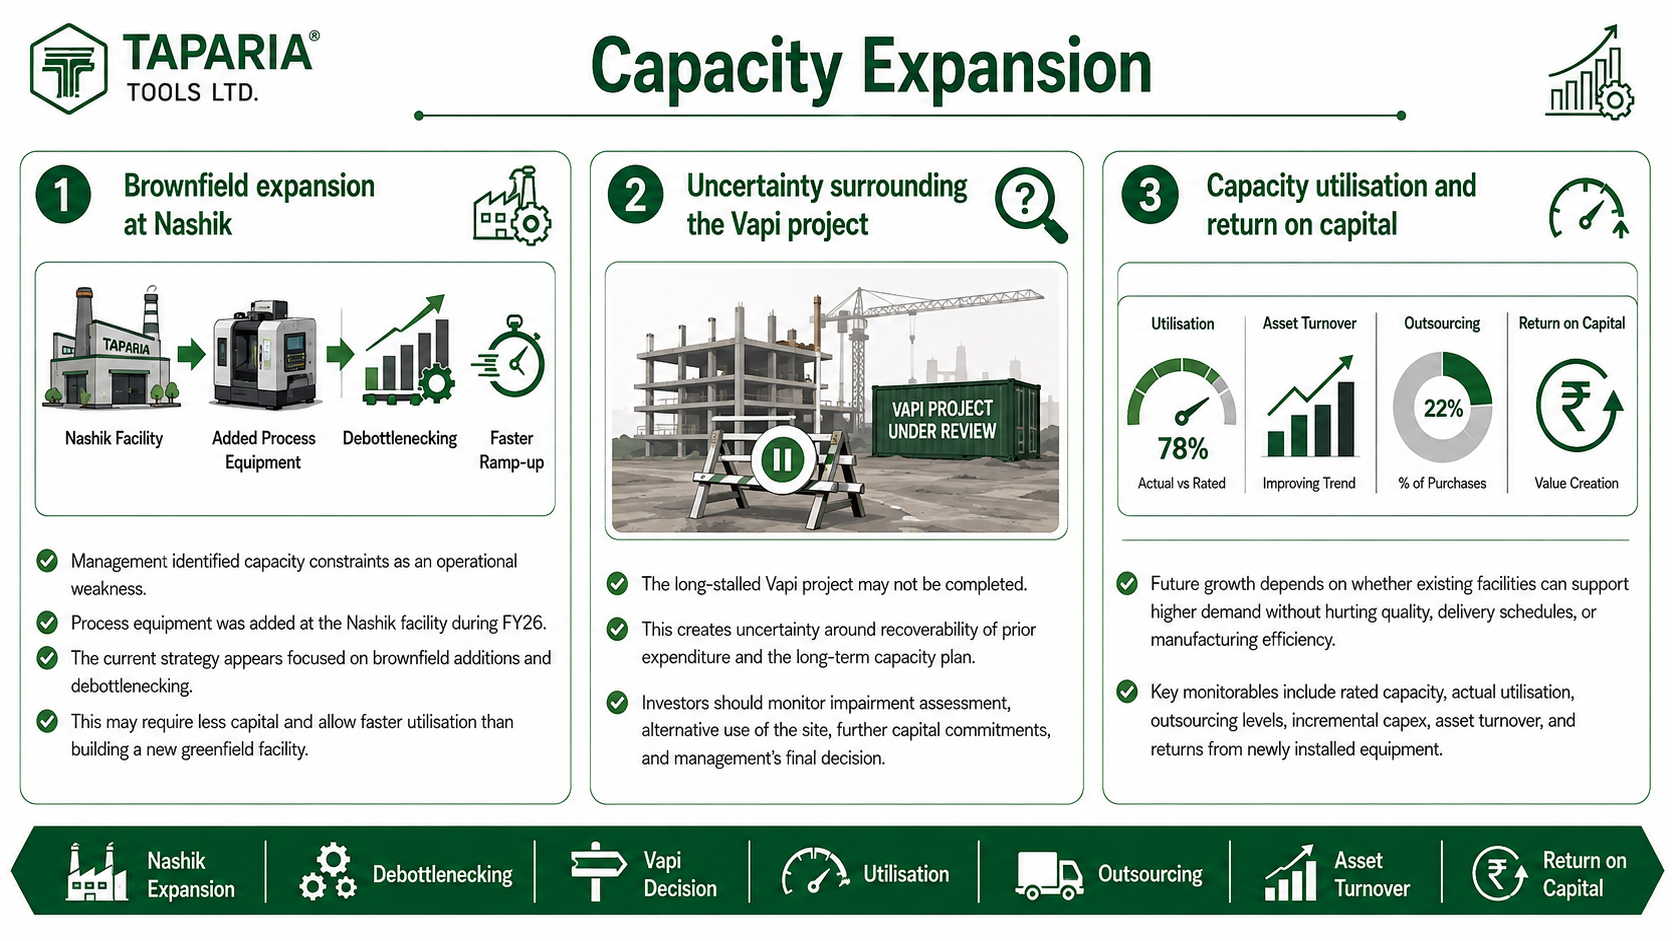
Management has identified capacity constraints as an operational weakness and added process equipment at the Nashik facility during FY26. The current expansion strategy appears focused on brownfield additions and debottlenecking, which may require less capital and achieve faster utilisation than establishing an entirely new manufacturing facility
The long-stalled Vapi project may not be completed, creating uncertainty regarding the recoverability of expenditure already incurred and the Company’s long-term capacity plan. Investors should monitor any impairment assessment, alternative use of the site, further capital commitments and management’s final decision regarding the project
Future growth will depend on whether existing facilities can accommodate higher demand without affecting product quality, delivery schedules or manufacturing efficiency. Rated capacity, actual utilisation, outsourcing levels, incremental capital expenditure, asset turnover and returns generated from newly installed equipment should be tracked closely
Domestic Market Penetration
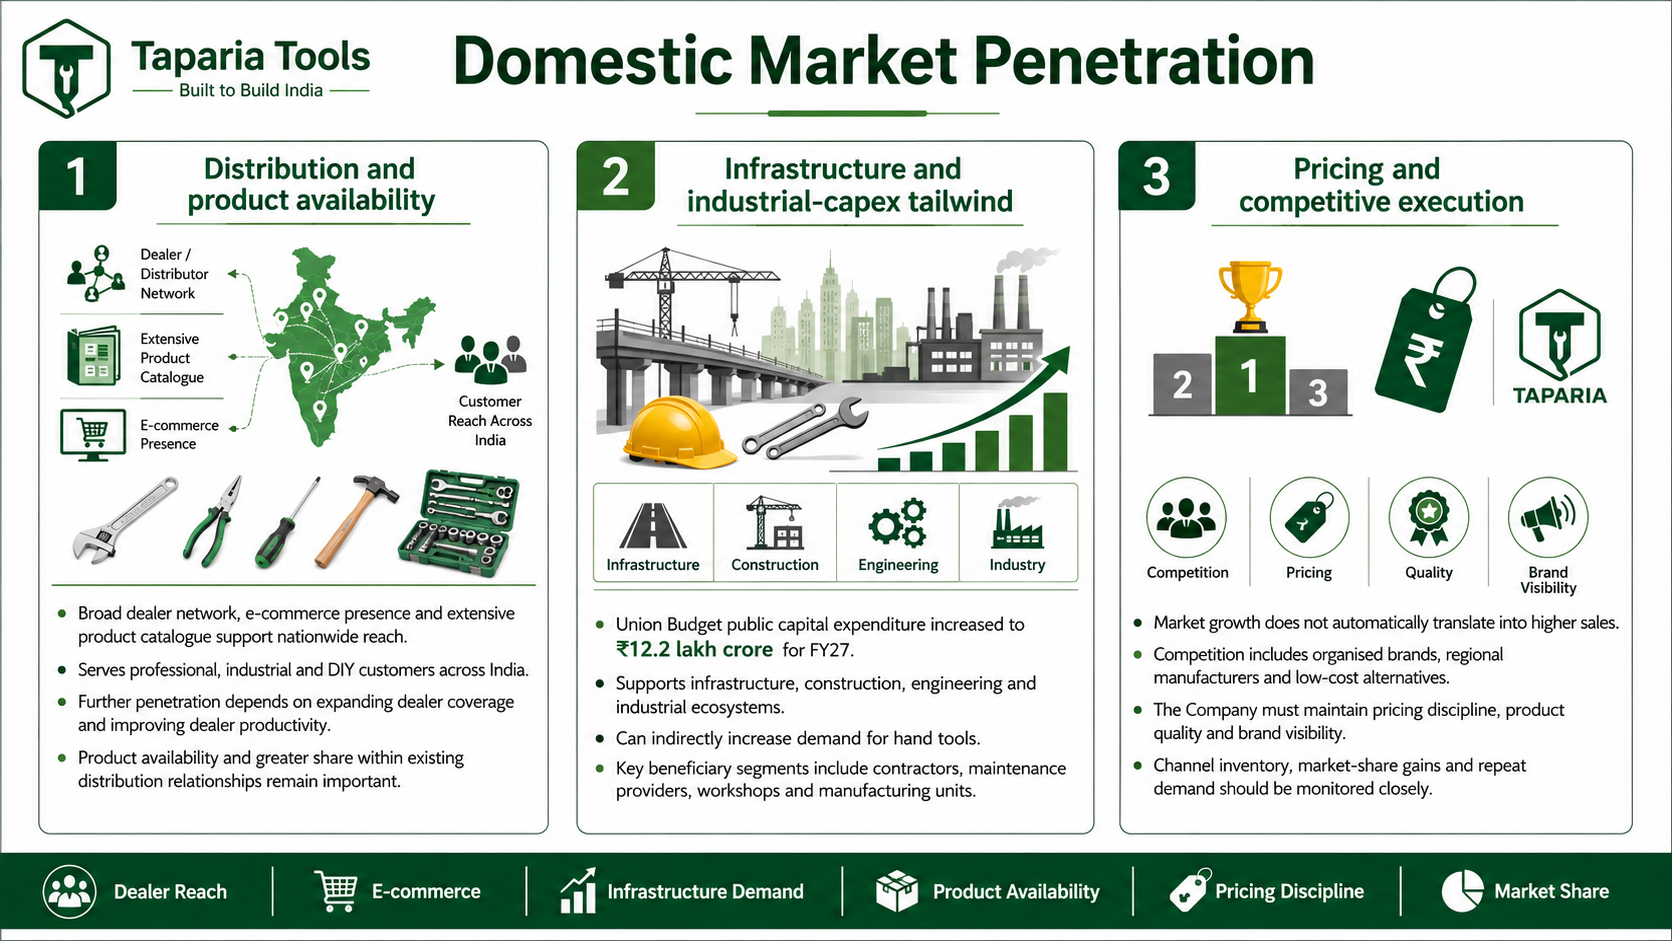
Taparia Tools’ broad dealer network, e-commerce presence and extensive product catalogue provide access to professional, industrial and DIY customers across India. Further market penetration will depend on expanding dealer coverage, improving dealer productivity, ensuring product availability and increasing the share of the Company’s products within existing distribution relationships
The Union Budget increased public capital expenditure to ₹12.2 lakh crore for FY27, supporting activity across infrastructure, construction, engineering and industrial ecosystems. This may indirectly increase demand for hand tools, particularly from contractors, maintenance providers, workshops, manufacturing units and other professional users
Market growth does not automatically translate into higher sales because the industry faces competition from organised brands, regional manufacturers and low-cost alternatives. The Company must maintain pricing discipline, product quality, brand visibility and channel inventory while demonstrating measurable market-share gains and repeat demand
Global Market Penetration
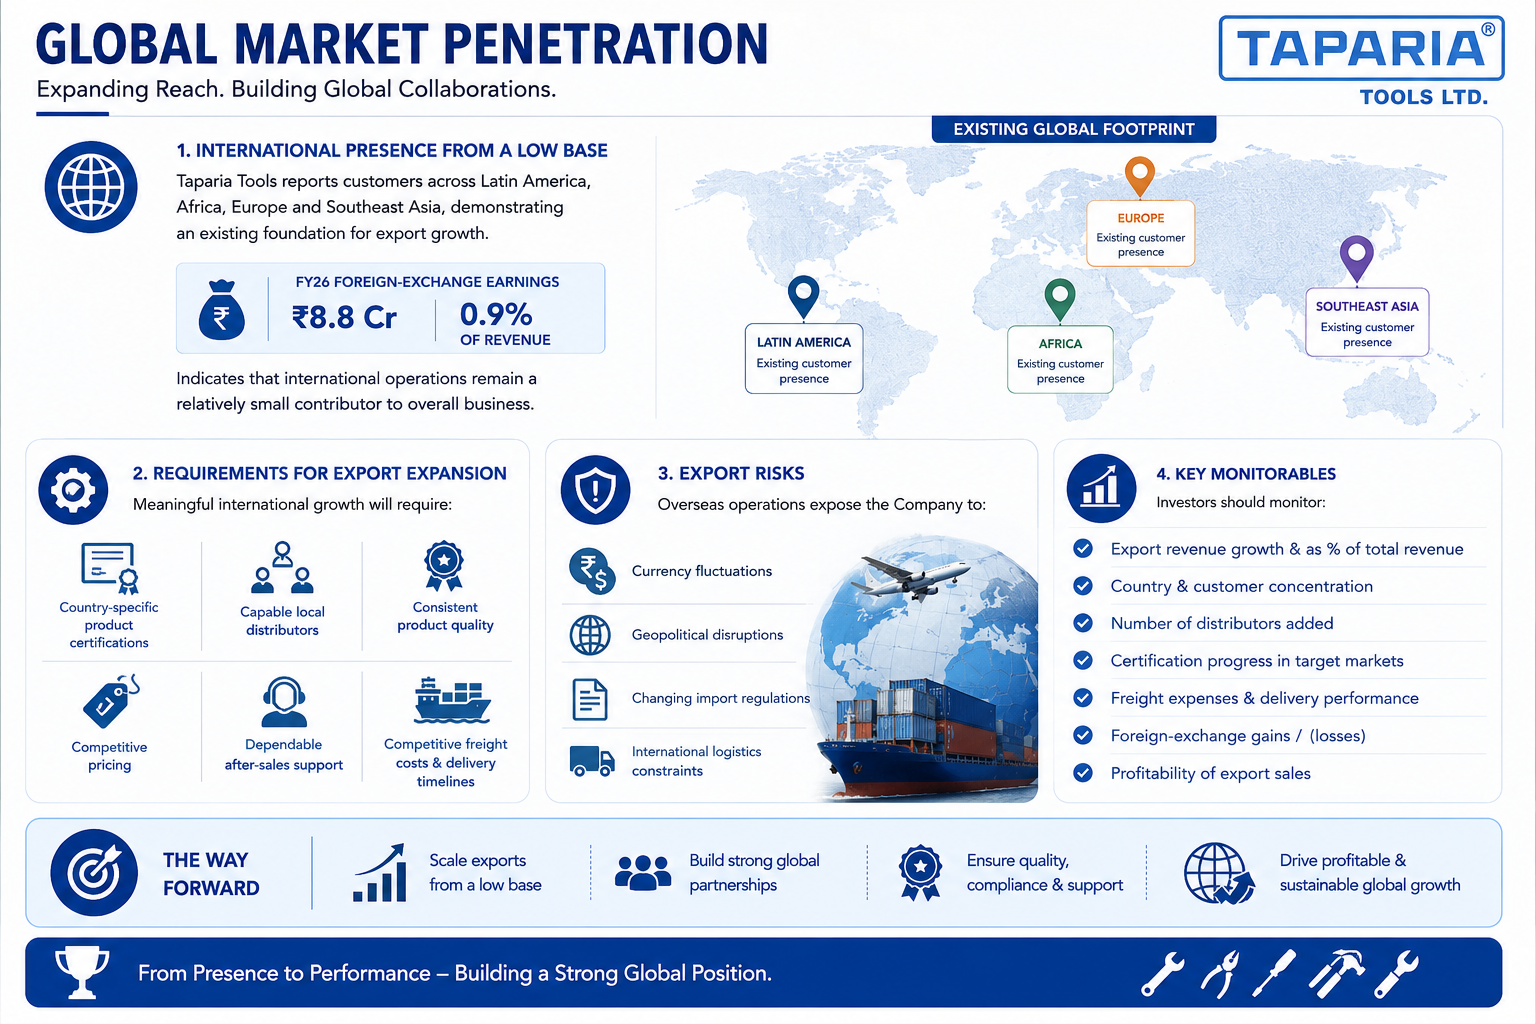
Taparia Tools reports customers across Latin America, Africa, Europe and Southeast Asia, demonstrating an existing foundation for export growth. However, FY26 foreign-exchange earnings of ₹8.8 Cr represented only 0.9% of revenue, indicating that international operations remain a relatively small contributor to the overall business
Meaningful international growth will require country-specific product certifications, capable local distributors, consistent product quality, competitive pricing and dependable after-sales support. The Company must also ensure that freight costs and delivery timelines remain competitive against established global and regional tool manufacturers
Overseas operations expose the Company to currency fluctuations, geopolitical disruptions, changing import regulations and international logistics constraints. Investors should monitor export revenue growth, country and customer concentration, distributor additions, certification progress, freight expenses, foreign-exchange gains or losses and the profitability of export sales
Government Policy Support
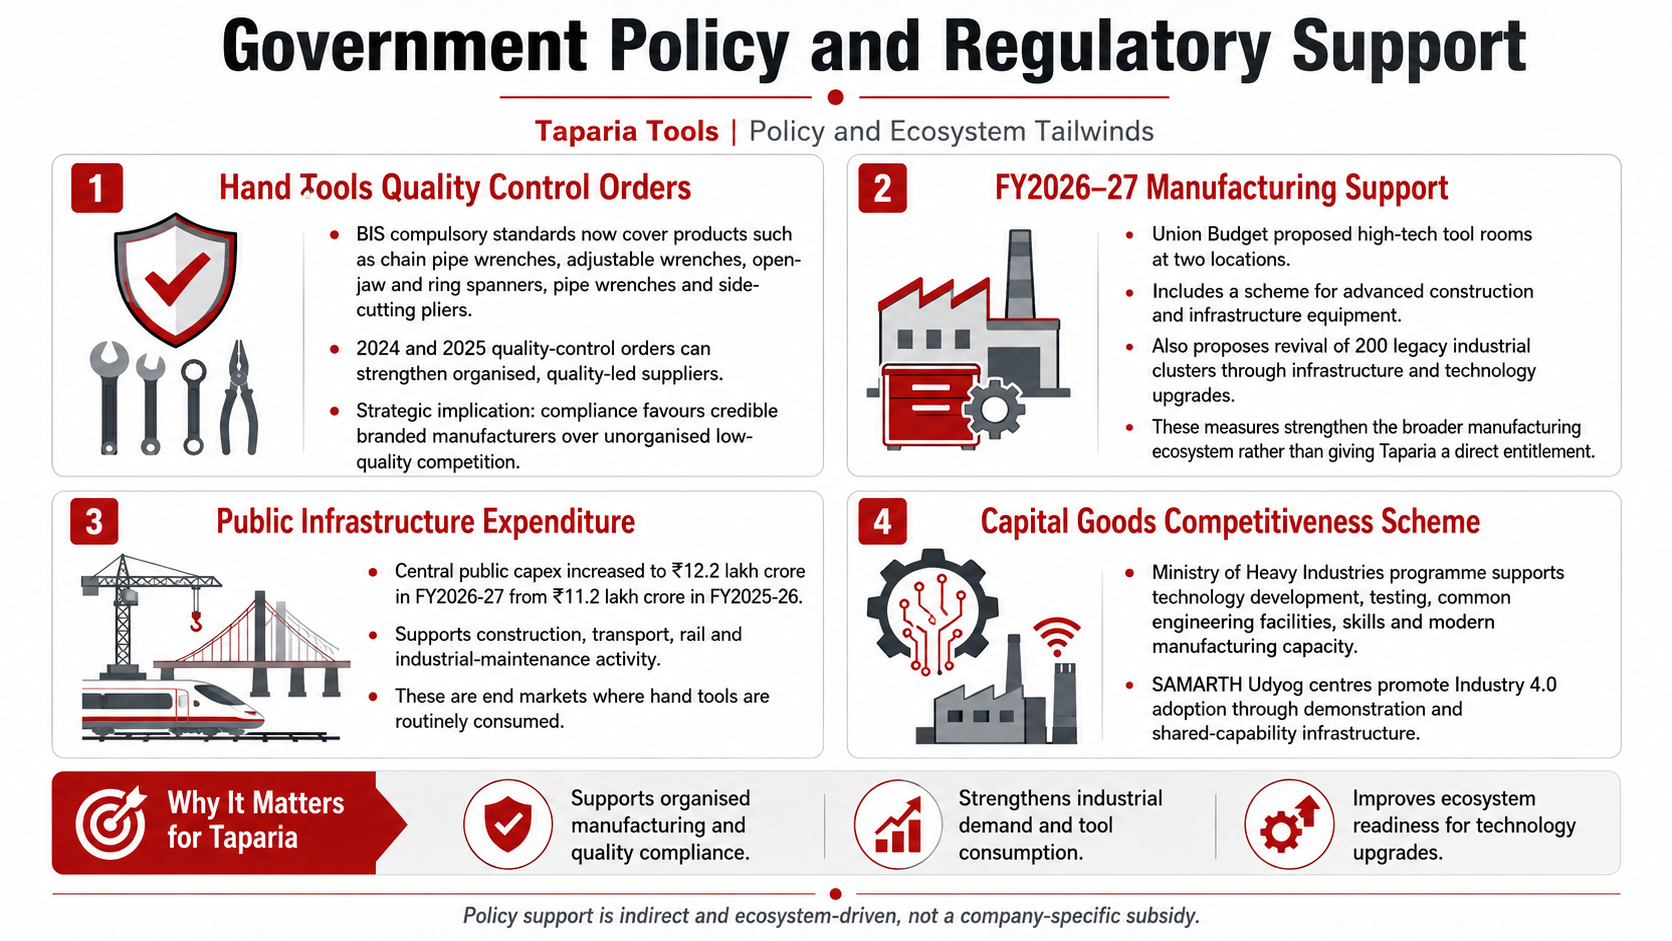
BIS lists compulsory standards for products including chain pipe wrenches, adjustable wrenches, open-jaw and ring spanners, pipe wrenches and side-cutting pliers under the Hand Tools Quality Control Orders of 2024 and 2025. Compliance can strengthen organised quality-led suppliers
The Union Budget proposed high-tech tool rooms at two locations, a scheme for advanced construction and infrastructure equipment and revival of 200 legacy industrial clusters through infrastructure and technology upgrades. These measures strengthen the broader manufacturing ecosystem rather than providing Taparia a direct entitlement
The FY2026-27 Union Budget increased central public capex to ₹12.2 lakh crore from ₹11.2 lakh crore in FY2025-26, supporting activity in construction, transport, rail and industrial maintenance where hand tools are routinely consumed
The Ministry of Heavy Industries' programme supports technology development, testing, common engineering facilities, skills and modern manufacturing capacity. SAMARTH Udyog centres promote Industry 4.0 adoption through demonstration and shared capability infrastructure
Fundraise/Future Plans
Shareholding
Pre-issue shareholding
Promoter Holding 0.0%
Category
Pre-Issue%
Promoters
0.0%
Total Promoter Holding
0.0%
Additional Shareholders
0.0%
Total Additional Holding
0.0%
Total Shareholding
0.0%
- Overview
- Business
- Financial Highlights
- Industry Overview
- Fundraise/Future Plans
- Documentation
Get the Preqt App and keep in touch around the clock!
 Monitor your investments in real-time.
- Receive tailored deal suggestions.
- Get real-time updates and alerts.
