


Tempsens Instruments (India)
Precision in TemperatureMeasuring Heat Precisely
IPO Summary (PrEqT)
Tempsens Instruments (India) Limited is an integrated thermal-engineering and specialised-cable manufacturer spanning temperature sensing, electrical heating and specialised cables. FY26 revenue from operations was INR 444.9 Cr, EBITDA INR 113.2 Cr and PAT INR 71.1 Cr, with FY24-FY26 CAGRs of 27.2%, 36.1% and 31.8%, respectively. The Company combines engineered Projects/OEM orders with recurring MRO replacement demand, operates 15 manufacturing units globally and generated 28.5% of FY26 operating revenue outside India. The IPO comprises a relatively small primary raise of up to INR 95 Cr and an OFS of up to INR 555 Cr; the investment lens is therefore driven more by operating quality, export scalability and valuation than by balance-sheet transformation.
IPO Review Rating
Above Avg
MainboardEnabling Process Excellence Through Reliable Thermal Measurement Solutions
Tempsens is one of the stronger underlying businesses in the current IPO set from a financial and business-quality perspective. The Company combines INR 444.9 Cr of FY26 revenue, INR 113.2 Cr of EBITDA, INR 71.1 Cr of PAT, a 24.8% EBITDA margin, 15.6% PAT margin, approximately 0.1x D/E and very low customer concentration. FY25 and FY26 contain the effects of Marathon Heater's amalgamation and subsequent acquisitions, so the headline 27.3% CAGR should not be treated as purely organic growth. Out of an approximately INR 650.0 Cr offer, only INR 95.0 Cr is Fresh Issue while INR 555.0 Cr is OFS. Only 14.6% of the issue therefore enters the Company. This is by far the biggest transaction-level negative, the key deciding variable from here is institutional demand.
PARAMETER
WEIGHT
SCORE
KEY FACTORS
Financial Performance
40.0%
4.0/5
Tempsens has a high-quality financial profile under the framework: strong topline growth, EBITDA margins near 25%, PAT margins above 15%, low leverage, positive cash generation and unusually low customer concentration.
Show more
Detailed Analysis
Revenue from operations increased from INR 274.8 Cr in FY24 to INR 378.5 Cr in FY25 and INR 444.9 Cr in FY26, representing a FY24–FY26 CAGR of approximately 27.2%
FY26 EBITDA stood at INR 113.2 Cr, translating into an EBITDA margin of 24.8%, compared with 25.4% in FY25 and 22.0% in FY24
FY26 PAT stood at INR 71.1 Cr, representing a PAT margin of 15.6%, versus 16.4% in FY25 and 14.7% in FY24
FY26 total borrowings were approximately INR 77.9 Cr against total equity of INR 525.5 Cr, implying D/E of approximately 0.1x
FY26 ROE stood at 13.5%, compared with 14.1% in FY25 and 20.0% in FY24
Operating cash flow was positive in both FY25 and FY26, at approximately INR 54.2 Cr and INR 42.0 Cr, respectively
Industry
15.0%
3.0/5
Tempsens participates in three structurally attractive industrial categories, with the fastest growth coming from specialised cables and advanced/non-contact sensing.
Show more
Detailed Analysis
Specialised cables and heating solutions gives an indicative blended industry-growth proxy of approximately 10.9%
Sensors are benefiting from industrial automation and smart manufacturing; specialised cables from infrastructure and safety upgrades; and electrical heating from industrial electrification and decarbonisation
Suppliers often face multi-year qualifications, product testing, field trials and PSU/OEM approvals; this supports incumbents but adds execution complexity
Tempsens exported to 80+ countries, with FY26 overseas revenue of approximately INR 125.8 Cr and FY24–FY26 export CAGR of 46.5%
Management
15.0%
4.0/5
Governance quality is above average: the promoters have deep operating experience, Board independence is 50.0%, RPT intensity is low and there is no meaningful promoter pledge issue.
Show more
Detailed Analysis
Virendra Prakash Rathi has been a Director since 1990, giving approximately 36 years of association with Tempsens
4 of 8 Directors are Independent Directors, representing exactly 50.0% of the Board
A criminal petition involving Virendra Prakash Rathi and Vinay Rathi is pending; no SEBI/stock-exchange disciplinary action or material civil proceeding against promoters is disclosed
The IPO contains INR 555.0 Cr of OFS, including substantial selling by members of the Promoter Group
Valuation
20.0%
4.0/5
Tempsens appears reasonably valued relative to relevant listed industrial proxies, with a 36.0x P/E and 22.7x EV/EBITDA compared with proxy averages of 45.8x and 30.1x
Show more
Detailed Analysis
IPO P/E is approximately 36.0x versus selected proxy average of 45.8x, representing a discount of approximately 21.4%
Tempsens' estimated EV/EBITDA is approximately 22.7x versus a selected-peer average of 30.1x, producing a peer/issuer ratio of approximately 1.3x
The cap price of INR 300.0 is approximately 4.9x FY26 NAV of INR 61.7 per share
FY26 RoNW stood at 13.5%
Merchant Banker Track Record
10.0%
4.0/5
The quality and reputation of the BRLMs are strong, the sample deliberately focuses on recent completed transactions, not their entire historical franchise.
Show more
Detailed Analysis
The two selected transactions generated an average listing gain of approximately 6.6%
Average subscription across the representative transactions was approximately 4.4x
2 of 2 produced positive listing openings, implying a 100.0% success rate in the sample
ICICI Securities and JM Financial are established mainboard merchant bankers with extensive IPO execution histories
TOTAL
100%
3.9/5
Weighted Composite Score
Issue Price
₹285.0 to ₹300.0
As of 29 Aug 2026
GMP
₹307.0
As of 29 Aug 2026
Estimated Gain / Loss
+102.3%
Lot Size
50.0 Shares
Grey Market Premium (GMPs) are shared for knowledge purpose only. PrEqt doesn’t promote or execute the trades.
| Issue size | |
|---|---|
| Overall | ₹650.0 Cr |
| Fresh Issue | ₹95.0 Cr |
| Offer for Sale | ₹555.0 Cr |
Minimum Investment
₹15,000.0 / 2,500 shares

Merchant Banker
ICICI Securities Ltd.; JM Financial
IPO Document
RHP / Anchor Document
Offer Start Date
20th Aug 2026
Offer End Date
24th Aug 2026
Valuation
₹2,515.0 Cr
Revenue (FY'26)
₹455.9 Cr
PAT (FY'26)
₹36.0 Cr
Issue Size
₹650.0 Cr
Face Value
₹ 4.0Offer Price
₹ 300.0Lot Size
50.0 sharesSale Type
Fresh capital cum OFSPAT (FY'26)
₹ 36.0 CrPAT Margin (FY'26)
15.6 %P/E Multiple
45.8xEBITDA (FY'26)
₹ 113.2 CrCAGR Growth 2Y
28.0 %ROE (FY'26)
13.5 %ROCE (FY'26)
21.6 %Price to Book Value
4.9xDebt/Equity
0.1xCompany Website
www.tempsens.comExplore new deals
Overview
Fund Allocation
Total: ₹0 CrSource:Company DRHP
Timeline
IPO Open Date
To Be Announced
IPO Close Date
To Be Announced
Tentative Allotment
To Be Announced
Initiation of Refunds
To Be Announced
Credit of Shares to Demat
To Be Announced
Tentative Listing Date
To Be Announced
Business
Products
Business Model
Geographical Presence
Sales Channel
Key Risk Factor
Financial Highlights
Income Statement
Revenue growth with EBITDA and PAT margins
| Financial Metric | FY 2024 | FY 2025 | FY 2026 |
|---|---|---|---|
| Revenue (₹ Cr) | 278.0 | 382.5 | 455.9 |
| Growth (%) | 16.0% | 37.7% | 17.5% |
| EBITDA (₹ Cr) | 61.1 | 97.3 | 113.2 |
| EBITDA Margin (%) | 22.0% | 25.4% | 24.8% |
| PAT (₹ Cr) | 40.9 | 62.6 | 71.1 |
| PAT Margin (%) | 14.7% | 16.4% | 15.6% |
OBSERVATIONS & INSIGHTS
Revenue grew 17.5%; electrical heating increased 44.9%, temperature sensing 12.7% and specialised cables 11.1%, with demand from metals, petrochemicals, power and defence
EBITDA margin improved from 20.8% in FY23 to 25.5% in FY25 before moderating to 24.8% in FY26; PAT margin followed a similar pattern at 15.6% in FY26
Balance Sheet
| Financial Metric | FY 2024 | FY 2025 | FY 2026 |
|---|---|---|---|
| Net Worth | ₹ 204.8 Cr | ₹ 441.7 Cr | ₹ 525.5 Cr |
| Total Assets | ₹ 271.1 Cr | ₹ 551.3 Cr | ₹ 661.1 Cr |
| Total Borrowing | ₹ 30.1 Cr | ₹ 71.8 Cr | ₹ 78.0 Cr |
| Reserves & Surplus | ₹ 203.0 Cr | ₹ 427.3 Cr | ₹ 465.2 Cr |
OBSERVATIONS & INSIGHTS
Total assets rose from INR 271.1 Cr in FY24 to INR 661.1 Cr in FY26, reflecting acquisitions, goodwill/intangibles, higher inventory/receivables and financial assets
Total equity increased to INR 525.5 Cr in FY26 versus INR 204.8 Cr in FY24 as it funded most of the expansion
Current borrowings were INR 70.3 Cr in FY26 versus INR 7.6 Cr non-current, which makes the planned INR 55.0 Cr IPO debt repayment relevant to liquidity and finance cost
Cash Flow
| Financial Metric | FY 2023 | FY 2024 | FY 2025 |
|---|---|---|---|
CFO (₹ Cr) Cash generated from core business operations. | +37.1 Cr | +54.2 Cr | +42 Cr |
CFI (₹ Cr) Cash used for investments and long-term assets. | -26.9 Cr | -93.5 Cr | -26.2 Cr |
CFF (₹ Cr) Cash flow related to funding and borrowings. | +2.1 Cr | +36.2 Cr | -6.3 Cr |
Working Capital
| Efficiency Metric | FY 2023 | FY 2024 | FY 2025 |
|---|---|---|---|
Debtor Days Average number of days taken to collect customer payments. | - | - | - |
Creditor Days Average time taken to pay suppliers and vendors. | - | - | - |
Inventory Days Average number of days inventory remains unsold. | - | - | - |
CCC (Cash Conversion Cycle) (Debtor Days + Inventory Days - Creditor Days) | - | - | - |
Financial Ratios
Measures the company’s leverage relative to shareholder equity.
OBSERVATIONS & INSIGHTS
ROE declined from 20.0% in FY24 to 13.5% in FY26 and ROA from 16.9% to 11.7%, reflecting acquisitions, goodwill/intangibles and a larger working-capital base
ROCE remained healthy: 21.6% in FY26 versus 22.8%-23.1% in FY24-FY25, indicating that operating returns remained above the Company’s modest borrowing cost despite balance-sheet expansion
Debt/Equity stayed near 0.1x-0.2x
Interest coverage remained very high, although it fell to 19.0x in FY26 as finance cost increased after group expansion
Current ratio stayed near 2.5x across all three years
Industry Overview
Industry Drivers
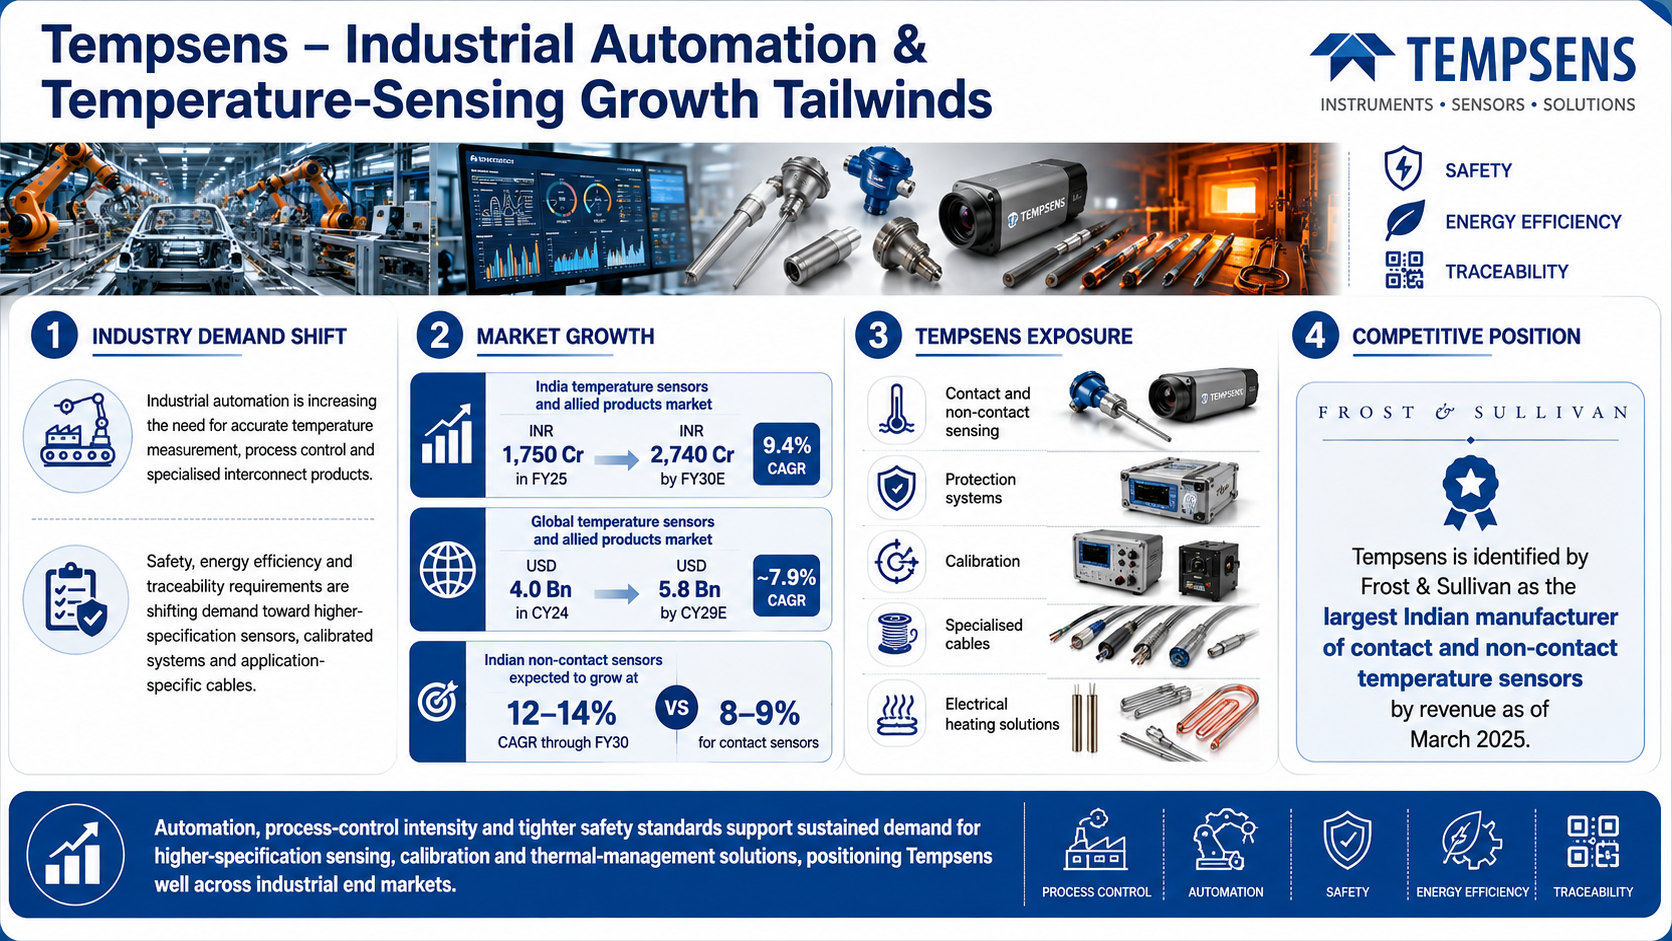
Industry Tailwind: Industrial automation, precision monitoring and electrification
Industrial automation is increasing the requirement for accurate temperature measurement, process control and specialised interconnect products. At the same time, safety, energy-efficiency and traceability requirements are moving industrial customers toward higher-specification sensors, calibrated systems and application-specific cables. Tempsens is directly exposed through contact/non-contact sensing, protection systems, calibration, specialised cables and electrical heating solutions.
The key tailwinds are:
India temperature sensors and allied products market is estimated at INR 1,750 Cr in FY25 and projected to reach INR 2,740 Cr by FY30E, a 9.4% CAGR
Global temperature sensors and allied products market is projected to rise from USD 4.0 Bn in CY24 to USD 5.8 Bn by CY29E, approximately 7.9% CAGR
Indian non-contact sensors are expected to grow at 12-14% CAGR through FY30 versus 8-9% for contact sensors, supported by EV, semiconductor, glass and cleanroom applications
Specialised cables benefit from industrial capex, infrastructure and safety regulation
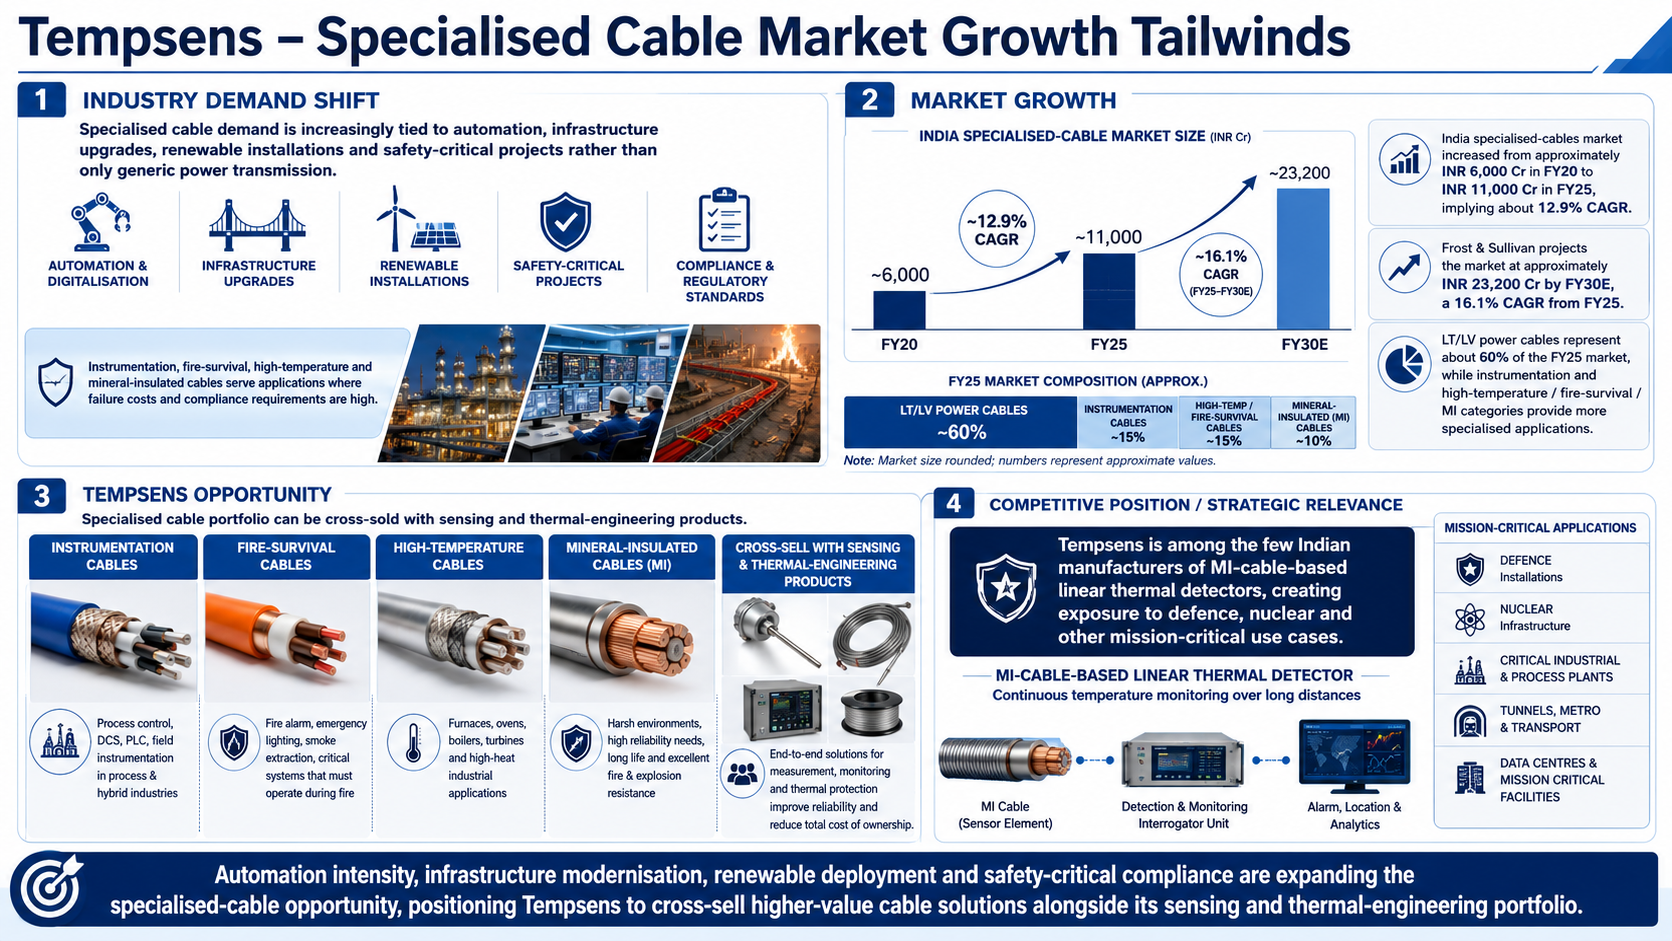
Specialised cable demand is increasingly tied to automation, infrastructure upgrades, renewable installations and safety-critical projects rather than only generic power transmission. Instrumentation, fire-survival, high-temperature and mineral-insulated cables address applications where failure costs and compliance requirements are high. This supports a differentiated opportunity for Tempsens because its cable portfolio can be cross-sold with sensing and thermal-engineering products.
The key details are:
India specialised-cables market increased from approximately INR 6,000 Cr in FY20 to INR 11,000 Cr in FY25, implying about 12.9% CAGR
Frost & Sullivan projects the market at approximately INR 23,200 Cr by FY30E, a 16.1% CAGR from FY25
LT/LV power cables represent about 60% of the FY25 market, while instrumentation and high-temperature/fire-survival/MI categories provide more specialised applications
Tempsens is among the few Indian manufacturers of MI-cable-based linear thermal detectors, creating exposure to defence, nuclear and other mission-critical use cases
Core-sector and energy-transition capex expands thermal-engineering demand
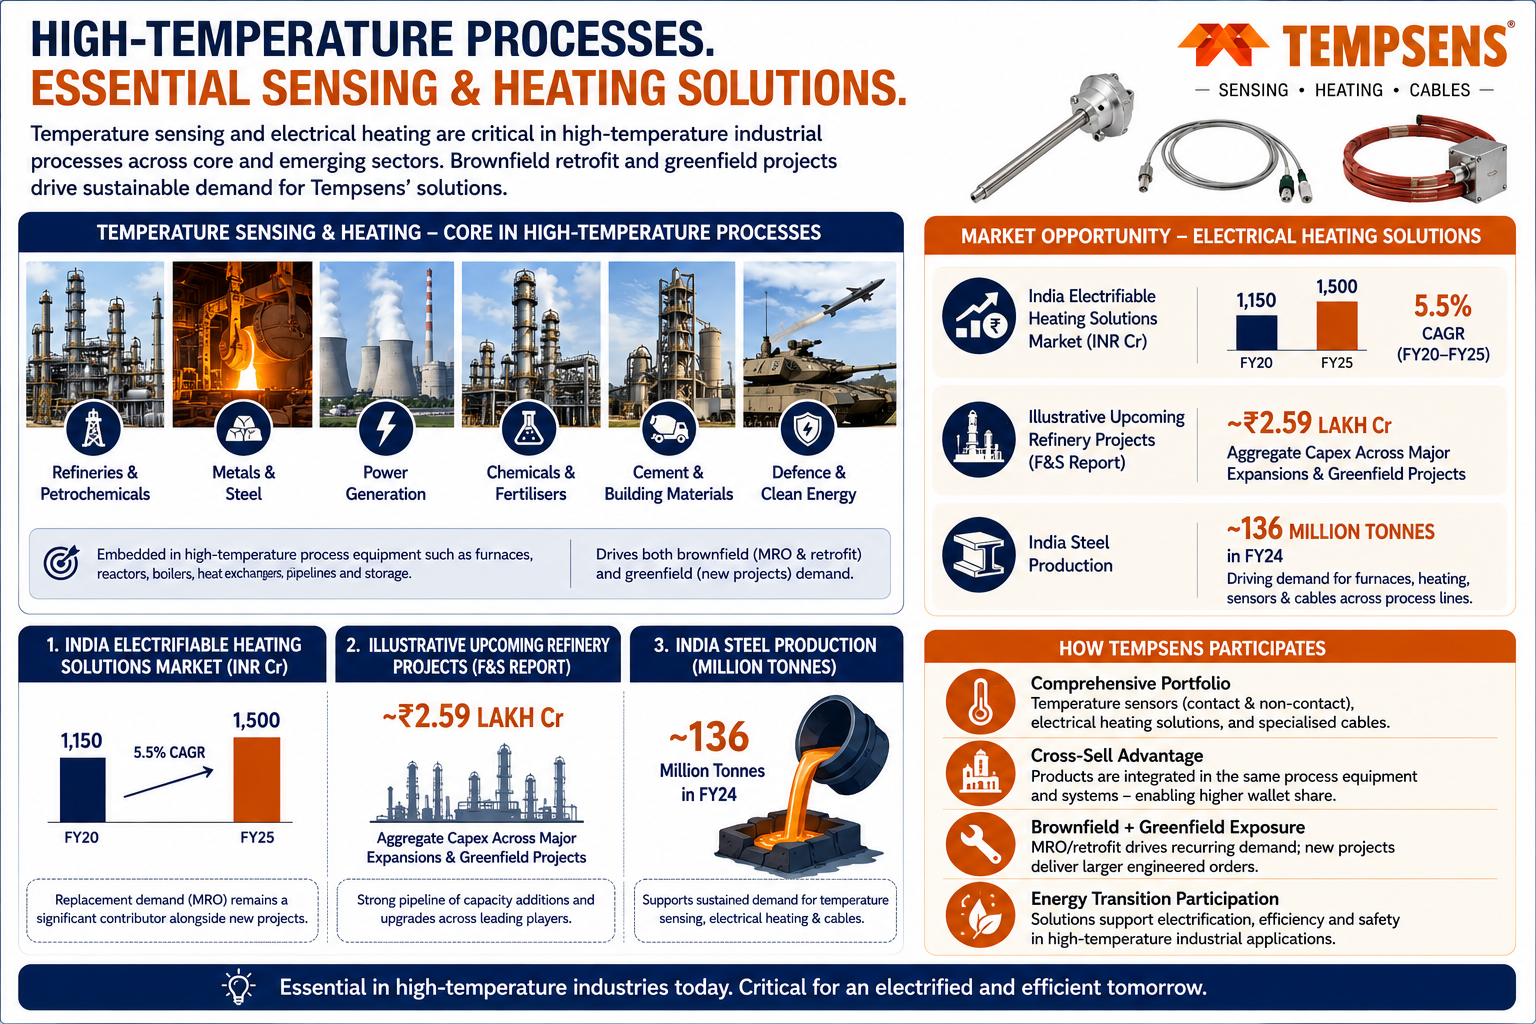
Temperature sensing and electrical heating are embedded in high-temperature process equipment across refineries, petrochemicals, metals, power, chemicals, cement, defence and emerging clean-energy applications. Brownfield modernisation generates MRO and retrofit demand, while new projects create larger engineered orders. Tempsens therefore participates in both conventional industrial expansion and the gradual electrification of heat-intensive processes.
The key details are:
India electrifiable heating solutions market increased from about INR 1,150 Cr in FY20 to INR 1,500 Cr in FY25, a 5.5% CAGR, with replacement demand remaining important
Illustrative upcoming refinery projects in the F&S; report aggregate about INR 2.59 lakh Cr of capex across major expansions and greenfield projects
India steel production reached about 136 million tonnes in FY24, supporting furnace, heating, sensor and cable requirements across process lines
Risks in the Industry
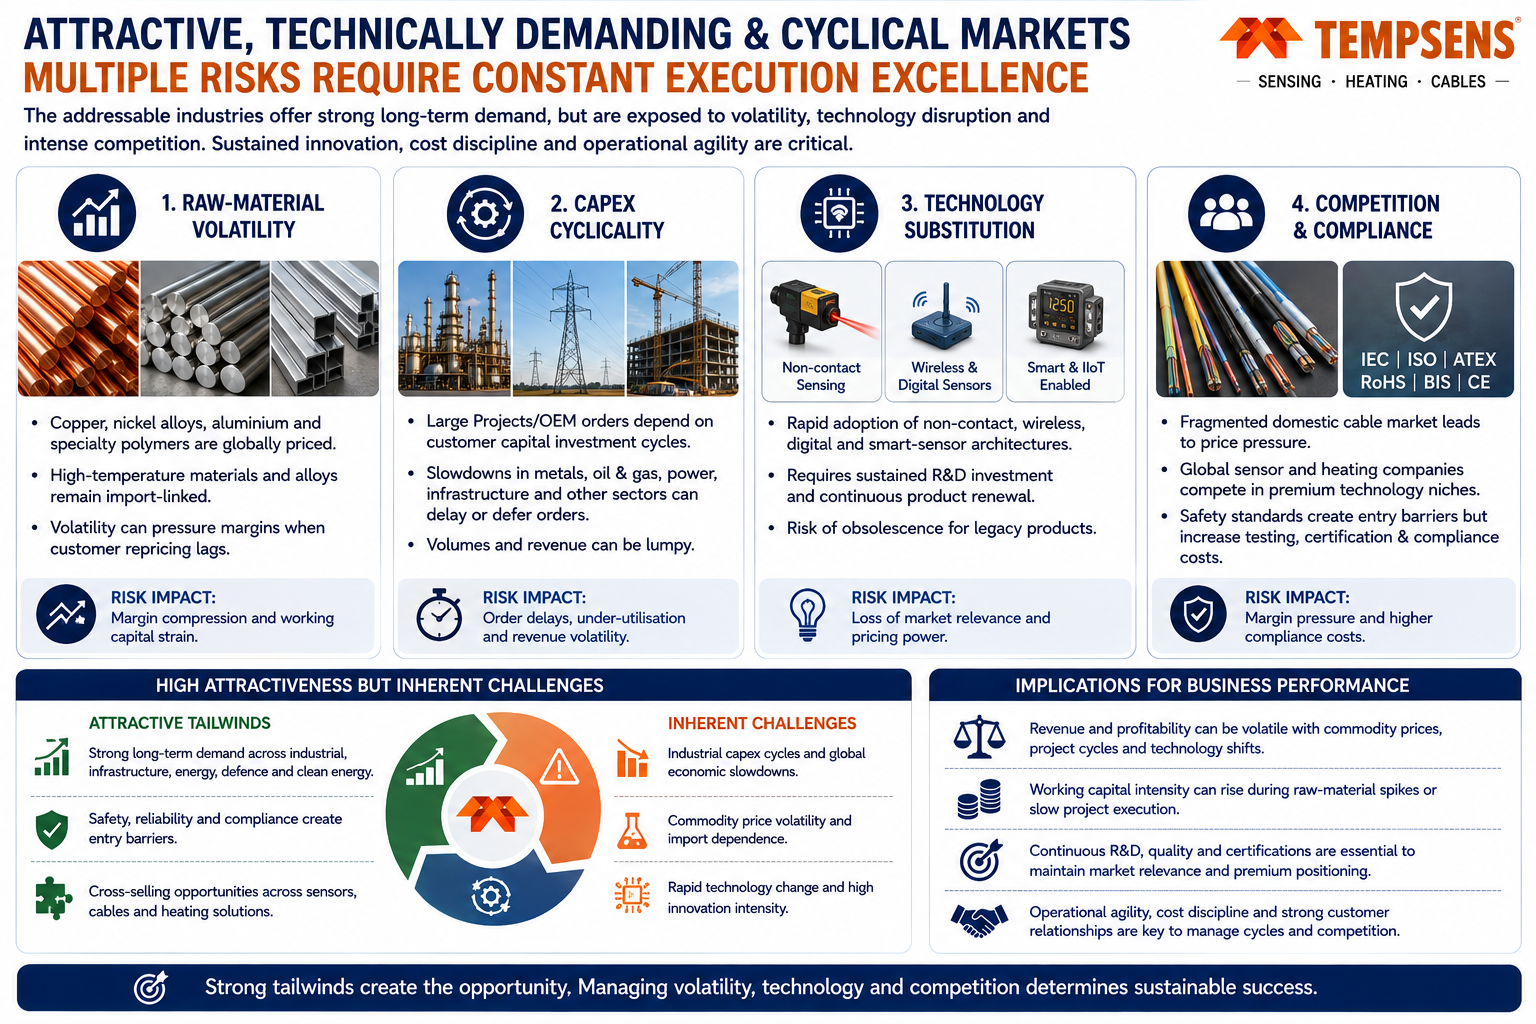
The addressable industries are attractive but technically demanding and exposed to industrial capex cycles, commodity costs and rapid technology change. Sensors, specialised cables and heating products compete on qualification, reliability, customisation and price; failure to keep pace with digital/non-contact sensing or energy-efficient heating can compress market relevance. Safety standards create entry barriers but also increase testing and certification costs, while raw-material volatility can pressure margins when customer repricing lags.
The key risks are:
Copper, nickel alloys, aluminium and specialty polymers are globally priced and several high-temperature inputs remain import-linked
Large Projects/OEM orders can be delayed by slowdowns in metals, oil & gas, power, infrastructure or other customer investment programmes
Faster adoption of non-contact, wireless, digital and smart-sensor architectures requires sustained R&D; and product renewal
Fragmented domestic cable markets create price pressure, while global sensor/heating companies compete aggressively in premium technology niches
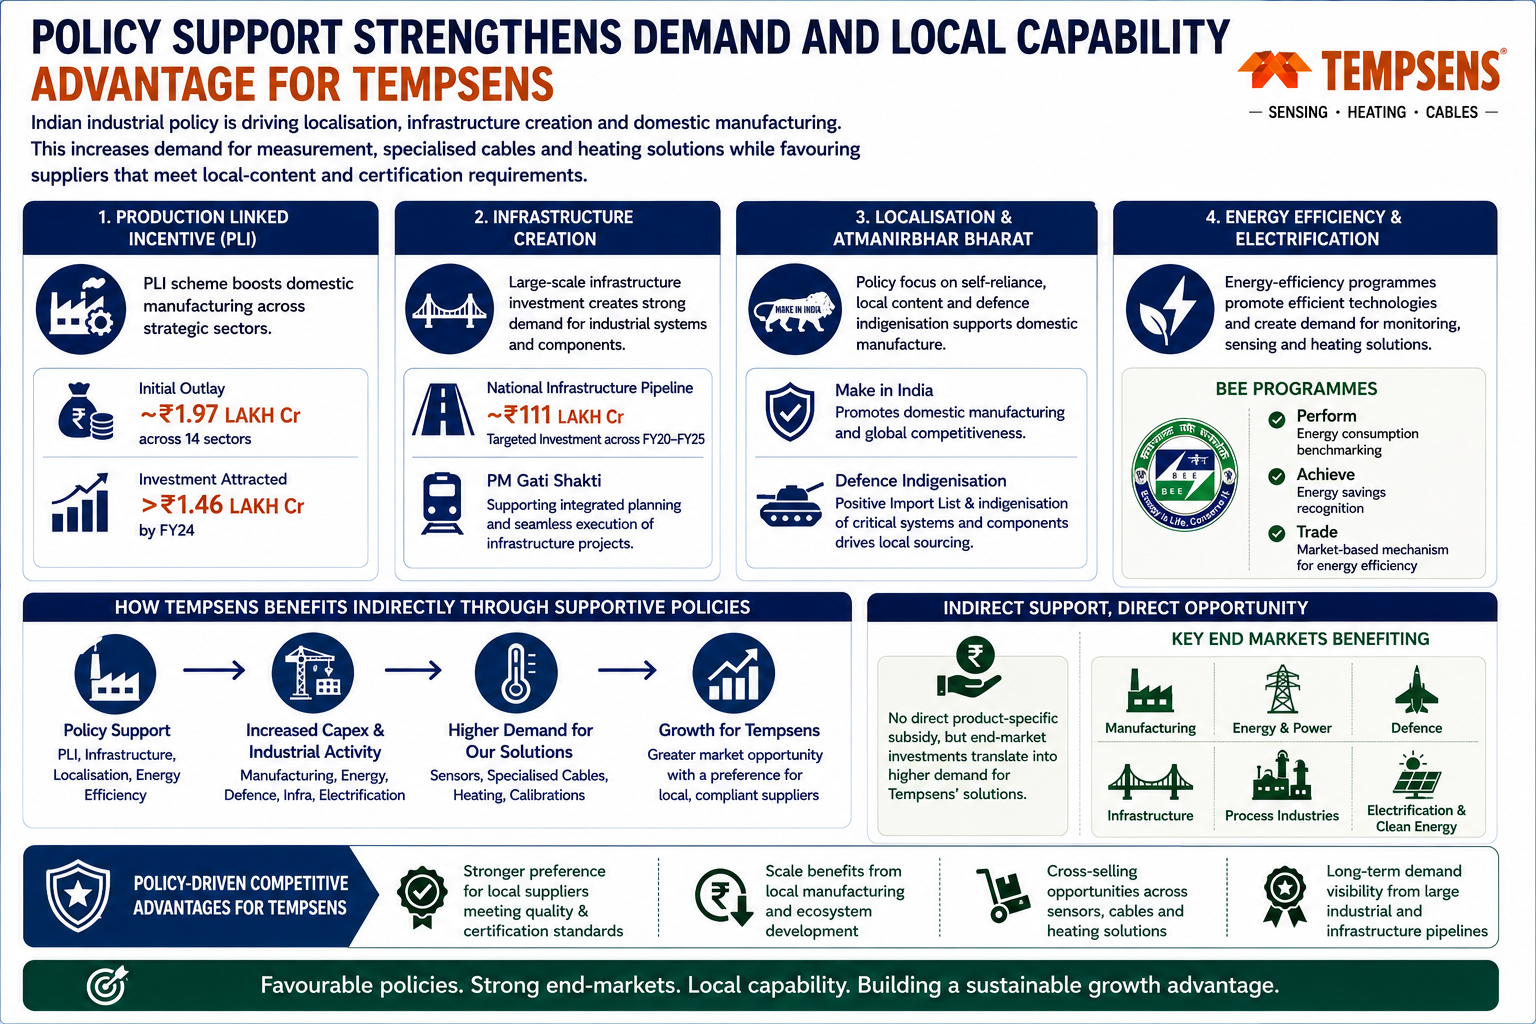
Government Policy Support
Indian industrial policy is broadly supportive of localisation, infrastructure creation and domestic manufacturing, which raises demand for measurement, specialised cables and heating solutions while also favouring suppliers capable of meeting local-content and certification requirements. The support is indirect rather than a single product-specific subsidy: Tempsens benefits through end-market capex in manufacturing, energy, defence, infrastructure and electrification.
The key policies are:
The PLI programme was launched with an initial outlay of approximately INR 1.97 lakh Cr across 14 sectors; by FY24 it had attracted more than INR 1.46 lakh Cr of investment
National Infrastructure Pipeline targeted approximately INR 111 lakh Cr of investment across FY20-FY25, while PM Gati Shakti supports integrated infrastructure buildout
Make in India, Atmanirbhar Bharat and Defence Indigenisation policies support domestic manufacture of critical industrial systems and components
BEE programmes such as Perform, Achieve and Trade encourage energy-efficient technologies in energy-intensive sectors, supporting electrification and monitoring demand
Fundraise/Future Plans
Shareholding
Pre-issue shareholding
Promoter Holding 0.0%
Post-Issue Shareholding
Promoter Holding 0.0%
Category
Pre-Issue%Post-Issue%
Promoters
Vinay Rathi
30.0%28.9%
Virendra Prakash Rathi
15.5%14.9%
Pratap Singh Talesara
0.6%0.6%
Rathi Family Trust
9.5%9.1%
Amit Talesara
8.5%2.4%
Chandra Prakash Talesara
8.5%3.6%
Puneet Talesara
7.9%6.0%
Total Promoter Holding
80.5%65.5%
Additional Shareholders
0.0%0.0%
Total Additional Holding
0.0%0.0%
Total Shareholding
80.5%65.5%
- Overview
- Business
- Financial Highlights
- Industry Overview
- Fundraise/Future Plans
- Documentation
Get the Preqt App and keep in touch around the clock!
 Monitor your investments in real-time.
- Receive tailored deal suggestions.
- Get real-time updates and alerts.
