


Transline Technologies Ltd.
AI Securing Every SpaceIntelligence Behind Security
IPO Review and Rating
Watchlist
DRHP approvedOverall Recommendation
Revenue has increased from INR 114.0 Cr in FY23 to INR 488.5 Cr in FY26, representing a 62.4% CAGR, while PAT increased from INR 9.9 Cr to INR 70.3 Cr, representing a 92.3% CAGR. EBITDA margin is above 22.0%, ROE remains above 30.0%, D/E is only around 0.4x, and the FY26 statutory audit is clean. The business positioning is also attractive. Transline has evolved from conventional IT infrastructure and biometrics into integrated surveillance, AI-enabled analytics, digital security and large government/enterprise technology deployments. Indian spending on IT, cloud, cybersecurity and AI infrastructure provides a credible structural growth runway
PARAMETER
WEIGHT
SCORE
KEY FACTORS
Financial Performance
25.0%
4.2/5
Exceptional growth, margins, ROE and manageable leverage
Show more
Detailed Analysis
FY26 revenue grew 31.6% to INR 488.5 Cr, while FY23-FY26 CAGR was an exceptional 62.4%
EBITDA reached INR 109.2 Cr and margin improved from 21.4% to 22.4%, indicating strong project economics
PAT increased 45.4% to INR 70.3 Cr, while PAT margin expanded from 13.0% to 14.4%
Gross borrowing rose to INR 110.7 Cr, but equity also increased to INR 249.1 Cr, resulting in comfortable D/E of 0.4x
FY26 ROE on average equity was approximately 32.9%, demonstrating excellent capital efficiency
Industry
25.0%
3.7/5
Transline operates in attractive structural markets across AI, surveillance, IT infrastructure and security, but faces intense competition and high government-procurement dependence
Show more
Detailed Analysis
India IT spending is forecast to grow 10.6% in 2026, while software and cloud infrastructure are growing substantially faster
AI-enabled surveillance, digital infrastructure, cloud and security remain in structural adoption phases across government and enterprise customers
Systems integration and IT infrastructure remain highly competitive, with large domestic and global players competing for enterprise and government contracts
Government digitalisation, public-security spending and IndiaAI support demand, although tender and procurement dependence create execution risk
The technology is globally applicable, but Transline currently has very limited demonstrated international revenue
Management
25.0%
3.1/5
Long promoter operating history, majority-independent board representation and clean FY26 audit opinions are meaningful strengths
Show more
Detailed Analysis
Founder Arun Gupta has led Transline since 2001, providing approximately 25.0 years of operating experience across IT, biometrics and security technology
Four of the seven current directors are independent, representing approximately 57.1% of the Board
FY26 statutory audit and internal-control opinions are unmodified; no material adverse audit issue is disclosed
Related-party transactions exist, including sales, purchases and financing, but FY26 outstanding related-party borrowings declined materially
Valuation Metrics
25.0%
2.8/5
The FY26 earnings multiple is reasonable relative to growth and peers, but high P/B and weak historical cash conversion limit the margin of safety
Show more
Detailed Analysis
FY26 P/E of 20.1x is reasonable for the Company's growth profile and below the peer median
EV/EBITDA of 13.9x is below Orient and Nelco but above Allied Digital, giving a moderately attractive relative valuation
P/B of 5.7x is relatively rich and requires continued ROE above 25.0%-30.0% to remain justified
TOTAL
100%
3.5/5
Weighted Composite Score
Per Share Price
₹150.0
As of 24 Oct 2026
Lot Size
50.0 Shares
Minimum Investment
₹7,500.0 / 50 shares
Market Cap. (₹ Cr)
Revenue FY’26
PAT FY’26
P/E Multiple
Face Value
₹ 2.0Lot Size
50.0 sharesPAT FY’26
₹ 70.3 CrPAT Margin (%)
14.4 %P/E Multiple
21.4xCAGR Growth 3Y
62.4 %ROE (FY’26)
32.9 %ROCE (FY’26)
33.2 %Price to Book Value ratio
6.0xDebt/Equity (FY’26)
0.4xMerchant banker appointed
✅ YesCompany Website
translineindia.comDisclaimer: Unlisted shares are unregulated & illiquid. This is NOT investment advice. Please do your own due diligence before investing.
Minimum Investment
₹7,500.0 / 50 sharesShares Lot 50 X 1
Investment amount
₹7,500.0
Overview
Business
Business Model
Geographical Presence
Sales Channel
Financial Highlights
Income Statement
Revenue growth with EBITDA and PAT margins
| Financial Metric | FY 2024 | FY 2025 | FY 2026 |
|---|---|---|---|
| Revenue (₹ Cr) | 225.9 | 371.1 | 488.5 |
| Growth (%) | 98.2% | 64.3% | 31.6% |
| EBITDA (₹ Cr) | 51.8 | 78.5 | 107.9 |
| EBITDA Margin (%) | 22.9% | 21.2% | 22.1% |
| PAT (₹ Cr) | 35.5 | 48.3 | 70.3 |
| PAT Margin (%) | 0.0% | - | - |
OBSERVATIONS & INSIGHTS
Revenue increased from INR 225.9 Cr in FY24 to INR 371.1 Cr in FY25 and INR 488.5 Cr in FY26. FY24-FY26 CAGR was about 47.0%, while FY26 growth remained strong at 31.6% despite the larger base
Analytical EBITDA rose from INR 51.8 Cr in FY24 to INR 78.5 Cr in FY25 and INR 107.9 Cr in FY26. Margin dipped from 22.9% to 21.2% in FY25 before recovering to 22.1% in FY26, indicating improved cost absorption
PAT increased from INR 35.5 Cr in FY24 to INR 48.3 Cr in FY25 and INR 70.3 Cr in FY26. PAT margin moved from 15.7% to 13.0% and then recovered to 14.4%
Finance cost increased from INR 2.9 Cr in FY24 to INR 7.1 Cr in FY25 and INR 11.0 Cr in FY26 as working-capital borrowings expanded. The P&L still supports strong coverage, but the direction is important because continued growth requires substantial balance-sheet funding
Balance Sheet
| Financial Metric | FY 2024 | FY 2025 | FY 2026 |
|---|---|---|---|
| EQUITY & LIABILITIES | ₹ 219.5 Cr | ₹ 397.4 Cr | ₹ 548.1 Cr |
| Net Worth | ₹ 83.7 Cr | ₹ 178.5 Cr | ₹ 249.1 Cr |
| Share Capital | ₹ 16.2 Cr | ₹ 17.9 Cr | ₹ 17.9 Cr |
| Reserves & Surplus | ₹ 67.5 Cr | ₹ 160.6 Cr | ₹ 231.2 Cr |
| Total Liabilities | ₹ 135.8 Cr | ₹ 218.9 Cr | ₹ 299.0 Cr |
| Current Liabilities | ₹ 123.6 Cr | ₹ 209.9 Cr | ₹ 289.3 Cr |
| Borrowings | ₹ 32.1 Cr | ₹ 79.8 Cr | ₹ 103.7 Cr |
| Trade Payables | ₹ 70.9 Cr | ₹ 109.2 Cr | ₹ 152.9 Cr |
| Other Current Liabilities | ₹ 20.6 Cr | ₹ 20.9 Cr | ₹ 32.7 Cr |
| Non-Current Liabilities | ₹ 12.2 Cr | ₹ 9.0 Cr | ₹ 9.7 Cr |
| Borrowings | ₹ 9.3 Cr | ₹ 6.3 Cr | ₹ 7.0 Cr |
| Other Non-Current Liabilities | ₹ 2.9 Cr | ₹ 2.7 Cr | ₹ 2.7 Cr |
| ASSETS | ₹ 219.5 Cr | ₹ 397.5 Cr | ₹ 548.0 Cr |
| Current Assets | ₹ 198.3 Cr | ₹ 377.8 Cr | ₹ 523.4 Cr |
| Trade Receivables | ₹ 138.9 Cr | ₹ 189.6 Cr | ₹ 218.1 Cr |
| Inventory | ₹ 9.0 Cr | ₹ 29.7 Cr | ₹ 66.5 Cr |
| Cash & Cash Equivalents | ₹ 2.3 Cr | ₹ 0.1 Cr | ₹ 0.1 Cr |
| Other Current Assets | ₹ 48.1 Cr | ₹ 158.4 Cr | ₹ 238.7 Cr |
| Non-Current Assets | ₹ 21.2 Cr | ₹ 19.7 Cr | ₹ 24.6 Cr |
| Fixed Assets | ₹ 15.8 Cr | ₹ 16.8 Cr | ₹ 19.2 Cr |
| Other Non-Current Assets | ₹ 5.4 Cr | ₹ 2.9 Cr | ₹ 5.4 Cr |
OBSERVATIONS & INSIGHTS
Shareholders' wealth increased from INR 83.7 Cr in FY24 to INR 178.6 Cr in FY25 and INR 249.1 Cr in FY26, the larger equity base provides balance-sheet support
Total borrowings increased from about INR 41.4 Cr in FY24 to INR 86.1 Cr in FY25 and INR 110.7 Cr in FY26. Most debt is current / working-capital borrowing, consistent with the heavy receivable
Current assets increased from INR 198.3 Cr to INR 523.5 Cr between FY24 and FY26. Trade receivables reached INR 218.1 Cr, inventory INR 66.5 Cr and the broad “other current assets” bucket about INR 238.7 Cr
Closing cash and cash equivalents were about INR 2.3 Cr in FY24, INR 0.1 Cr in FY25 and INR 0.1 Cr in FY26. The Company therefore relies on collections, bank balances outside cash equivalents and credit facilities rather than a large unrestricted cash buffer
Cash Flow
| Financial Metric | FY 2024 | FY 2025 | FY 2026 |
|---|---|---|---|
CFO (₹ Cr) Cash generated from core business operations. | -37.6 Cr | -79.9 Cr | -7.2 Cr |
CFI (₹ Cr) Cash used for investments and long-term assets. | -9.8 Cr | -6 Cr | -5.8 Cr |
CFF (₹ Cr) Cash flow related to funding and borrowings. | +49.6 Cr | +83.8 Cr | +13.1 Cr |
Working Capital
| Efficiency Metric | FY 2023 | FY 2024 | FY 2025 |
|---|---|---|---|
Debtor Days Average number of days taken to collect customer payments. | - | - | - |
Creditor Days Average time taken to pay suppliers and vendors. | - | - | - |
Inventory Days Average number of days inventory remains unsold. | - | - | - |
CCC (Cash Conversion Cycle) (Debtor Days + Inventory Days - Creditor Days) | - | - | - |
Financial Ratios
Measures the company’s leverage relative to shareholder equity.
OBSERVATIONS & INSIGHTS
ROE declined from a very high 62.4% in FY24 to 36.9% in FY25 and 32.9% in FY26. PAT continued to rise, but the average equity base expanded much faster through retained earnings and equity issuance
ROCE moderated from 61.6% in FY24 to 38.4% in FY25 and 33.2% in FY26 as both equity and borrowings increased, returns remain strong in absolute terms
ROA declined from 23.2% in FY24 to 15.7% in FY25 and 14.9% in FY26. Total assets increased from ₹219.5 Cr to ₹548.1 Cr in two years, substantially faster than profit
Debt / equity improved modestly from 0.5x in FY24-FY25 to 0.4x in FY26 because net worth expanded faster than borrowings
Current ratio improved from 1.6x in FY24 to 1.8x in FY25 and remained about 1.8x in FY26. Headline short-term liquidity is adequate, but asset quality matters because a large share of current assets consists of receivables, contract assets, inventory and other financial assets rather than cash
Industry Overview
Industry Drivers
Public Safety, Safe Cities and Command-Centre Modernisation
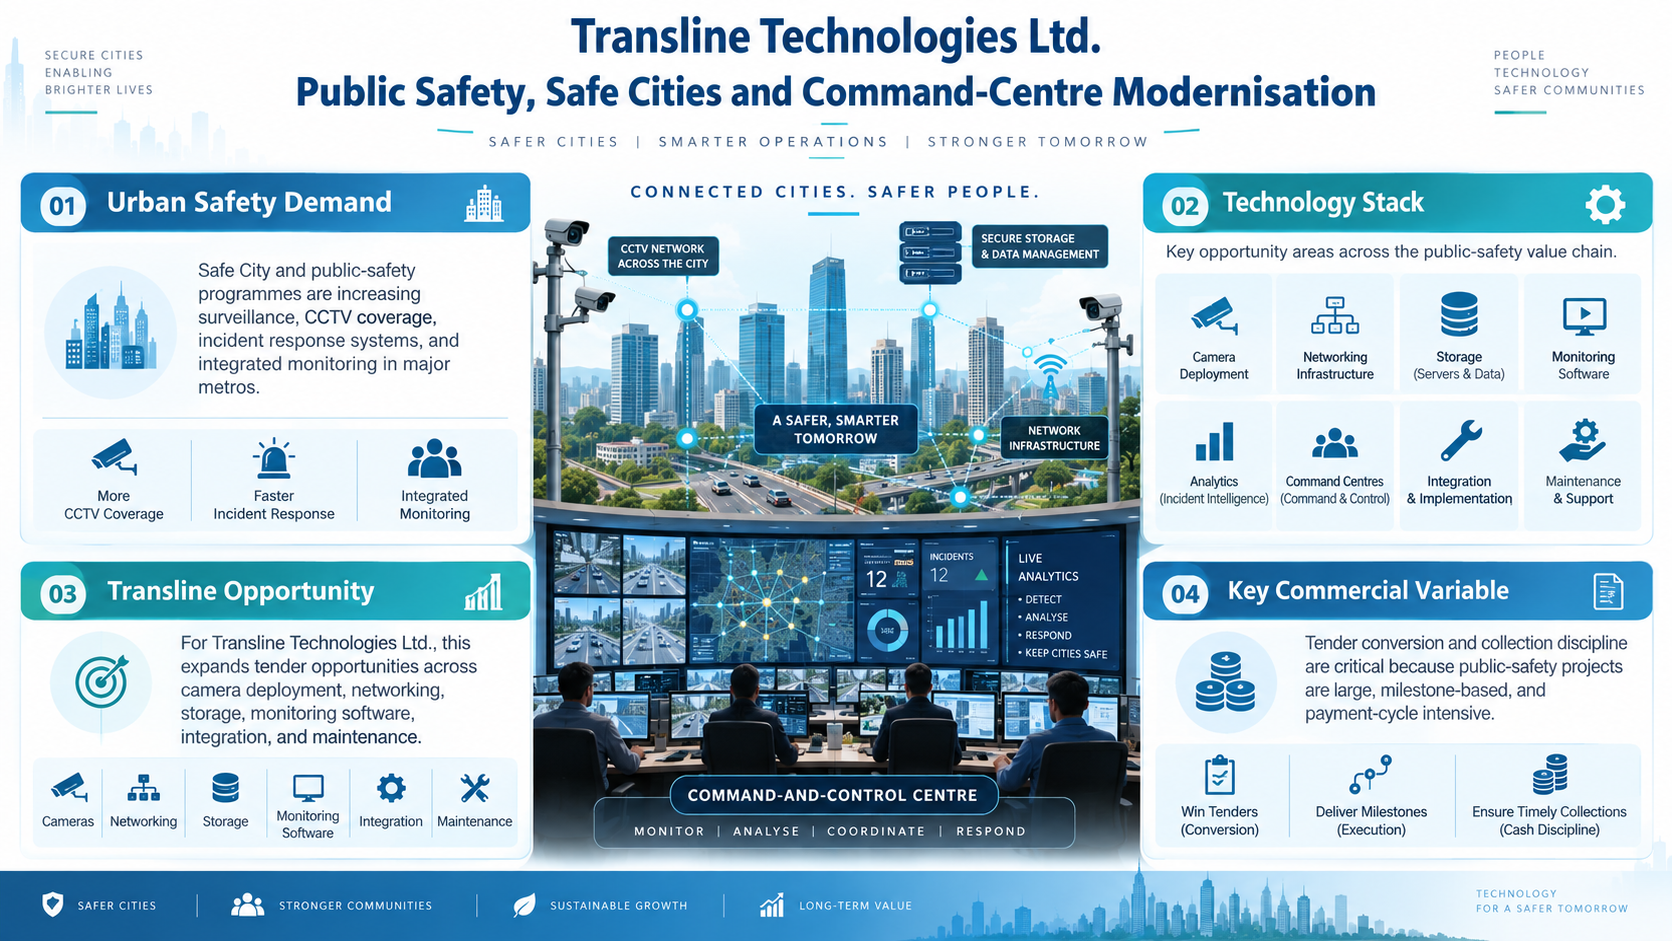
Urban policing and public-safety programs increasingly use dense camera networks, command-and-control centres, incident analytics and integrated response platforms
India's Safe City program has funded technology-led surveillance in major metros and explicitly includes CCTV coverage linked to command centres
For Transline, this expands tender opportunities across camera deployment, networking, storage, monitoring software, integration and maintenance
The key commercial variable is tender conversion and collection discipline, because public safety projects can be large, milestone-based and payment-cycle intensive
AI Video Analytics and Edge Intelligence
The security market is shifting from passive recording toward automated interpretation
AI can support anomaly detection, footfall analytics, facial / object recognition, queue monitoring, loss prevention and health monitoring of camera networks
This shift favours integrators that own software intellectual property rather than merely resell cameras
Products such as StorePulse and CheckCam give Transline a route to higher software content, but sustained R&D, model accuracy, data governance and integration with heterogeneous camera estates remain necessary to defend margins

Biometrics, Identity Authentication and Access Control
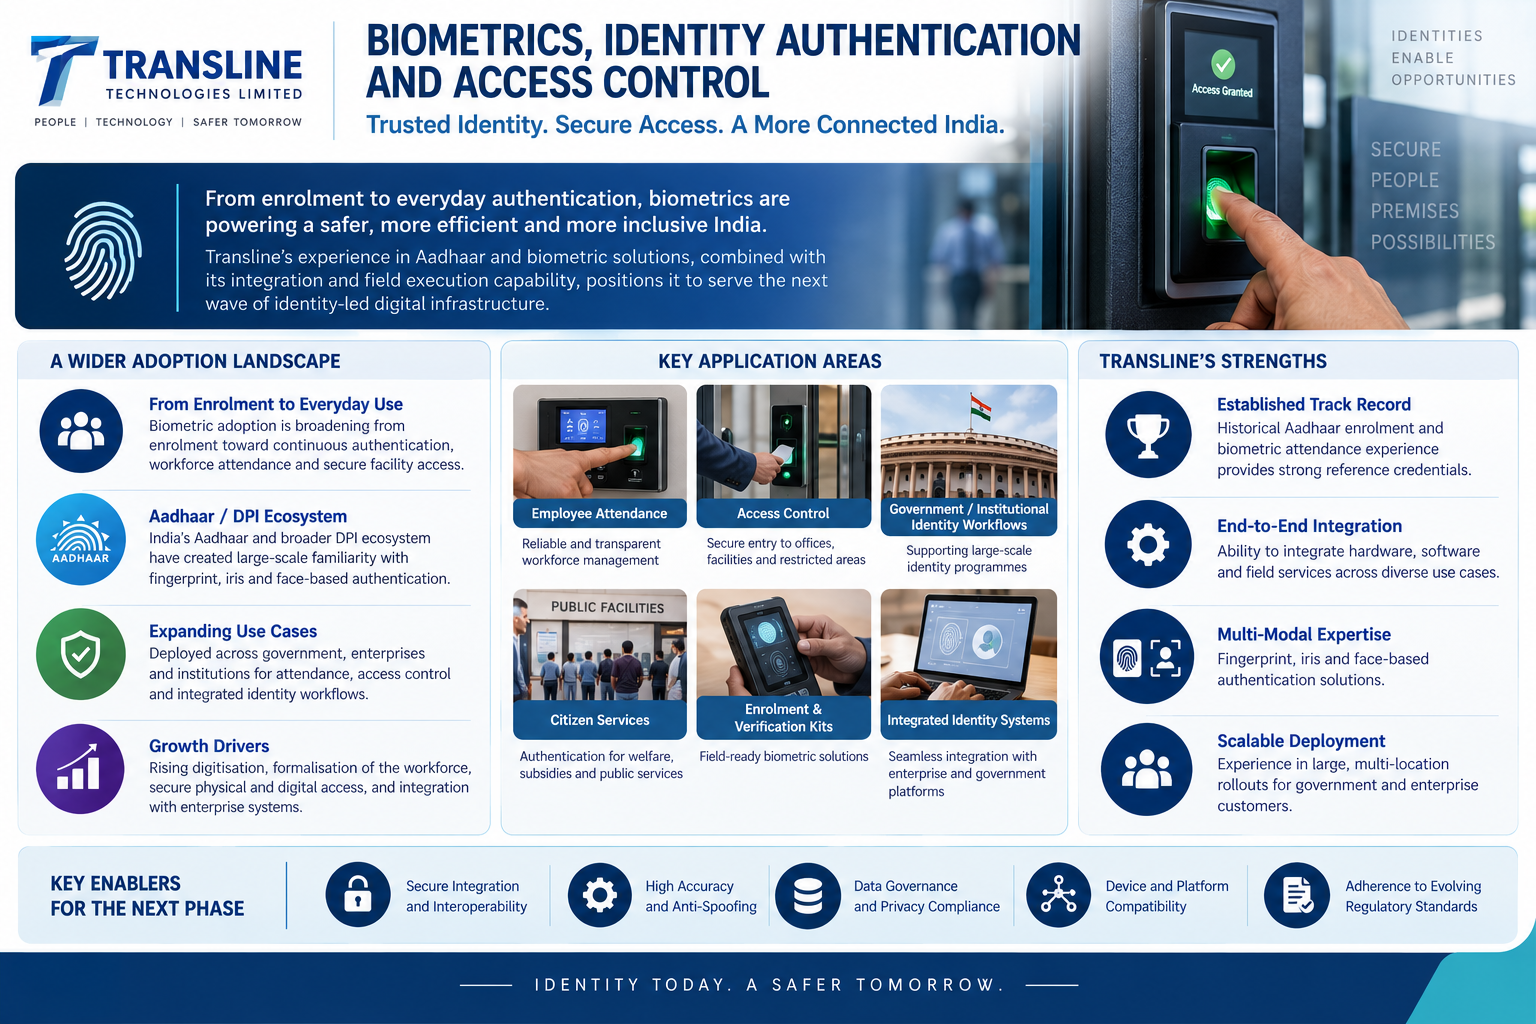
Biometric adoption is broadening from enrolment toward continuous authentication, workforce attendance, secure facility access and integrated identity workflows
India's Aadhaar / DPI ecosystem has created large-scale familiarity with fingerprint, iris and face-based authentication
For Transline, its historical Aadhaar and biometric attendance experience provides reference credentials, while future growth depends on secure integration, device interoperability, accuracy, anti-spoofing standards and compliance with evolving privacy obligations
Government Policy Support
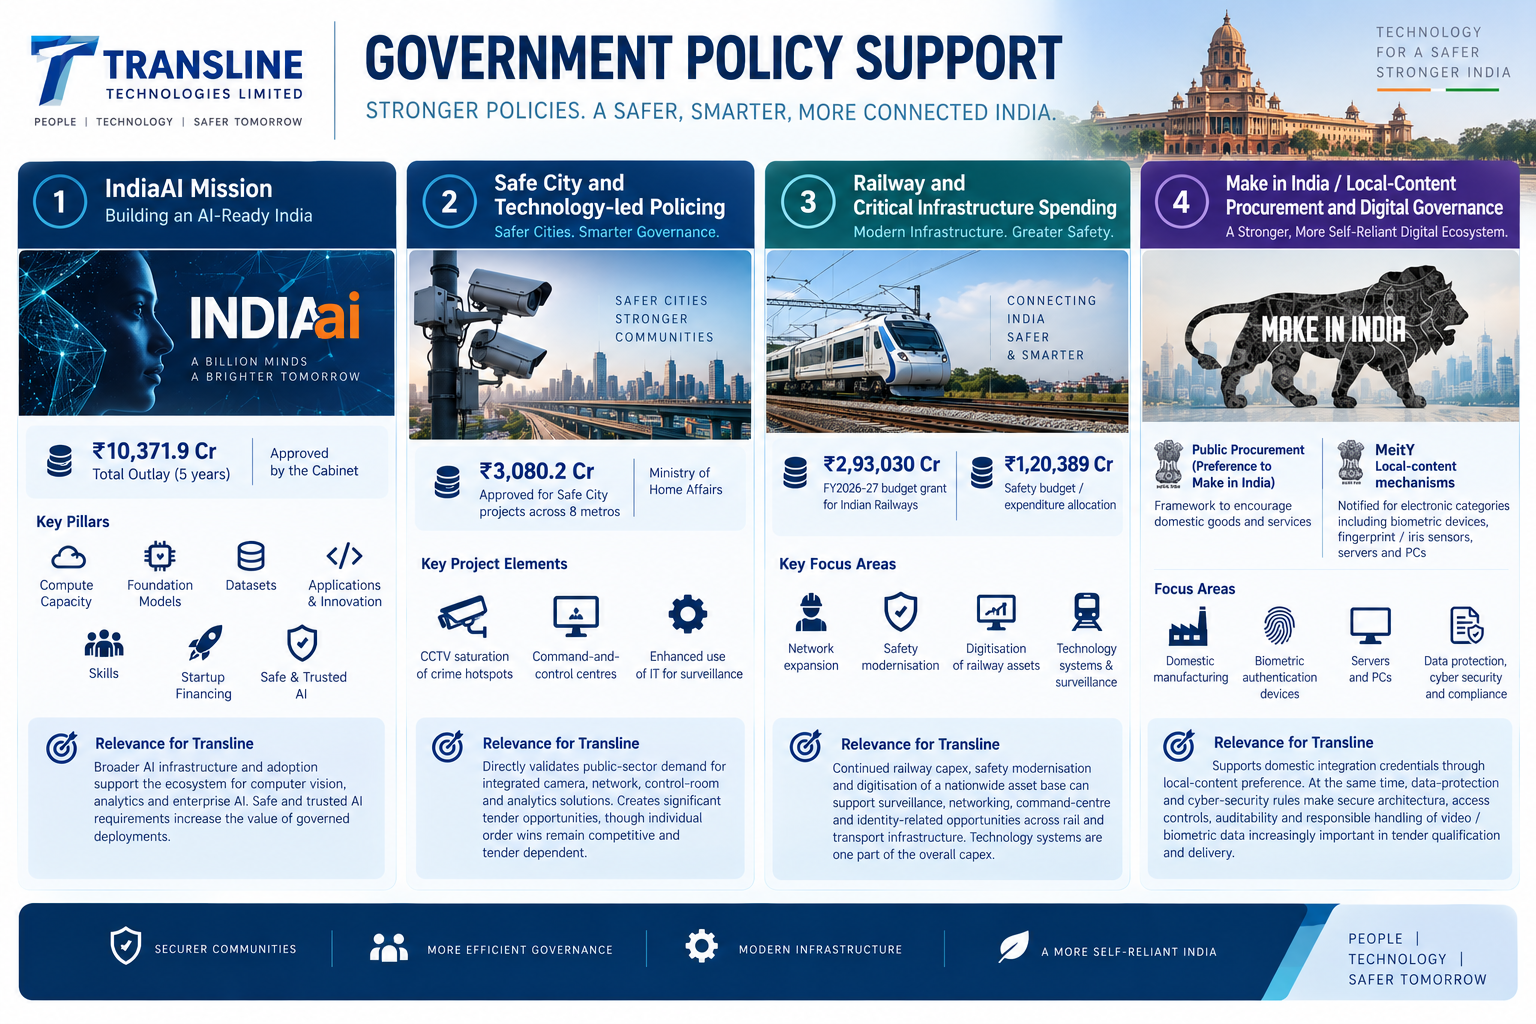
IndiaAI Mission: The Cabinet approved the IndiaAI Mission with an outlay of ₹10,371.9 Cr over five years
Its pillars include compute capacity, foundation models, datasets, application development, skills, startup financing and Safe & Trusted AI
Safe City and technology-led policing: The Ministry of Home Affairs approved ₹3,080.2 Cr for Safe City projects across eight metros, with project elements including CCTV saturation of crime hotspots linked to command-and-control centres and enhanced use of IT for surveillance
Railway and critical-infrastructure spending: Indian Railways has a FY2026-27 budget grant of ₹2,93,030 Cr and a safety budget / expenditure allocation of ₹1,20,389 Cr
Make in India / local-content procurement and digital governance: The Public Procurement (Preference to Make in India) framework is designed to encourage domestic goods and services, and MeitY has notified local-content mechanisms for electronic categories including biometric authentication devices, fingerprint / iris sensors, servers and PCs
- Overview
- Business
- Financial Highlights
- Industry Overview
- Documentation
Get the Preqt App and keep in touch around the clock!
 Monitor your investments in real-time.
- Receive tailored deal suggestions.
- Get real-time updates and alerts.
