

Vaibhav Vyapaar
Empowering Everyday BorrowersCredit Made Effortless
IPO Summary (PreQT)
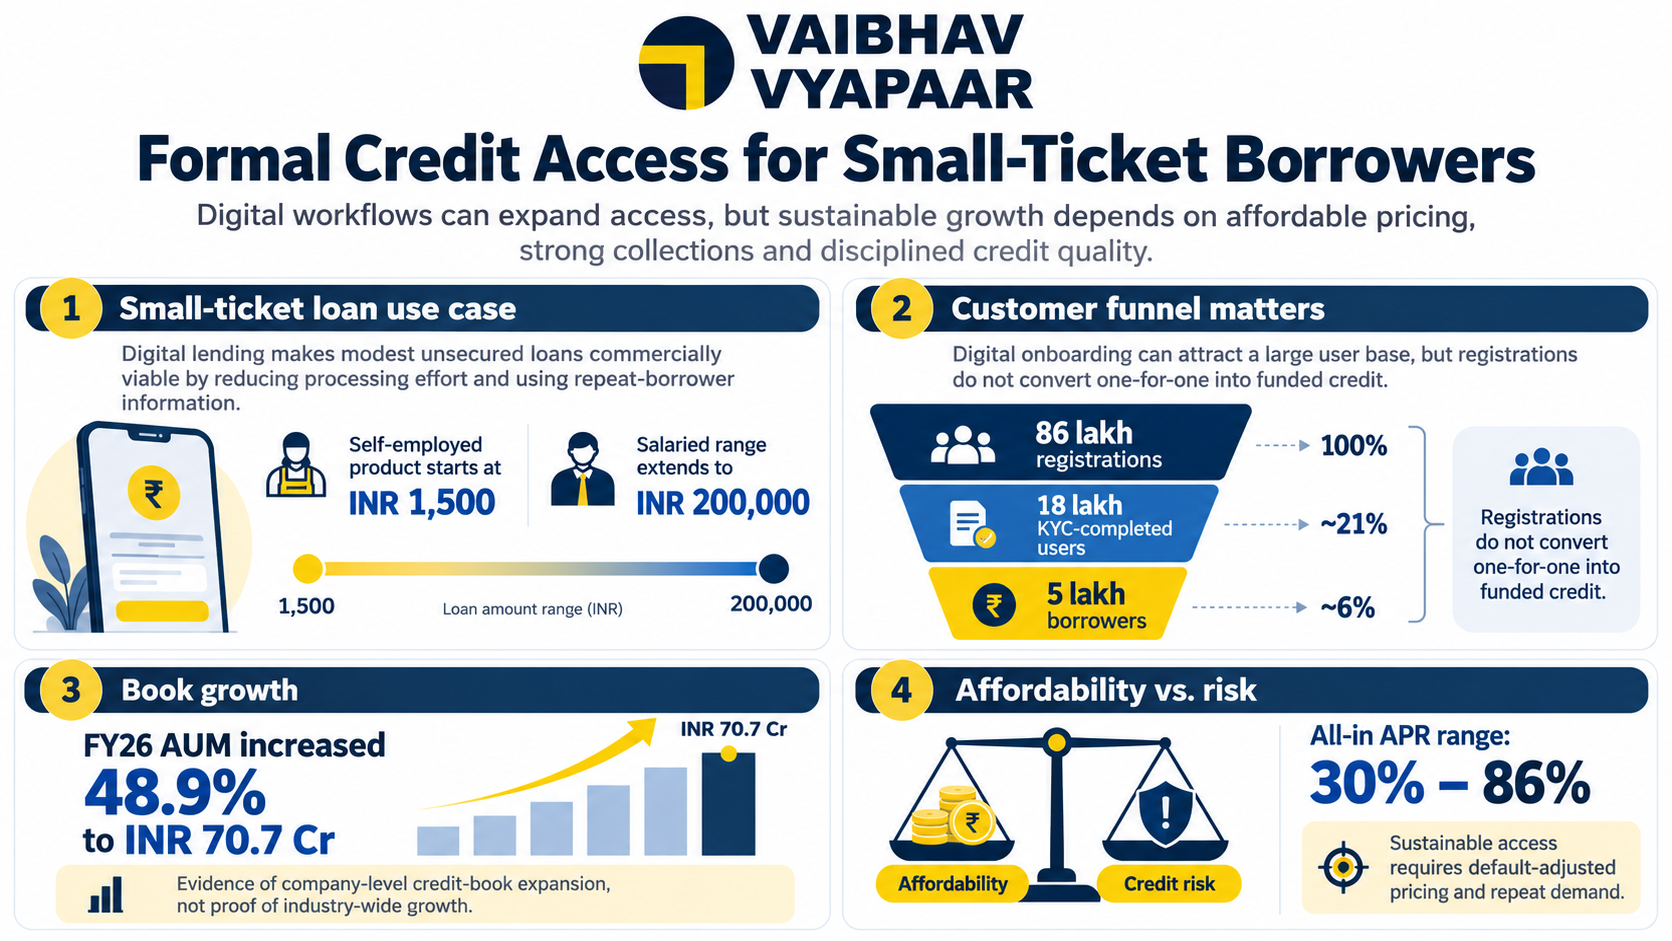
Vaibhav Vyapaar Limited is a non-deposit-taking NBFC operating unsecured digital personal lending through LoanFront, alongside co-lending and lending-platform services. FY26 AUM was INR 70.7 Cr, comprising INR 61.7 Cr on-book and INR 8.9 Cr off-book. Operating revenue rose 46.9% to INR 36.8 Cr; EBITDA was INR 10.8 Cr at 29.5%, and restated PAT INR 2.0 Cr at 5.4%. Fees and other non-interest operating income contributed 70.2% of revenue, while write-offs and net loan provisions remained substantial. The proposed IPO is entirely fresh: 7,796,000 shares, raising INR 39.8–42.1 Cr at the working INR 51–54 band, with no OFS. Capital augmentation supports lending growth, but loan quality, funding costs, related party dependence and the earnings basis are central to assessing the valuation
IPO Review Rating
Below Avg
SMETransforming Consumer Lending Through Technology, Speed, and Simplicity
Vaibhav Vyapaar presents a high-growth digital lending story, with AUM increasing to INR 70.7 Cr in FY26, supported by improving GNPA, a healthy 28.5% CRAR and estimated 9.2% NIM. The 100% fresh issue should further strengthen the capital base and support future loan-book expansion. However, the credit profile remains the key concern, with INR 11.5 Cr of FY26 write-offs and net provisions, rising leverage at 1.5x net D/E, and a still-moderate 7.0% ROE. Asset quality has improved at the GNPA level, but higher NNPA and elevated credit costs warrant caution. Valuation also remains demanding on FY26 earnings, while GetFive's merchant-banker track record is relatively modest. Overall, the IPO offers attractive growth potential but carries meaningful credit-quality, profitability and execution risks.
PARAMETER
WEIGHT
SCORE
KEY FACTORS
Financial Performance
40.0%
3.0/5
Vaibhav Vyapaar recorded strong AUM growth and improving reported GNPA, supported by a still-healthy capital position and improving ROA/ROE. However, rising leverage, substantial FY26 write-offs, increasing movement-based NNPA and heavy dependence on fee-led income temper the quality of growth.
Show more
Detailed Analysis
Total AUM increased from INR 42.4 Cr in FY24 to INR 47.5 Cr in FY25 and INR 70.7 Cr in FY26, representing a strong two-year CAGR of approximately 29.1%. On-book AUM increased sharply to INR 61.7 Cr in FY26
Reported GNPA improved consistently from 6.7% in FY24 to 5.3% in FY25 and 4.7% in FY26, indicating an improvement in headline asset quality. However, movement-based NNPA increased from 0.6% in FY24 to 1.8% in FY26, requiring continued monitoring of underlying credit performance
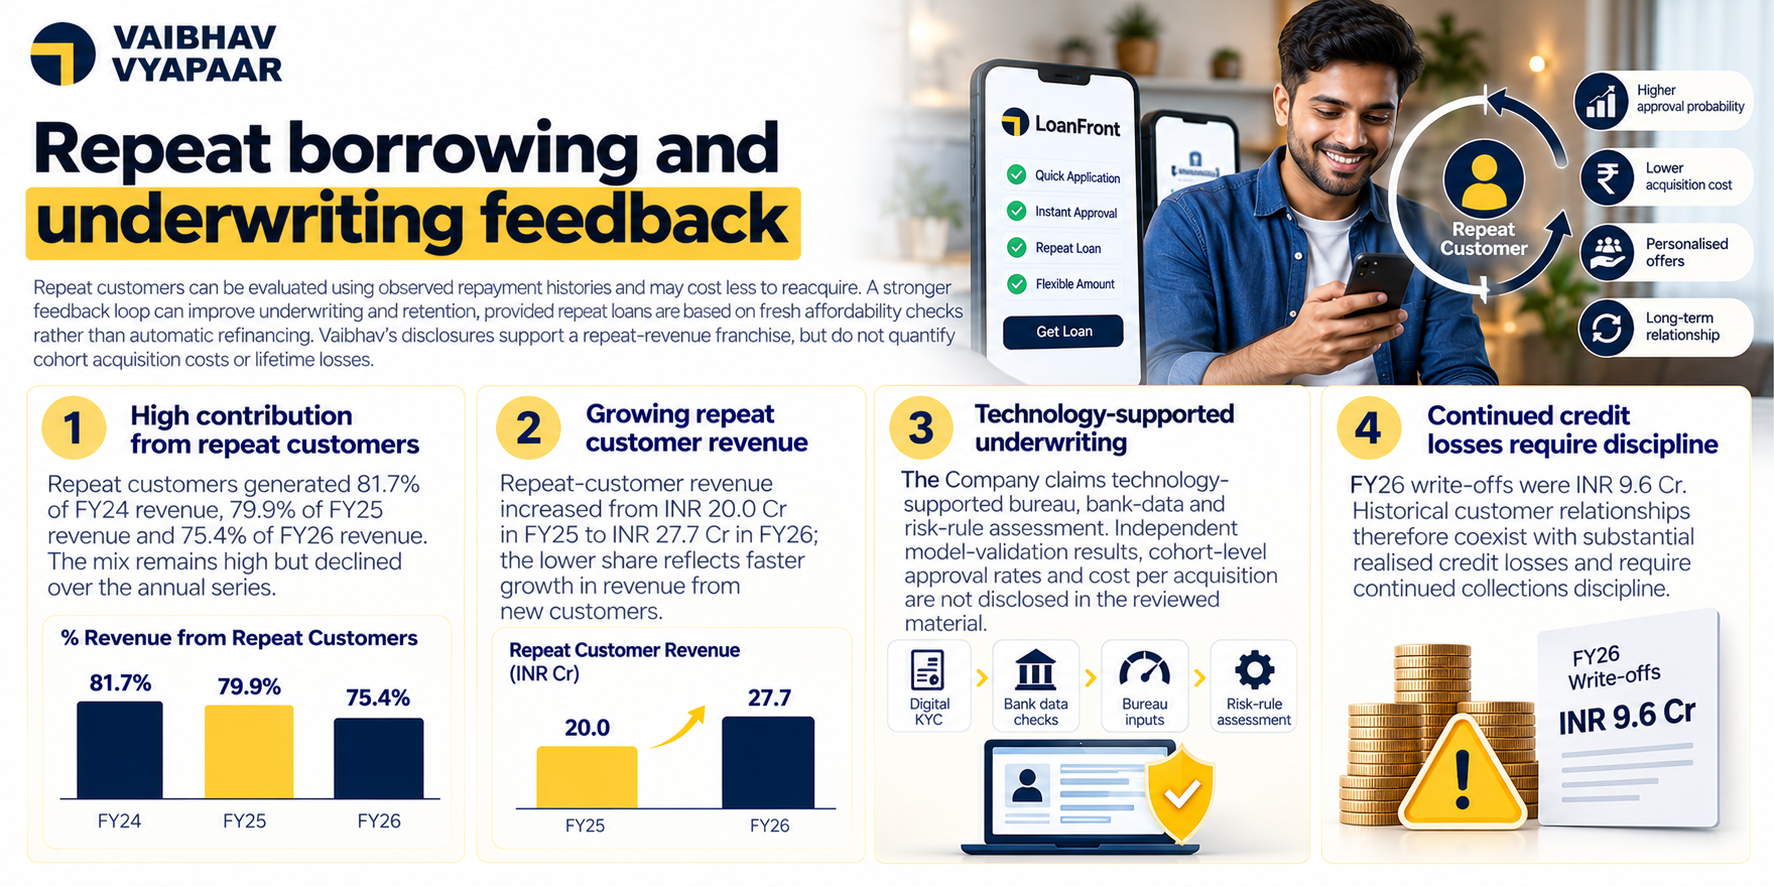
Credit losses remain elevated, with write-offs and net loan provisions of approximately INR 11.5 Cr in FY26, equivalent to around 24.0% of average on-book AUM of INR 47.9 Cr.
Net debt-to-equity increased from 0.8x in FY25 to 1.5x in FY26, as gross borrowings increased to approximately INR 46.8 Cr to fund the expanding loan book. Although leverage remains manageable for an NBFC, the sharp increase reflects greater dependence on external funding
Reported CRAR remained healthy at 28.5% in FY26, although it declined from 40.2% in FY24 and 39.9% in FY25 as AUM expanded. The Company's capital position therefore remains comfortable, but the declining trend reflects increasing utilisation of regulatory capital
Estimated FY26 NIM stands at approximately 9.2%, based on interest income of INR 11.0 Cr, finance cost of INR 6.6 Cr, net interest income of approximately INR 4.4 Cr, and average on-book AUM of approximately INR 47.9 Cr.
Industry
15.0%
4.0/5
Vaibhav operates in a structurally attractive digital-lending market supported by rising retail credit, financial inclusion and India's digital infrastructure. However, unsecured lending, intense competition, funding costs, cyber risk and increasingly stringent RBI oversight create meaningful sector-level risks
Show more
Detailed Analysis
India's retail-credit and digital-lending markets continue to expand at double-digit rates, with the RHP indicating approximately 15.1% historical retail-credit CAGR and external forecasts indicating continued mid-teens digital-lending growth
Digital lending carries high regulatory exposure because RBI rules govern customer disclosures, LSP/DLA arrangements, outsourcing, data usage, recovery practices, credit underwriting and digital-loan transparency
Digital lending remains in a structural growth phase, supported by smartphone penetration, digital KYC, UPI, alternative credit assessment and increasing formal credit access among underserved borrowers
Management
15.0%
4.0/5
Vaibhav benefits from an experienced technology-led management team, 50% Board independence, former RBI expertise and complete absence of promoter selling in the IPO. The principal governance concern is its significant operational and financial dependence on parent CapFront Technologies
Show more
Detailed Analysis
Founder and Managing Director Gowrinath has more than 20 years of technology and business experience, supported by experienced technology, risk and operations professionals, including senior executives with 10–22 years of experience
Three of the Company's six Directors are Independent Directors, resulting in 50% Board independence, including former RBI official Gopal Natarajan, who has more than 37 years of central-banking experience
No major adverse promoter litigation or share-pledge concern is evident from the currently accessible public offer-document summaries
The Company paid approximately INR 5.3 Cr of management fees to holding company CapFront Technologies in FY26, equivalent to around 14.5% of operating revenue, creating material related-party dependence
Valuation
20.0%
3.0/5
Trailing valuation is expensive, with a 77.3x post-issue FY26 P/E versus a 20.9x peer average. However, July earnings acceleration and fresh-capital accretion materially improve forward P/E and P/B, making future profitability execution crucial.
Show more
Detailed Analysis
Vaibhav's 77.3x post-issue FY26 P/E is approximately 270% above the 20.9x peer average, making the issue expensive on trailing diluted earnings despite strong recent profit acceleration
Vaibhav trades at 3x FY26 book value, moderately above the peer average, although July 2026 and post-IPO capital accretion materially improve the book-value valuation
FY26 RoNW of 6.8% is below Paisalo's 13.2% and Apollo Finvest's 9.4%, providing limited justification for the substantial trailing P/E premium
Merchant Banker Track Record
10.0%
3.0/5
GetFive has handled four completed SME IPOs with a modest 5.75% average listing gain, 3.33x average subscription and 50% strictly positive listing success rate. Its execution history is established but remains relatively small and inconsistent
Show more
Detailed Analysis
GetFive's four completed SME IPOs generated an average listing gain of approximately 5.8%, representing positive but relatively modest historical listing performance
The four completed issues generated average subscription of approximately 3.3x, with only Teamtech exceeding 5x, indicating relatively modest historical book-building strength
Only two of four completed IPOs listed strictly above issue price, giving a 50% positive-listing success rate; including Unisem's flat listing raises the non-negative rate to 75%
TOTAL
100%
3.3/5
Weighted Composite Score
Issue Price
₹51.0 to ₹54.0
As of 10 Oct 2026
GMP
₹0.0
As of 10 Oct 2026
Estimated Gain / Loss
0.0%
Lot Size
2,000.0 Shares
Grey Market Premium (GMPs) are shared for knowledge purpose only. PrEqt doesn’t promote or execute the trades.
| Issue Size (in Cr) | |
|---|---|
| Overall | ₹40.0 Cr |
| Fresh Issue | ₹40.0 Cr |
| Offer for Sale | ₹0.0 Cr |
Minimum Investment
₹2,16,000.0 / 40,00,000 shares

Merchant Banker
GetFive Advisors Pvt.Ltd.
GetFive Advisors Pvt.Ltd.
IPO Document
Offer Start Date
Offer End Date
Valuation
Revenue (FY'26)
PAT (FY'26)
Issue Size (in Cr)
Face Value
₹ 5.0Offer Price
₹ 54.0Lot Size
2,000.0 sharesSale Type
Fresh capital onlyPAT (FY'26)
₹ 2.0 CrPAT Margin (FY'26)
5.4 %P/E Multiple
77.3xEBITDA (FY'26)
₹ 10.8 CrCAGR Growth 2Y
29.1 %ROE (FY'26)
6.8 %ROCE (FY'26)
27.0 %Price to Book Value
3.0xDebt/Equity
1.6xCompany Website
www.vaibhav-vyapaar.comExplore new deals
Overview
Fund Allocation
Total: ₹0 CrSource:Company DRHP
Timeline
IPO Open Date
To Be Announced
IPO Close Date
To Be Announced
Tentative Allotment
To Be Announced
Initiation of Refunds
To Be Announced
Credit of Shares to Demat
To Be Announced
Tentative Listing Date
To Be Announced
Business
Business Model
Geographical Presence
Sales Channel
Key Risk Factor
Financial Highlights
Income Statement
Revenue growth with EBITDA and PAT margins
| Financial Metric | FY 2024 | FY 2025 | FY 2026 |
|---|---|---|---|
| Revenue (₹ Cr) | 25.5 | 25.0 | 36.8 |
| Growth (%) | - | -0.8% | 46.9% |
| EBITDA (₹ Cr) | 5.4 | 7.1 | 10.8 |
| EBITDA Margin (%) | 21.3% | 28.2% | 29.5% |
| PAT (₹ Cr) | 0.5 | 1.5 | 2.0 |
| PAT Margin (%) | 1.8% | 5.9% | 5.4% |
OBSERVATIONS & INSIGHTS
Revenue declined 0.8% in FY25 before rising 46.9% in FY26. The two-year FY24–FY26 operating-revenue CAGR is 20.7%. FY26 growth was driven predominantly by processing, foreclosure, platform and miscellaneous income rather than a proportionate increase in loan-interest revenue
EBITDA rose from INR 5.4 Cr to INR 7.1 Cr and INR 10.8 Cr across FY24–FY26. This measure excludes other income and adds back finance cost, so its improvement does not establish an equivalent improvement in lender net economics. EBITDA margin expanded to 28.2% in FY25 and 29.5% in FY26. FY25 includes the provision reversal benefit; FY26 combines higher fee income with substantial write-offs and provisioning
Restated PAT increased from INR 0.5 Cr in FY24 to INR 1.5 Cr in FY25 and INR 2.0 Cr in FY26. The FY25 increase should be read with the provision reversal and the tax-restatement bridge, rather than attributed to revenue expansion. PAT margin rose from 1.8% to 5.9% in FY25, then declined to 5.4% in FY26 despite stronger revenue. Higher finance cost and tax expense absorbed part of the operating improvement
Balance Sheet
| Financial Metric | FY 2024 | FY 2025 | FY 2026 |
|---|---|---|---|
| Net Worth | ₹ 25.7 Cr | ₹ 27.2 Cr | ₹ 29.2 Cr |
| Total Assets | ₹ 61.2 Cr | ₹ 55.0 Cr | ₹ 84.2 Cr |
| Total Borrowing | ₹ 26.8 Cr | ₹ 22.7 Cr | ₹ 46.8 Cr |
| Reserves & Surplus | ₹ 21.7 Cr | ₹ 23.2 Cr | ₹ 21.1 Cr |
OBSERVATIONS & INSIGHTS
Asset growth. Total assets increased 53.0% to INR 84.2 Cr in FY26 from INR 55.0 Cr in FY25. Current loans and advances rose from INR 34.3 Cr to INR 63.2 Cr and were the principal growth driver
Capex and intangibles. Intangible assets rose from INR 4.0 Cr in FY24 to INR 5.9 Cr in FY25 and INR 6.9 Cr in FY26. Software is a material operating asset; impairment, useful-life assumptions and amortisation matter more than physical factory utilisation
Equity and reserves. Restated equity increased from INR 25.7 Cr in FY24 to INR 27.2 Cr in FY25 and INR 29.2 Cr in FY26. FY26 share capital doubled following the bonus issue, with a corresponding reserve reclassification; a bonus issue does not itself introduce cash
Borrowings. Gross borrowings declined to INR 22.7 Cr in FY25 before rising to INR 46.8 Cr in FY26. FY26 current borrowings were INR 39.8 Cr and include current maturities of long-term debt, making maturity management a significant part of the funding analysis
Cash Flow
| Financial Metric | FY 2024 | FY 2025 | FY 2026 |
|---|---|---|---|
CFO (₹ Cr) Cash generated from core business operations. | -4.3 Cr | +0.3 Cr | -18.4 Cr |
CFI (₹ Cr) Cash used for investments and long-term assets. | -8.0 Cr | +3.7 Cr | -3.3 Cr |
CFF (₹ Cr) Cash flow related to funding and borrowings. | +12.0 Cr | -4.7 Cr | +23.6 Cr |
Financial Ratios
Measures the company’s leverage relative to shareholder equity.
OBSERVATIONS & INSIGHTS
Current ratio: The ratio fell from 2.9 times in FY25 to 1.60 times in FY26 as current borrowing rose. A lender’s current assets largely comprise loans and advances; their contractual maturity and recoverability matter more than treating the ratio as immediately available cash
Debt / equity: Net debt/equity increased to 1.5 times in FY26 from 0.8 times. Current and non-current borrowings are both included. The FY24 total cash-and-bank line includes INR 5.0 lakh of other bank balances, which is excluded from cash equivalents for this ratio
Return on equity: ROE improved to 7.0% in FY26 on average equity. The source also publishes closing-net-worth RONW of 6.8%; the denominator difference explains the variation. FY24 ROE of 1.8% follows the disclosed KPI because a verified restated opening equity balance is not used here
Return on capital employed: ROCE of 27.0% in FY26 uses the sample’s assets-minus-current-liabilities convention. This excludes significant current funding from capital employed and can overstate the usefulness of ROCE for an NBFC. EBIT divided by closing equity plus all borrowings is 12.9% for FY26. The RHP’s written capital-employed definition and its numerical ROCE presentation are not fully aligned
Return on assets: FY25 and FY26 ROA use average opening and closing assets and are 2.5% and 2.8%. FY24’s 0.7% is explicitly an end-balance proxy, not an average-assets return, because a verified restated opening asset base is unavailable in the selected series
Interest Coverage Ratio: Coverage rose to 1.5 times in FY26 from 1.2 times in FY25. It measures earnings before financing against finance cost; it does not include principal repayments or establish a lender’s liquidity coverage
Industry Overview
Industry Drivers
Expanding Retail Credit Demand
India's retail lending market has witnessed sustained expansion, driven by increasing consumer borrowing, rising disposable incomes and greater access to formal credit. Banks and NBFCs are expanding their lending portfolios across personal loans, vehicle finance, credit cards and other retail segments. This growing demand creates opportunities for technology-enabled lenders to serve a wider borrower base.
The key drivers are:
Retail Credit Market: India's retail credit stood at approximately USD 937 Bn in FY25, according to CRISIL Intelligence data cited in the RHP
Historical Growth: Retail credit registered a 15.1% CAGR between FY19 and FY25, reflecting sustained growth in consumer financing
Annual Expansion: The retail lending market grew 14% in FY25, supported by demand across housing finance, personal loans, auto loans and credit cards
Banking Credit Growth: Outstanding bank credit increased 9.5% YoY as of June 27, 2025, reflecting broader expansion in lending activity
Digital Payments & Lending Infrastructure
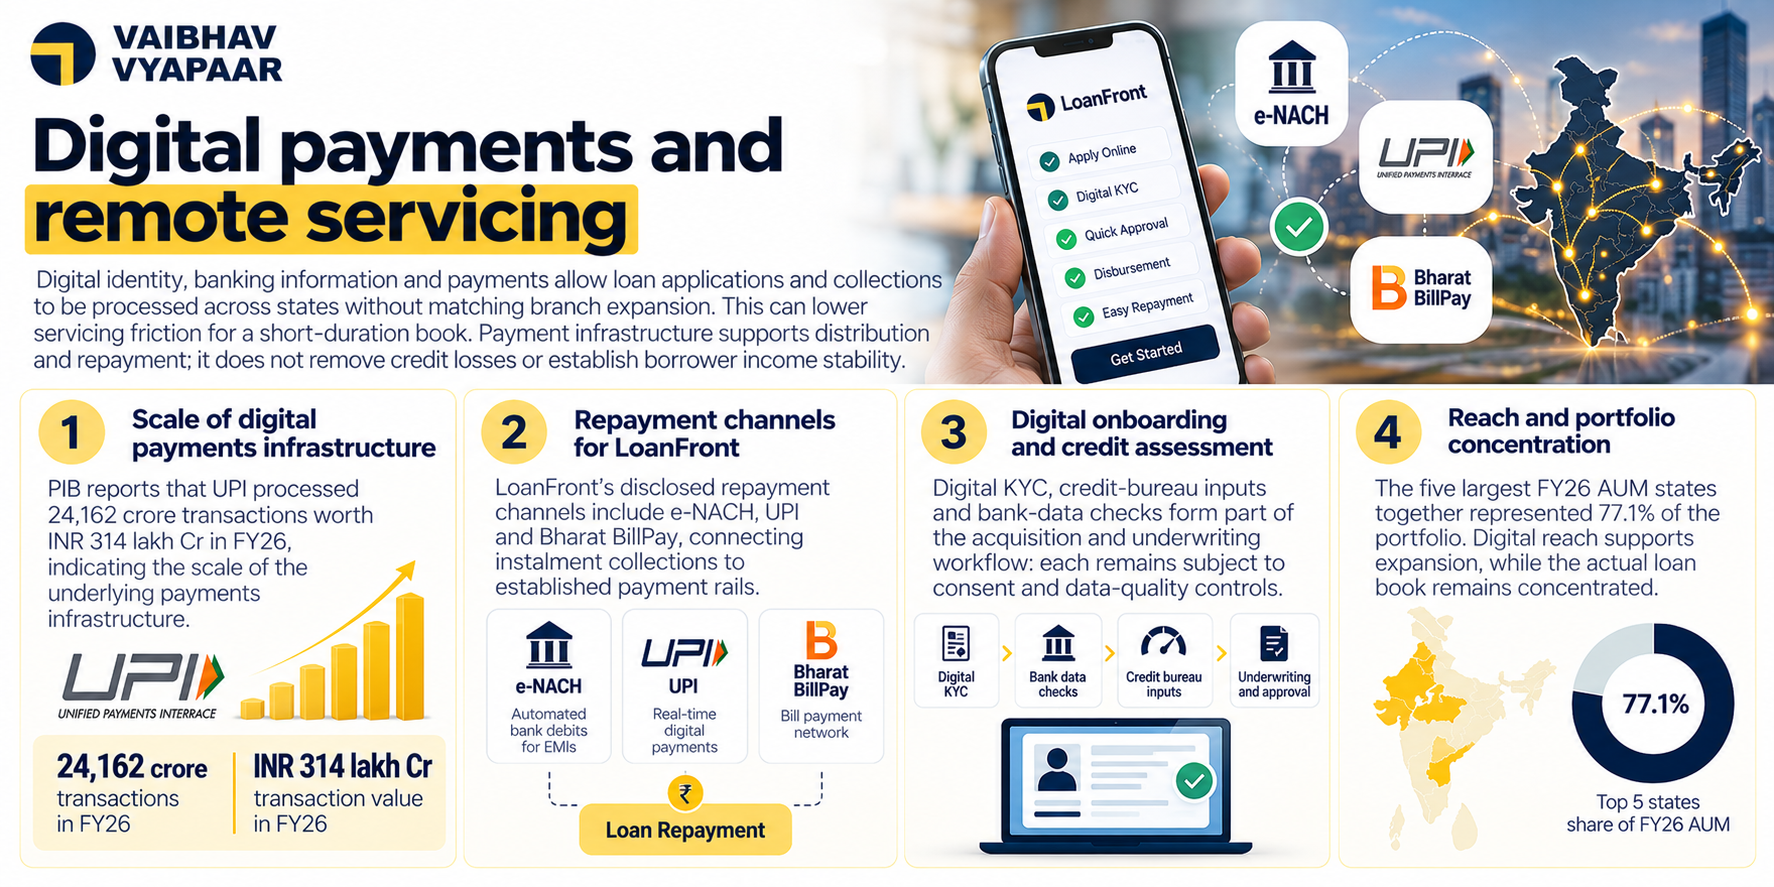
The expansion of India's digital payment infrastructure is enabling faster loan disbursements, automated repayments and lower transaction friction. UPI and electronic banking channels have strengthened the infrastructure supporting digital lending. Increasing adoption of cashless transactions also allows financial institutions to service borrowers remotely without relying extensively on physical branches.
The key drivers are:
UPI Transaction Volume: Monthly UPI transactions reached 20.01 Bn in August 2025, representing 34% YoY growth
Transaction Value: UPI processed approximately INR 24.85 lakh crore in August 2025, registering 21% YoY growth in transaction value
Monthly Expansion: UPI transaction volumes increased from 19.47 Bn in July 2025 to 20.01 Bn in August 2025, approximately 3% growth
Institutional Adoption: Approximately 602 banks were participating in UPI as of July 2024, supporting broader interoperability across India's financial system
Financial Inclusion & Formal Credit Penetration
Financial inclusion initiatives and digital banking infrastructure are expanding access to regulated financial services, particularly in rural and semi-urban India. Greater banking penetration, biometric authentication and digital account verification are reducing barriers to financial participation. This expanding formal banking ecosystem provides a larger potential customer base for regulated retail lenders.
The key drivers are:
Banking Inclusion: Pradhan Mantri Jan Dhan Yojana had reached approximately 52.30 crore beneficiaries by May 2024, with deposits of ₹2.28 lakh crore
Rural Banking Infrastructure: India's micro-ATM network expanded to approximately 14.6 lakh devices in 2024, an 18% increase compared with 2022
Digital Banking Adoption: By August 2025, more than 380 cooperative banks were supported by Aadhaar-enabled banking infrastructure
Formal Credit Access: CSC e-Governance facilitated loan disbursements exceeding ₹3,000 crore since mid-2023, supporting credit accessibility in rural markets
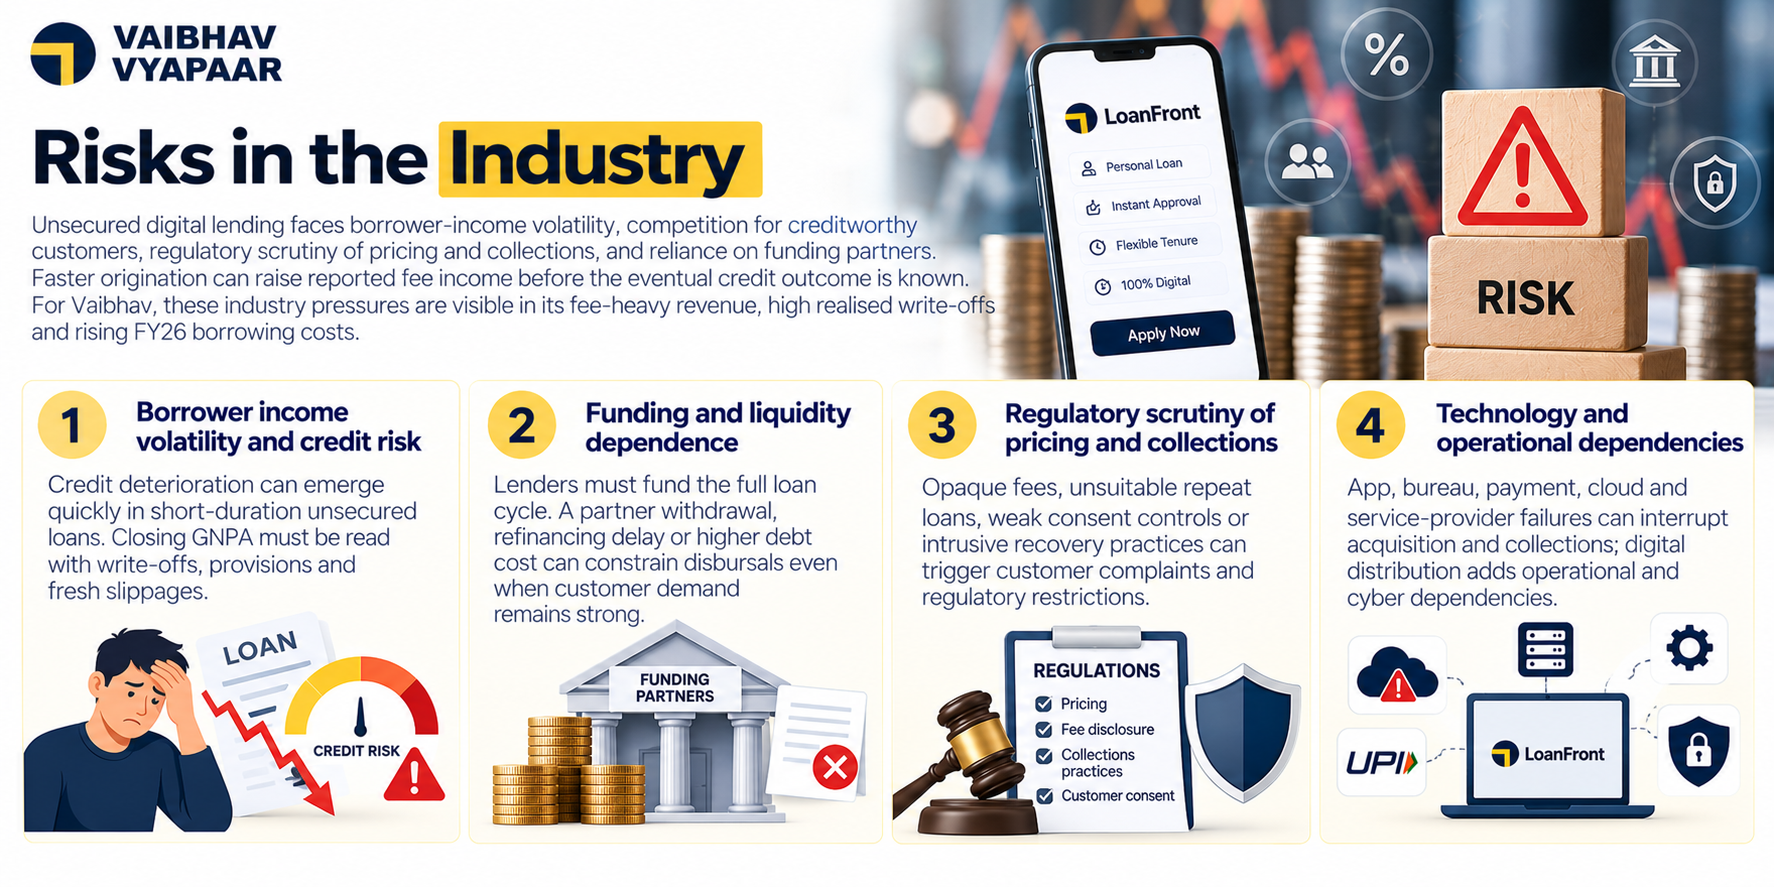
Risks in the Industry
The unsecured digital lending industry faces significant credit, liquidity and regulatory risks due to its dependence on borrower repayment capacity and external funding. Rapid loan disbursement and limited collateral protection increase vulnerability to defaults and economic fluctuations. Additionally, growing dependence on technology and third-party service providers introduces operational and cybersecurity challenges.
The key risks are:
Credit & Default Risk: Unsecured loans carry elevated default risk, particularly among borrowers with limited credit histories or irregular income streams
Funding & Liquidity Risk: Rising borrowing costs, refinancing constraints and dependence on institutional funding can restrict lending capacity and profitability
Regulatory & Compliance Risk: Stricter requirements concerning lending transparency, borrower protection, recovery practices and data privacy increase compliance obligations
Technology & Operational Risk: Cybersecurity threats, data breaches, fraudulent applications and technology disruptions can affect loan origination, servicing and collections
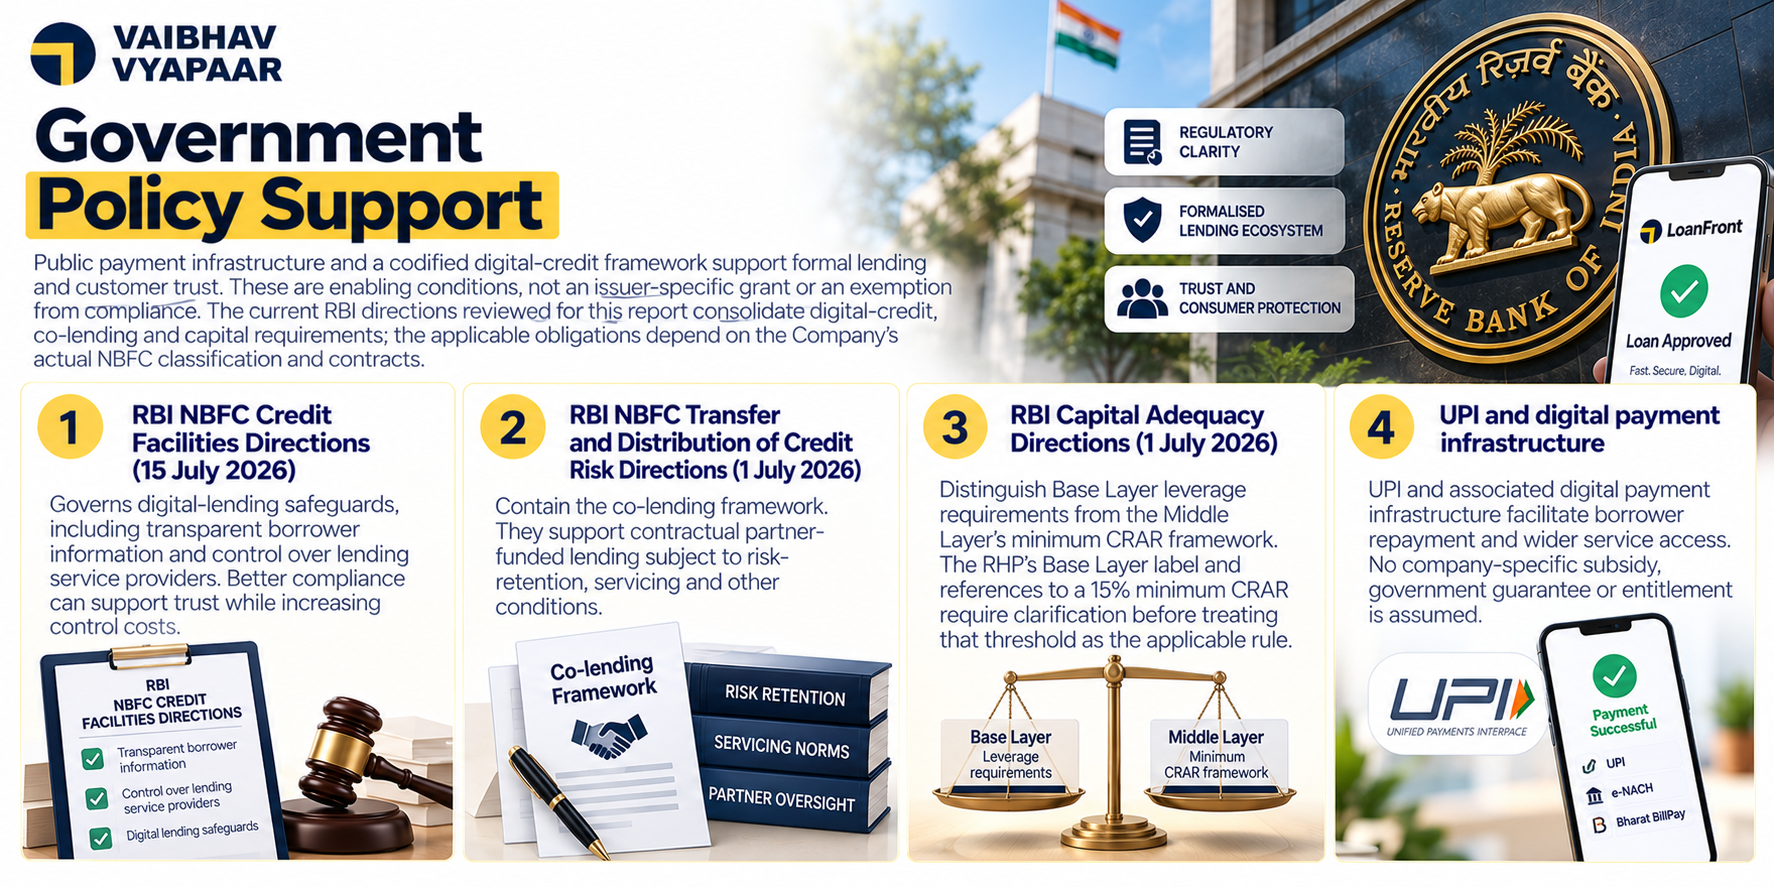
Government Policy Support
Public payment infrastructure and a codified digital-credit framework support formal lending and customer trust. These are enabling conditions, not an issuer-specific grant or an exemption from compliance. The current RBI directions reviewed for this report consolidate digital-credit, co-lending and capital requirements; the applicable obligations depend on the Company’s actual NBFC classification and contracts.
The key policies are:
RBI Digital Lending Framework: The RBI's NBFC Credit Facilities Directions govern digital lending practices, including borrower disclosures, digital loan servicing and oversight of lending service providers
Co-Lending Regulations: RBI's co-lending framework enables eligible regulated lenders to jointly originate loans, subject to prescribed risk-sharing, servicing and disclosure requirements
Scale-Based Regulation: RBI's regulatory framework classifies NBFCs according to size, activities and risk profile, prescribing differentiated capital, governance and prudential requirements
Digital Public Infrastructure: Government-supported digital payment infrastructure, including UPI and digital identity systems, facilitates cashless repayments, remote onboarding and broader access to formal financial services
Fundraise/Future Plans
Shareholding
Pre-issue shareholding
Promoter Holding 0.0%
Post-Issue Shareholding
Promoter Holding 0.0%
Category
Pre-Issue%Post-Issue%
Promoters
Capfront Technologies Private Limited
100.0%72.3%
Total Promoter Holding
100.0%72.3%
Additional Shareholders
Other Shareholders
0.0%27.7%
Total Additional Holding
0.0%27.7%
Total Shareholding
100.0%100.0%
- Overview
- Business
- Financial Highlights
- Industry Overview
- Fundraise/Future Plans
- Documentation
Get the Preqt App and keep in touch around the clock!
 Monitor your investments in real-time.
- Receive tailored deal suggestions.
- Get real-time updates and alerts.
