


Veegaland Developers
Building Better LivingCreating Spaces, Building Trust
IPO Summary (PrEqT)
Veegaland Developers is a Kerala-focused residential developer operating under the Veegaland Homes brand across mid-premium, premium, ultra-premium, Luxe-series and ultra-luxury apartments. The Company has scaled rapidly, with FY26 revenue of INR 251.0 Cr, PAT of INR 26.6 Cr and gross collections of INR 291.8 Cr, while project inventory and customer receivables continued to absorb cash. The project portfolio provides execution visibility: 10 completed projects were fully sold, while 12 ongoing projects represented 18.6 lakh sq. ft. of saleable area as of June 30, 2026, with 63.6% of non-JDA saleable area already sold. A pre-IPO equity infusion materially reduced leverage, taking FY26 Debt/Equity to 0.3x from 2.7x in FY25. The IPO is a fresh issue of up to INR 210.0 Cr, primarily funding ongoing project development and future land acquisition. The key underwriting question is whether strong sales value, pricing and collections can translate into sustained operating cash generation as the development pipeline expands.
IPO Review Rating
Buy
MainboardBuilding Enduring Communities Through Quality Homes and Trusted Development
Veegaland's underlying business quality is good. The strongest elements are the ~50.5% FY24–FY26 Revenue CAGR, improving PAT Margin, strong sales and collections growth, substantially reduced leverage, experienced promoter group, regional positioning in Kerala and the absence of any OFS. The premium residential market also has a supportive structural growth outlook. The principal concern is cash conversion. Despite INR 26.6 Cr of FY26 PAT, the Company generated negative INR 74.3 Cr operating cash flow, after negative INR 44.0 Cr in FY25, as inventory, land and receivables absorbed capital. The sharp balance-sheet improvement also came substantially through the INR 175.0 Cr promoter rights issue rather than operating cash generation. Related-party transactions and the outstanding promoter litigation warrant monitoring, but they do not presently outweigh the operating positives.
PARAMETER
WEIGHT
SCORE
KEY FACTORS
Financial Performance
40.0%
4.0/5
Veegaland combines exceptional Revenue and PAT growth with healthy margins and significantly lower leverage. The principal deduction is weak cash conversion, with substantial negative operating cash flow in both FY25 and FY26.
Show more
Detailed Analysis
Revenue from operations increased from INR 110.8 Cr in FY24 to INR 192.4 Cr in FY25 and INR 251.0 Cr in FY26, translating into a FY24–FY26 CAGR of ~50.5%
EBITDA Margin improved from 14.6% in FY24 to 17.2% in FY25, before moderating slightly to 16.8% in FY26
PAT Margin improved materially from 6.9% in FY24 to 10.4% in FY25 and 10.5% in FY26
Debt-to-equity reduced sharply from 2.7x in FY24 and FY25 to 0.3x in FY26
FY26 ROE stood at 16.0%, compared with 37.0% in FY25 and 19.1% in FY24
No individual customer represented more than 10% of Revenue or trade receivables in FY24, FY25 or FY26
Industry
15.0%
3.0/5
Veegaland operates in a favourable premium residential segment benefiting from strong growth, rising affluent demand and Kerala's substantial NRI ecosystem. However, real estate remains highly competitive, cyclical and regulation-intensive, with land acquisition and project approvals representing permanent execution risks.
Show more
Detailed Analysis
India's boutique residential market is expected to expand from approximately INR 7.2 trillion in FY27F to INR 17.2 trillion by FY32F, implying approximately 19.2% CAGR
Overall residential real estate is an established industry, but the premium/boutique housing category remains in a structural growth phase
Residential real estate remains subject to extensive regulation involving RERA compliance, land titles, environmental permissions, municipal approvals, building permits, GST, stamp duties and project-specific approvals
Management
15.0%
4.0/5
Veegaland benefits from a highly experienced promoter with a strong entrepreneurial track record and an experienced operating team. The no-OFS structure demonstrates commitment.
Show more
Detailed Analysis
Kochouseph Thomas Chittilappilly has over 49 years of diversified business experience, including more than 16 years in real estate and amusement parks
Independent Directors constitute approximately 42.9% of the Board
Promoter Kochouseph Chittilappilly is involved in a pending criminal contempt proceeding before the Kerala High Court. The RHP also reports two promoter tax matters aggregating only around INR 12.4 lakh. No SEBI or stock-exchange disciplinary action is disclosed
Valuation
20.0%
5.0/5
At the upper price of INR 140.0, Veegaland is valued at approximately 16.0x historical FY26 P/E and 1.8x P/B, while FY26 RoNW stands at 16.0%.
Show more
Detailed Analysis
At INR 140.0, Veegaland trades at 16.0x FY26 EPS of INR 8.8, representing approximately 67.1% discount to the peers
EV/EBITDA is 16.2x, versus current selected peer average of approximately 22.5x, giving a peer/company ratio of approximately 1.4x
Price of INR 140.0 against FY26 NAV of INR 79.1 implies approximately 1.8x P/B
FY26 RoNW stood at 16.0%
Merchant Banker Track Record
10.0%
4.0/5
Cumulative Capital has delivered a strong numerical IPO track record, with its 8 disclosed issues generating approximately 23.2% average listing-day gains, but confidence should be moderated because the BRLM does not yet have deep Mainboard execution history
Show more
Detailed Analysis
Across the 8 disclosed IPOs, average listing-opening return was approximately 23.2%
The 8 recent issues generated an average subscription of approximately 144.6x and median subscription of approximately 47.8x
8 of 8 disclosed IPOs opened above issue price, resulting mechanically in a 100.0% positive-listing success rate
1 recent Mainboard IPO + 7 SME IPOs provides meaningful execution history, but mainboard depth remains limited relative to institutional Tier-1/2 BRLMs
TOTAL
100%
4.0/5
Weighted Composite Score
Issue Price
₹130.0 to ₹140.0
As of 1 Sep 2026
GMP
₹14.0
As of 1 Sep 2026
Estimated Gain / Loss
+10.0%
Lot Size
107.0 Shares
Grey Market Premium (GMPs) are shared for knowledge purpose only. PrEqt doesn’t promote or execute the trades.
| Issue Size (in Cr) | |
|---|---|
| Overall | ₹210.0 Cr |
| Fresh Issue | ₹210.0 Cr |
| Offer for Sale | ₹0.0 Cr |
Minimum Investment
₹14,980.0 / 11,449 shares

Merchant Banker
Cumulative Capital Pvt.Ltd.
IPO Document
RHP / Anchor Document
Offer Start Date
10th Sept 2026
Offer End Date
15th Sept 2026
Valuation
₹682.5 Cr
Revenue (FY'26)
₹254.2 Cr
PAT (FY'26)
₹26.6 Cr
Issue Size (in Cr)
₹210.0 Cr
Face Value
₹ 10.0Offer Price
₹ 140.0Lot Size
107.0 sharesSale Type
Fresh capital onlyPAT (FY'26)
₹ 26.6 CrPAT Margin (FY'26)
10.5 %P/E Multiple
16.0xEBITDA (FY'26)
₹ 42.6 CrCAGR Growth 2Y
50.5 %ROE (FY'26)
16.0 %ROCE (FY'26)
11.9 %Price to Book Value
1.8xDebt/Equity
0.3xCompany Website
www.veegaland.comExplore new deals
Overview
Fund Allocation
Total: ₹0 CrSource:Company DRHP
Timeline
IPO Open Date
To Be Announced
IPO Close Date
To Be Announced
Tentative Allotment
To Be Announced
Initiation of Refunds
To Be Announced
Credit of Shares to Demat
To Be Announced
Tentative Listing Date
To Be Announced
Business
Business Model
Geographical Presence
Sales Channel
Key Risk Factor
Financial Highlights
Income Statement
Revenue growth with EBITDA and PAT margins
| Financial Metric | FY 2024 | FY 2025 | FY 2026 |
|---|---|---|---|
| Revenue (₹ Cr) | 114.6 | 196.2 | 254.2 |
| Growth (%) | - | 73.7% | 30.5% |
| EBITDA (₹ Cr) | 16.7 | 33.8 | 42.6 |
| EBITDA Margin (%) | 14.6% | 17.2% | 16.8% |
| PAT (₹ Cr) | 7.9 | 20.4 | 26.6 |
| PAT Margin (%) | 6.9% | 10.4% | 10.5% |
OBSERVATIONS & INSIGHTS
Revenue increased from INR 110.8 Cr in FY24 to INR 251.0 Cr in FY26, a 50.5% two-year CAGR. FY26 growth was driven by construction progress across ongoing projects and four new launches - Casabella, Flora, Serene and Lluvia Garden
EBITDA more than doubled from INR 16.7 Cr in FY24 to INR 42.6 Cr in FY26 as higher revenue and project execution improved operating scale
PAT increased to INR 26.6 Cr in FY26, up 30.3% YoY, supported by higher operating revenue, better overhead absorption and finance costs growing materially slower than revenue
Balance Sheet
| Financial Metric | FY 2024 | FY 2025 | FY 2026 |
|---|---|---|---|
| Net Worth | ₹ 45.1 Cr | ₹ 65.4 Cr | ₹ 266.9 Cr |
| Total Assets | ₹ 221.0 Cr | ₹ 326.7 Cr | ₹ 483.8 Cr |
| Total Borrowing | ₹ 120.2 Cr | ₹ 177.0 Cr | ₹ 85.6 Cr |
| Reserves & Surplus | ₹ 40.1 Cr | ₹ 60.4 Cr | ₹ 233.2 Cr |
OBSERVATIONS & INSIGHTS
Total equity rose from INR 65.4 Cr in FY25 to INR 266.9 Cr in FY26, principally because the Company raised INR 175.0 Cr of equity capital/securities premium and retained FY26 profits
Total assets expanded 48.1% in FY26 to INR 483.8 Cr as the Company simultaneously increased project inventory, receivables, financial assets and owned operating infrastructure
Gross borrowings fell 51.6% from INR 177.0 Cr to INR 85.6 Cr in FY26, driving D/E down to 0.3x and materially reducing financial leverage
Cash Flow
| Financial Metric | FY 2024 | FY 2025 | FY 2026 |
|---|---|---|---|
CFO in Cr Cash generated from core business operations. | +8.8 Cr | -44.0 Cr | -74.3 Cr |
CFI in Cr Cash used in / generated from investing activities. | +1.9 Cr | -0.2 Cr | -19.8 Cr |
CFF in Cr Cash from / used in financing activities. | -7.0 Cr | +51.7 Cr | +77.9 Cr |
Working Capital
| Efficiency Metric | FY 2023 | FY 2024 | FY 2025 |
|---|---|---|---|
Debtor Days Average number of days taken to collect customer payments. | - | - | - |
Creditor Days Average time taken to pay suppliers and vendors. | - | - | - |
Inventory Days Average number of days inventory remains unsold. | - | - | - |
CCC (Cash Conversion Cycle) (Debtor Days + Inventory Days - Creditor Days) | - | - | - |
Financial Ratios
Measures the company’s leverage relative to shareholder equity.
OBSERVATIONS & INSIGHTS
FY26 ROE declined to 16.0% from 37.0% because the equity base expanded sharply after the pre-IPO equity issuance; PAT still increased 30.3%
D/E fell from 2.70x in FY25 to 0.32x in FY26 as total equity rose to INR 266.9 Cr and gross borrowings reduced to INR 85.6 Cr.
Interest Coverage improved to 7.3x as EBIT expanded while finance costs rose only 13.5%; finance cost fell to 2.2% of total income from 2.6% in FY25
Liquidity recovered to 2.2x in FY26 after falling to 2.1x in FY25; project inventory remains the largest current-asset component
ROCE moderated to 11.9% from 13.8% as equity and capital employed expanded ahead of operating profit, but remained above FY24
Industry Overview
Industry Drivers
Residential Market Expansion and Premiumisation
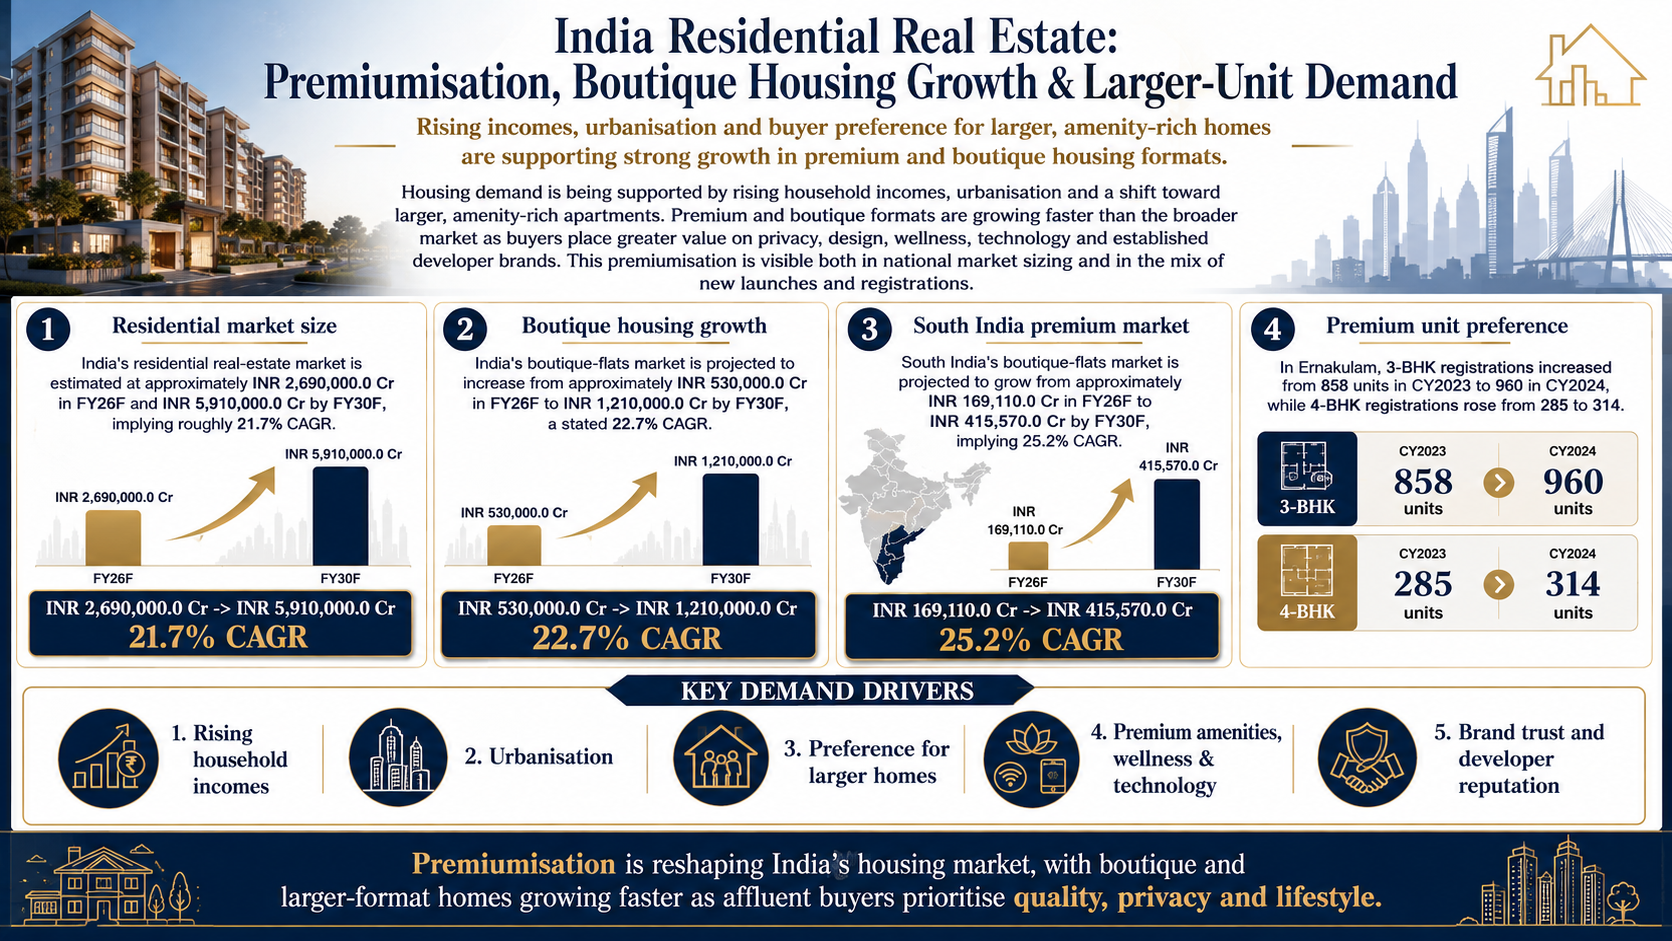
Housing demand is being supported by rising household incomes, urbanisation and a shift toward larger, amenity-rich apartments. Premium and boutique formats are growing faster than the broader market as buyers place greater value on privacy, design, wellness, technology and established developer brands. This premiumisation is visible both in national market sizing and in the mix of new launches and registrations.
The key details are:
India's residential real-estate market is estimated at approximately INR 2,690,000.0 Cr in FY26F and INR 5,910,000.0 Cr by FY30F, implying roughly 21.7% CAGR
India's boutique-flats market is projected to increase from approximately INR 530,000.0 Cr in FY26F to INR 1,210,000.0 Cr by FY30F, a stated 22.7% CAGR
South India's boutique-flats market is projected to grow from approximately INR 169,110.0 Cr in FY26F to INR 415,570.0 Cr by FY30F, implying 25.2% CAGR
In Ernakulam, 3-BHK registrations increased from 858 units in CY2023 to 960 in CY2024, while 4-BHK registrations rose from 285 to 314
Kerala, NRI Capital and Affluent End-user Demand
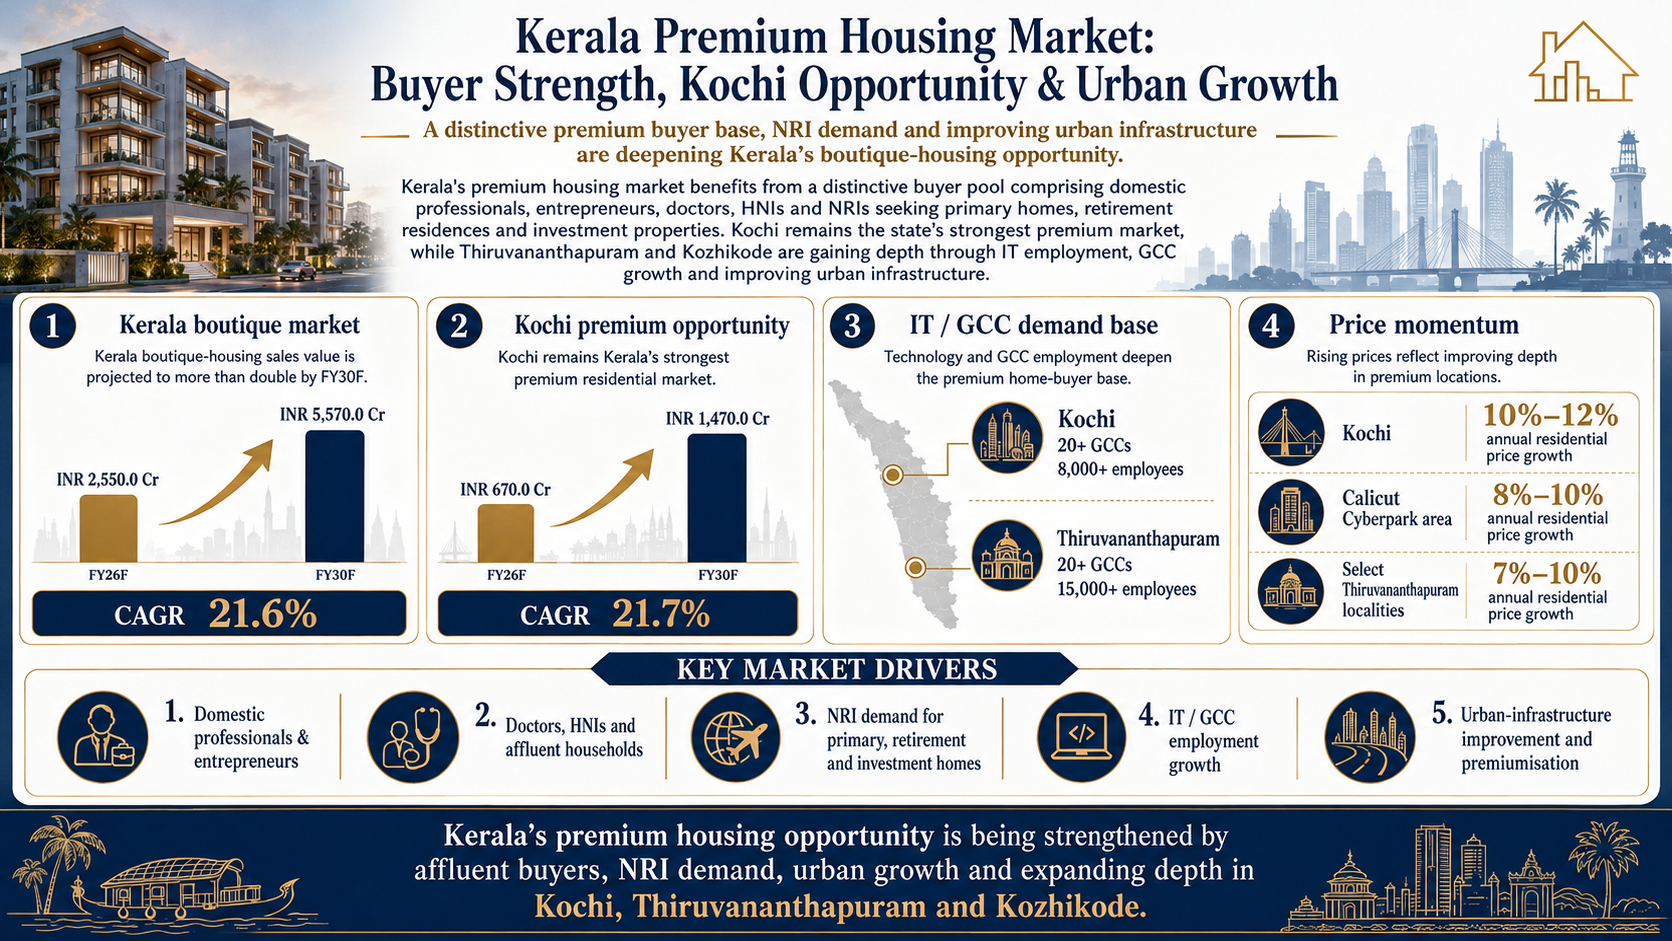
Kerala's premium housing market benefits from a distinctive buyer pool comprising domestic professionals, entrepreneurs, doctors, HNIs and NRIs seeking primary homes, retirement residences and investment properties. Kochi remains the state's strongest premium market, while Thiruvananthapuram and Kozhikode are gaining depth through IT employment, GCC growth and improving urban infrastructure.
The key details are:
Sales value is projected to rise from approximately INR 2,550.0 Cr in FY26F to INR 5,570.0 Cr by FY30F, implying about 21.6% CAGR
Kochi's boutique-flats market is projected to expand from approximately INR 670.0 Cr in FY26F to INR 1,470.0 Cr by FY30F, a stated 21.7% CAGR
Kochi and Thiruvananthapuram each host more than 20 GCCs; the report cites employment of more than 8,000 and 15,000 people, respectively
Kerala residential prices have been rising by about 10%-12% annually in Kochi, 8%-10% around Calicut Cyberpark and 7%-10% in select Thiruvananthapuram localities
Infrastructure, Employment Hubs and Emerging Micro-markets
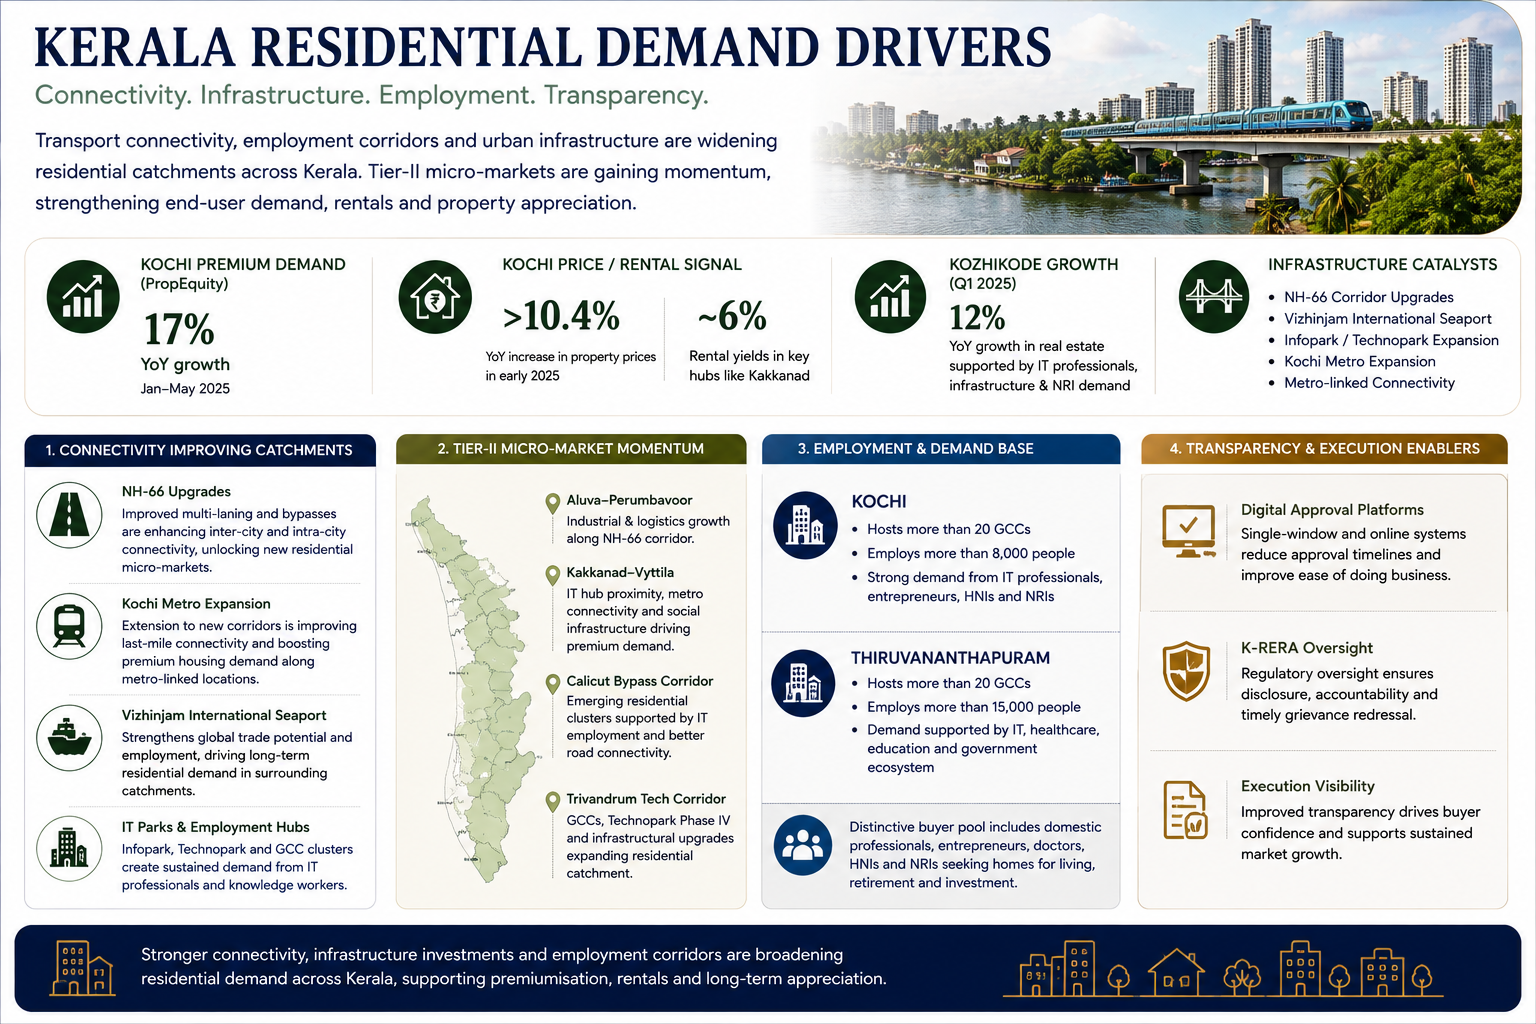
Residential demand in Kerala is increasingly linked to transport connectivity, employment corridors and urban infrastructure. NH-66 upgrades, Kochi Metro expansion, Vizhinjam International Seaport and IT-park growth are widening residential catchments, while rising activity in Tier-II micro-markets is supporting both end-user demand and property appreciation. Digital approval platforms and K-RERA also improve transparency and execution visibility.
The key details are:
PropEquity data cited in the industry report indicates premium housing in Kochi grew 17% year-on-year between January and May 2025
Property prices rose more than 10.4% year-on-year in early 2025, while rental yields reached about 6% in key hubs such as Kakkanad
Kozhikode real estate recorded approximately 12% year-on-year growth in Q1 2025, supported by IT professionals, infrastructure and NRI demand
NH-66, Vizhinjam International Seaport, Infopark / Technopark expansion and metro-linked connectivity are identified as key demand enablers across Kerala
Risks in the Industry
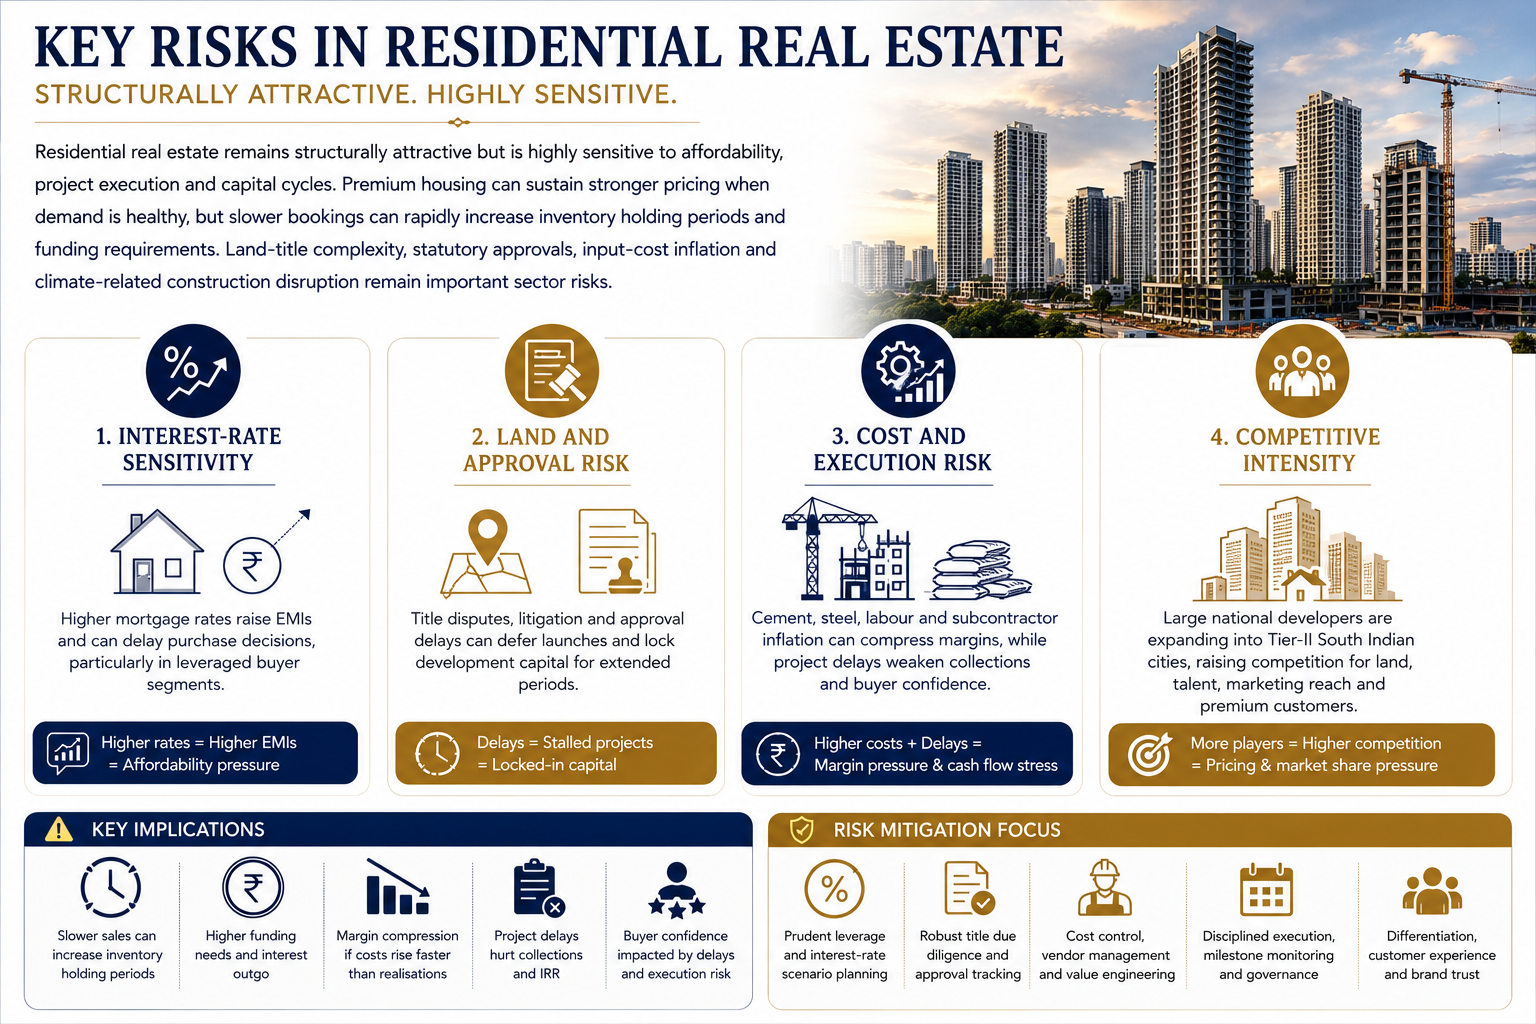
Residential real estate remains structurally attractive but is highly sensitive to affordability, project execution and capital cycles. Premium housing can sustain stronger pricing when demand is healthy, but slower bookings can rapidly increase inventory holding periods and funding requirements. Land-title complexity, statutory approvals, input-cost inflation and climate-related construction disruption remain important sector risks.
The key risks are:
Higher mortgage rates raise EMIs and can delay purchase decisions, particularly in leveraged buyer segments
Title disputes, litigation and approval delays can defer launches and lock development capital for extended periods
Cement, steel, labour and subcontractor inflation can compress margins, while project delays weaken collections and buyer confidence
Large national developers are expanding into Tier-II South Indian cities, raising competition for land, talent, marketing reach and premium customers
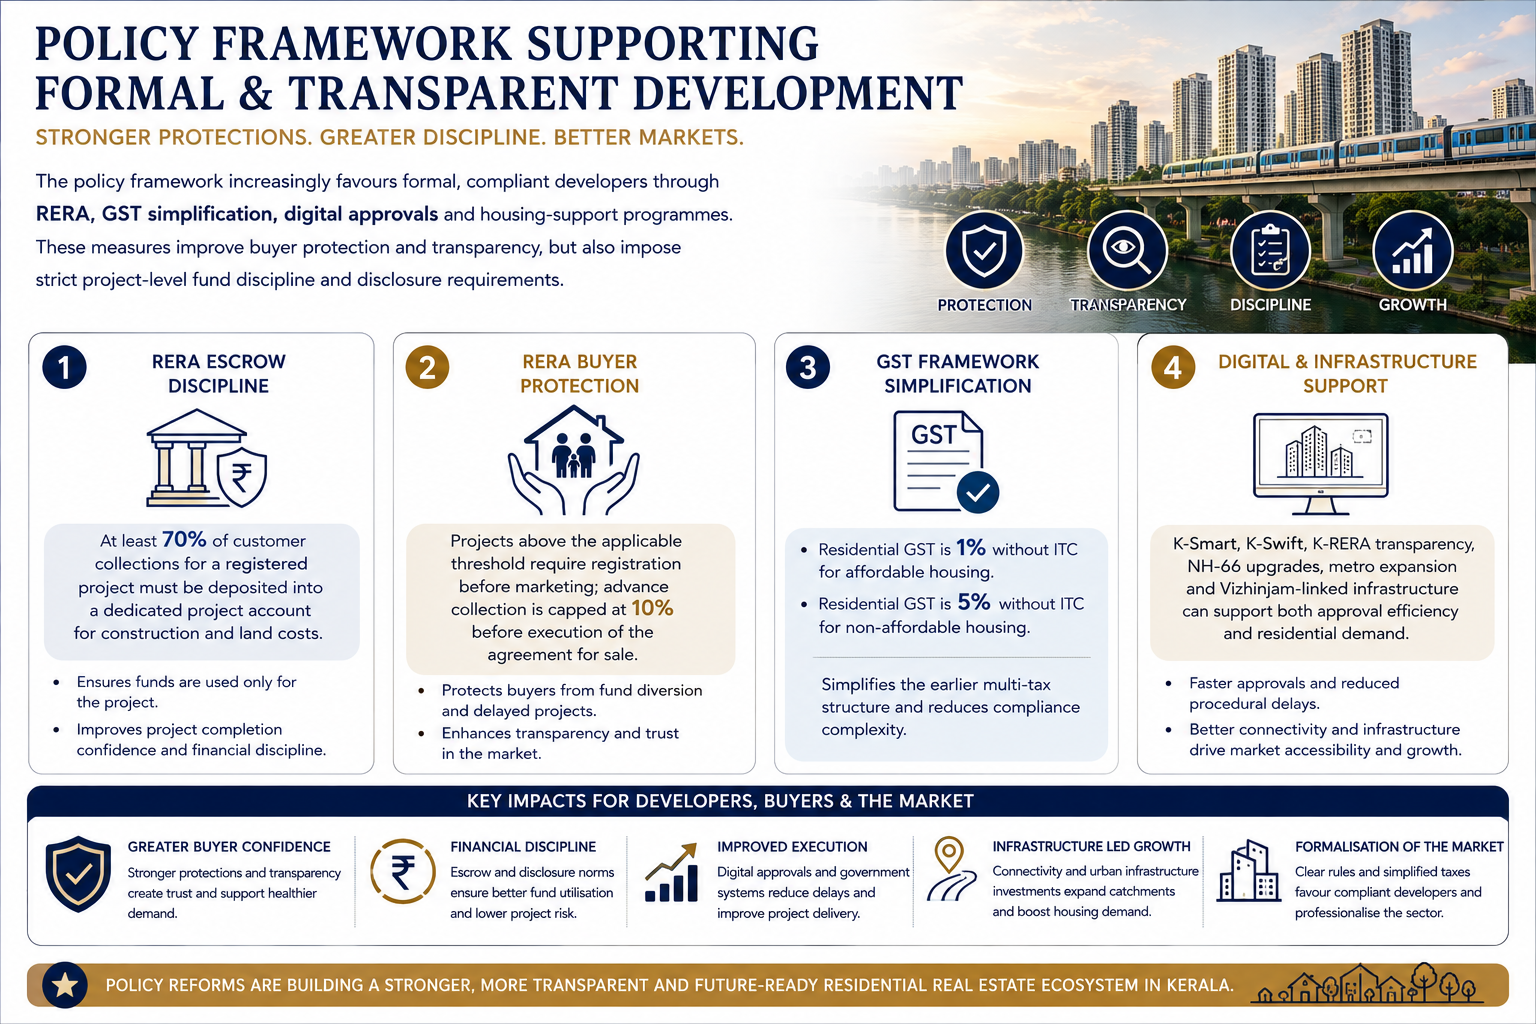
Government Policy Support
The policy framework increasingly favours formal, compliant developers through RERA, GST simplification, digital approvals and housing-support programmes. These measures improve buyer protection and transparency, but also impose strict project-level fund discipline and disclosure requirements. Infrastructure spending and Kerala's K-Smart / K-Swift systems can further improve project execution and market accessibility.
The key policies are:
RERA escrow discipline: At least 70% of customer collections for a registered project must be deposited into a dedicated project account for construction and land costs
RERA buyer protection: Projects above the applicable threshold require registration before marketing; advance collection is capped at 10% before execution of the agreement for sale
GST framework: Residential GST is 1% without ITC for affordable housing and 5% without ITC for non-affordable housing, simplifying the earlier multi-tax structure
Digital / infrastructure support: K-Smart, K-Swift, K-RERA transparency, NH-66 upgrades, metro expansion and Vizhinjam-linked infrastructure can support both approval efficiency and residential demand
Fundraise/Future Plans
Shareholding
Pre-issue shareholding
Promoter Holding 0.0%
Post-Issue Shareholding
Promoter Holding 0.0%
Category
Pre-Issue%Post-Issue%
Promoters
Kochouseph Thomas Chittilappilly
67.3%46.6%
K. Chittilappilly Trust
24.7%17.1%
Total Promoter Holding
92.0%63.7%
Additional Shareholders
0.0%0.0%
Total Additional Holding
0.0%0.0%
Total Shareholding
92.0%63.7%
- Overview
- Business
- Financial Highlights
- Industry Overview
- Fundraise/Future Plans
- Documentation
Get the Preqt App and keep in touch around the clock!
 Monitor your investments in real-time.
- Receive tailored deal suggestions.
- Get real-time updates and alerts.
