

Vishal Nirmiti
Building Infrastructure with PrecisionStrength Behind Infrastructure
IPO Summary (PreQT)
Vishal Nirmiti Limited is a civil engineering, manufacturing and construction company with a core position in railway PSC sleepers and an expanding MS-pipe / penstock fabrication and infrastructure-services business. FY26 revenue from operations was INR 338.7 Cr, EBITDA INR 51.1 Cr and PAT INR 25.0 Cr; growth moderated to 6.3% at revenue level after the sharp FY25 step-up, while EBITDA margin improved to 15.1%. The Company had an order book of approximately INR 581.8 Cr as of 30 June 2026 and operates a multi-state manufacturing footprint. The IPO raises up to INR 145.0 Cr of fresh capital, largely for working capital and debt repayment, alongside a INR 33.0 Cr OFS. Key diligence points are customer/government concentration, working-capital intensity, geographic concentration and the ability to convert the order book into cash without margin slippage.
IPO Review Rating
Above Avg
MainboardBuilding India’s Infrastructure Backbone Through Integrated Engineering Solutions
Vishal Nirmiti's stronger attributes are its 18.1% revenue CAGR, significant EBITDA-margin expansion, 33.7% ROE, 28.0% ROCE, positive operating cash generation, declining leverage and ₹682.5 Cr order-in-hand. The underlying railway-sleeper and MS-pipe markets also benefit from structural infrastructure spending.
The principal concerns are customer concentration, with Indian Railways alone contributing 40.56% of FY26 revenue and the top 10 customers contributing 92.91%; material related-party activity; ongoing litigation; residual leverage of 1.0x debt/equity; and promoter-group monetisation through the OFS.
Valuation is also relatively demanding. The 23.4x post-issue P/E is approximately 62% above the RHP peer average, while the ~12.9x EV/EBITDA is approximately 26% above the current peer average. Subscription, QIB demand and GMP remain the key pending variables.
PARAMETER
WEIGHT
SCORE
KEY FACTORS
Financial Performance
40.0%
4.0/5
Vishal Nirmiti has demonstrated strong margin expansion, improving leverage, high return ratios and healthy operating cash conversion. The principal financial concerns are slowing FY26 revenue growth and substantial dependence on Indian Railways and a concentrated customer base.
Show more
Detailed Analysis
The Company recorded an 18.1% FY24–FY26 revenue CAGR, although FY26 revenue growth moderated materially to 6.3% YoY after 31.1% growth in FY25
The Company's EBITDA margin expanded significantly from 9.5% in FY24 to 15.1% in FY26, demonstrating meaningful improvement in operating profitability
The Company's PAT margin improved from 1.4% in FY24 to 7.4% in FY26, although it remained broadly stable compared with 7.4% in FY25
The Company's debt-to-equity ratio improved substantially from 2.4x in FY24 to 1.0x in FY26, although leverage remains meaningful in absolute terms
The Company generated a strong 33.7% ROE in FY26, demonstrating efficient utilisation of shareholder capital despite moderating from FY25
The Company generated ₹27.2 Cr of operating cash flow in FY26 against ₹25.0 Cr of PAT, indicating healthy cash conversion, while operating cash flow remained positive throughout FY24–FY26.
Industry
15.0%
3.0/5
Vishal Nirmiti operates in infrastructure categories with healthy medium-term demand visibility, particularly railway sleepers and MS pipes. The main offsets are tender dependence, government-customer concentration, regulatory approvals, steel/raw-material volatility and increasing competitive intensity
Show more
Detailed Analysis
Indian Railways' concrete-sleeper consumption is projected to increase from 17.9 million units in FY25 to 29.4 million units by FY31, implying approximately 8.6% CAGR, while India's MS pipes and tubes market is projected to grow at 11.8% CAGR through FY30
Railway-sleeper manufacturing is subject to stringent Indian Railways and RDSO technical approvals and procurement standards, creating meaningful compliance requirements but also barriers to entry
The Company has operations and customers across multiple Indian states and has scope to broaden its private-sector and infrastructure customer base, although the current revenue profile remains predominantly domestic
Management
15.0%
3.0/5
The Company benefits from deeply experienced promoters, 50% Board independence and zero promoter pledge. The principal concerns are related-party intensity, limited listed-company Board experience, outstanding litigation and an OFS by a promoter-group entity
Show more
Detailed Analysis
Chairman and Whole-Time Director Brij B. Tapadiya has more than 45 years of experience in railway-sleeper manufacturing and infrastructure, while other promoter-directors also possess substantial operating experience
Four of the Company's eight Directors are Independent Directors, resulting in 50.0% Board independence, although the RHP states that the Directors lack prior experience as directors of other listed Indian companies
No promoter shares are currently pledged, but the Company and promoters are involved in several disclosed criminal, tax and civil proceedings, warranting a governance deduction despite the absence of current SEBI or stock-exchange disciplinary action
Related-party activity is material, including FY26 related-party purchases equal to 15.1% of material purchases, related-party job-work revenue equal to 5.2% of revenue and related-party finance costs equal to 26.8% of total finance cost
Valuation
20.0%
3.0/5
Vishal Nirmiti has strong return ratios and improving profitability, but its 23.25x P/E and ~12.9x EV/EBITDA both trade at premiums to the selected peer set. The P/E premium is particularly meaningful at approximately 62%
Show more
Detailed Analysis
Vishal Nirmiti's 23.3x post-issue P/E is approximately 62.1% above the 14.4x peer average, indicating a substantial earnings-multiple premium despite its stronger return ratios
Vishal Nirmiti's ~12.9x post-issue EV/EBITDA is approximately 25.9% above the current ~10.3x peer average, indicating a moderate enterprise-value premium
The issue is valued at approximately 5.0x historical FY26 book value, although the fresh issue reduces the approximate post-issue P/B to ~2.5x before issue expenses
Merchant Banker Track Record
10.0%
5.0/5
Saffron has a credible mainboard execution history with strong subscription performance in several recent mandates. Its record is positive overall, but it is less consistent than the strongest BRLM franchises and therefore does not receive a near-full score
Show more
Detailed Analysis
Saffron's broader tracked mainboard history shows five of seven IPOs listing above issue price, representing a positive-listing rate of approximately 71%, although individual outcomes have varied considerably
Recent mandates have attracted healthy demand, with Tolins Tyres, Udayshivakumar Infra and DCX Systems receiving approximately 25x, 32x and 70x subscriptions, respectively
Approximately 71% of Saffron's tracked mainboard issues listed positively, which represents a reasonably good but not exceptional success rate
TOTAL
100%
3.6/5
Weighted Composite Score
Issue Price
₹208.0 to ₹220.0
As of 30 Sep 2026
GMP
₹2.0
As of 30 Sep 2026
Estimated Gain / Loss
+0.9%
Lot Size
68.0 Shares
Grey Market Premium (GMPs) are shared for knowledge purpose only. PrEqt doesn’t promote or execute the trades.
| Issue size | |
|---|---|
| Overall | ₹178.0 Cr |
| Fresh Issue | ₹145.0 Cr |
| Offer for Sale | ₹33.0 Cr |
Minimum Investment
₹14,960.0 / 4,624 shares

Merchant Banker
Saffron Capital Advisors Pvt.Ltd.
Saffron Capital Advisors Pvt.Ltd.
IPO Document
Offer Start Date
Offer End Date
Valuation
Revenue (FY'26)
PAT (FY'26)
Issue Size
Face Value
₹ 10.0Offer Price
₹ 220.0Lot Size
68.0 sharesSale Type
Fresh capital cum OFSPAT (FY'26)
₹ 25.0 CrPAT Margin (FY'26)
7.4 %P/E Multiple
23.2xEBITDA (FY'26)
₹ 51.1 CrCAGR Growth 2Y
18.1 %ROE (FY'26)
33.7 %ROCE (FY'26)
28.0 %Price to Book Value
2.5xDebt/Equity
1.0xCompany Website
www.vishalnirmiti.comExplore new deals
Overview
Fund Allocation
Total: ₹0 CrSource:Company DRHP
Timeline
IPO Open Date
To Be Announced
IPO Close Date
To Be Announced
Tentative Allotment
To Be Announced
Initiation of Refunds
To Be Announced
Credit of Shares to Demat
To Be Announced
Tentative Listing Date
To Be Announced
Business
Business Model
Geographical Presence
Sales Channel
Key Risk Factor
Financial Highlights
Income Statement
Revenue growth with EBITDA and PAT margins
| Financial Metric | FY 2024 | FY 2025 | FY 2026 |
|---|---|---|---|
| Revenue (₹ Cr) | 242.9 | 318.5 | 338.7 |
| Growth (%) | -8.9% | 31.1% | 6.3% |
| EBITDA (₹ Cr) | 23.1 | 46.5 | 51.1 |
| EBITDA Margin (%) | 9.5% | 14.6% | 15.1% |
| PAT (₹ Cr) | 3.5 | 23.6 | 25.0 |
| PAT Margin (%) | 1.4% | 7.4% | 7.4% |
OBSERVATIONS & INSIGHTS
Revenue declined 8.9% in FY24 before rebounding 31.1% in FY25 as order execution improved and the services / MS-pipe fabrication vertical scaled. FY26 growth moderated to 6.3%, indicating a more normalised growth year after the FY25 step-up
EBITDA nearly doubled from INR 23.1 Cr in FY24 to INR 46.5 Cr in FY25, while margin expanded from 9.5% to 14.6%. The main driver was a more favourable mix, including higher execution in the relatively higher-margin MS-pipe / services division
PAT increased from INR 3.5 Cr in FY24 to INR 23.6 Cr in FY25 as operating-margin expansion and scale flowed through the P&L. FY26 PAT rose only 5.7% to INR 25.0 Cr, broadly in line with slower revenue growth, while PAT margin remained stable at ~7.4%
Balance Sheet
| Financial Metric | FY 2024 | FY 2025 | FY 2026 |
|---|---|---|---|
| Net Worth | ₹ 38.1 Cr | ₹ 61.1 Cr | ₹ 86.3 Cr |
| Total Assets | ₹ 242.0 Cr | ₹ 296.6 Cr | ₹ 334.9 Cr |
| Total Borrowing | ₹ 91.8 Cr | ₹ 88.1 Cr | ₹ 87.4 Cr |
| Reserves & Surplus | ₹ 36.8 Cr | ₹ 59.8 Cr | ₹ 67.0 Cr |
OBSERVATIONS & INSIGHTS
Total assets expanded 22.5% in FY25 and 12.9% in FY26 as the operating base and working-capital requirement increased. Inventory and receivables were major components of the asset build
Net worth rose from INR 38.1 Cr in FY24 to INR 86.3 Cr in FY26, supported by retained profits and pre-IPO capital changes. This equity growth is the main reason leverage ratios improved despite borrowings remaining around INR 87-92 Cr
Reserves & surplus increased from INR 36.8 Cr to INR 67.0 Cr over FY24-FY26, reflecting earnings accumulation. The rise in equity also diluted ROE in FY26 even though PAT increased
Total borrowings declined only modestly, from INR 91.8 Cr in FY24 to INR 87.4 Cr in FY26; hence the INR 19.0 Cr IPO debt-repayment allocation should be viewed as a targeted deleveraging measure rather than a rescue of an overextended balance sheet
Receivables grew faster than revenue in FY26, so balance-sheet quality should be monitored through collections and CFO rather than only accounting profit
Cash Flow
| Financial Metric | FY 2024 | FY 2025 | FY 2026 |
|---|---|---|---|
CFO in Cr Cash generated from core business operations. | +22.2 Cr | +29.0 Cr | +36.8 Cr |
CFI in Cr Cash used in / generated from investing activities. | +7.4 Cr | -25.3 Cr | -18.8 Cr |
CFF in Cr Cash from / used in financing activities. | -23.9 Cr | -11.1 Cr | -13.1 Cr |
Working Capital
| Efficiency Metric | FY 2023 | FY 2024 | FY 2025 |
|---|---|---|---|
Debtor Days Average number of days taken to collect customer payments. | - | - | - |
Creditor Days Average time taken to pay suppliers and vendors. | - | - | - |
Inventory Days Average number of days inventory remains unsold. | - | - | - |
CCC (Cash Conversion Cycle) (Debtor Days + Inventory Days - Creditor Days) | - | - | - |
Financial Ratios
Measures the company’s leverage relative to shareholder equity.
OBSERVATIONS & INSIGHTS
Leverage improved consistently as Debt/Equity reduced from 2.4x in FY24 to 1.0x in FY26 as debt was broadly stable-to-lower while net worth increased materially
ROE and ROCE peaked in FY25 after the sharp earnings step-up; both moderated in FY26 because incremental equity/capital grew faster than profit, not because operating margins deteriorated
Current liquidity remains relatively tight around 1.0x-1.1x, which is consistent with the large working-capital allocation in the IPO objects
Industry Overview
Industry Drivers
Railway Modernisation & Rising Concrete Sleeper Demand
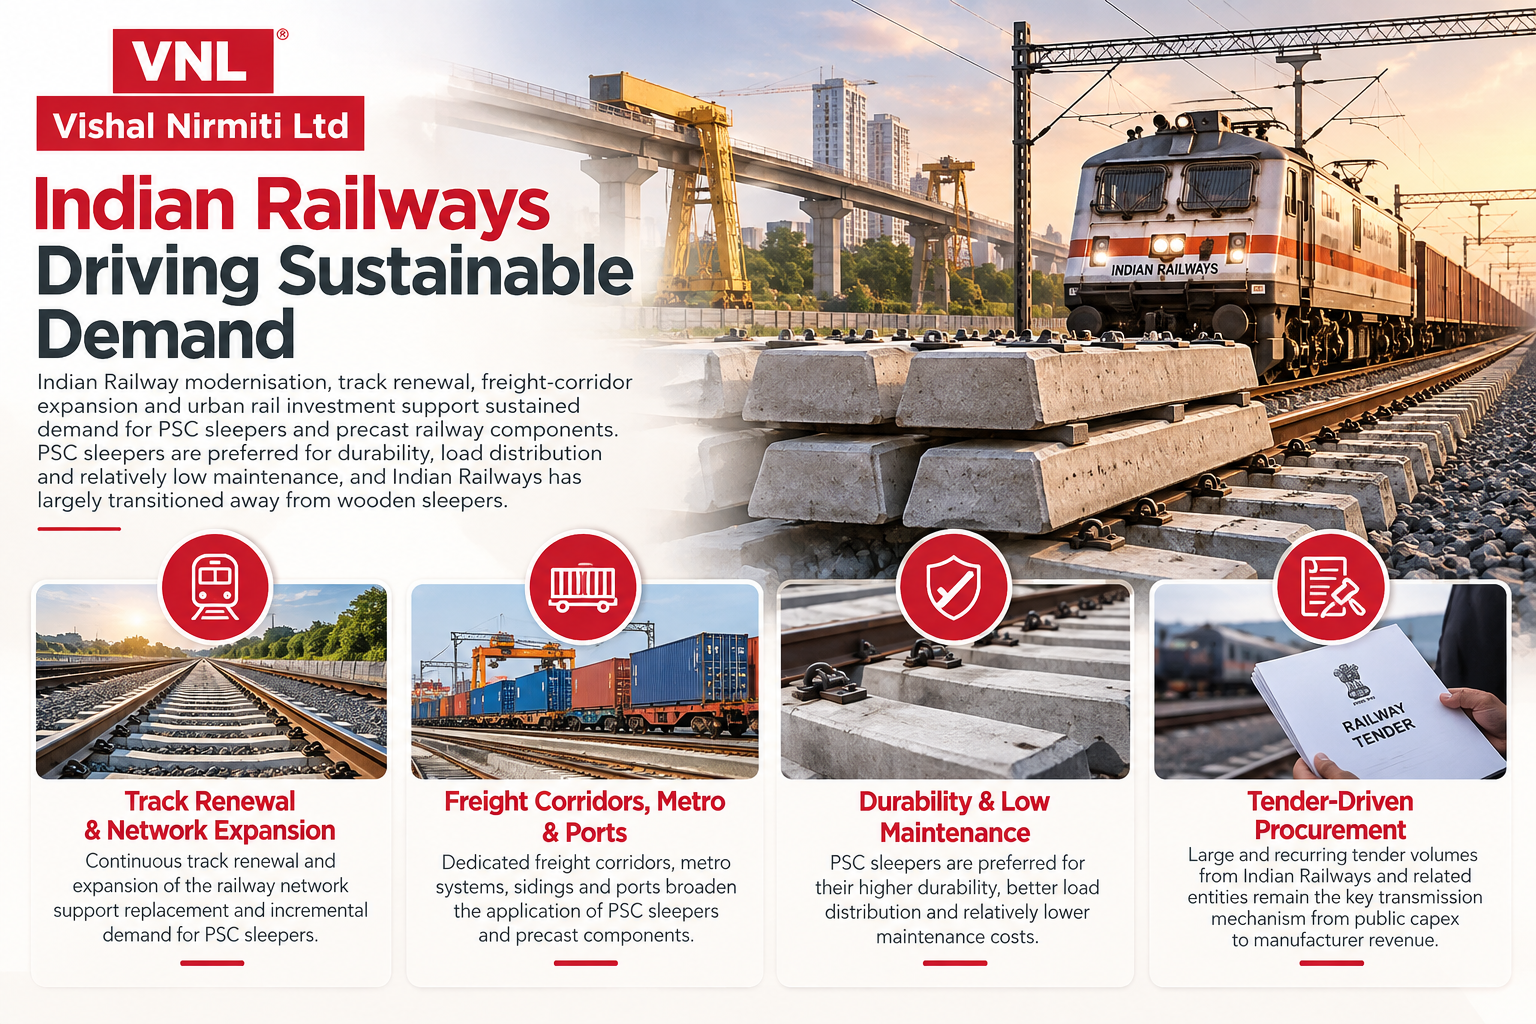
India’s railway concrete-sleeper industry has a strong structural demand outlook supported by network expansion, track renewal, freight corridors and higher axle-load requirements. Annual concrete-sleeper consumption by Indian Railways increased from 10.1 million units in FY21 to 16.7 million units in FY24, representing an 18.4% CAGR, and was estimated at 17.9 million units in FY25. D&B projects annual consumption to increase further to 29.4 million units by FY31, creating sustained replacement as well as incremental demand for PSC sleepers.
The key details are:
Concrete-sleeper consumption increased from 10.1 million units in FY21 to 17.9 million units in FY25
D&B projects consumption at 19.3 million units in FY26E, 22.5 million units in FY28E and 29.4 million units in FY31E
Dedicated Freight Corridors and higher axle-load railway networks require heavy-duty PSC sleepers, creating incremental demand beyond routine track replacement
Indian Railways procurement requires compliance with stringent RDSO and IRS technical specifications, creating qualification and execution barriers for new entrants
Large and Growing MS Pipes & Tubes Market
India’s mild-steel pipes and tubes market is benefiting from investments across water supply, irrigation, urban infrastructure, oil & gas, industrial projects and renewable-energy infrastructure. Based on the D&B market estimates, the industry expanded from approximately INR 120,350.0 Cr in FY21 to INR 185,090.0 Cr in FY25. The market is projected to reach approximately INR 322,870.0 Cr by FY30, implying an 11.8% CAGR during FY25-FY30.
The key details are:
Market size: Approximately INR 185,090.0 Cr in FY25, projected to reach INR 322,870.0 Cr by FY30
Historical market size: Approximately INR 120,350.0 Cr in FY21, indicating substantial expansion over FY21-FY25
Domestic MS-pipe production increased from 6.1 million tonnes in FY21 to 9.2 million tonnes in FY25 and is projected to reach 15.2 million tonnes by FY30
Domestic consumption increased from 4.6 million tonnes in FY21 to 7.1 million tonnes in FY25 and is projected at approximately 12.0 million tonnes by FY30
Pumped Storage & Renewable-Energy Infrastructure
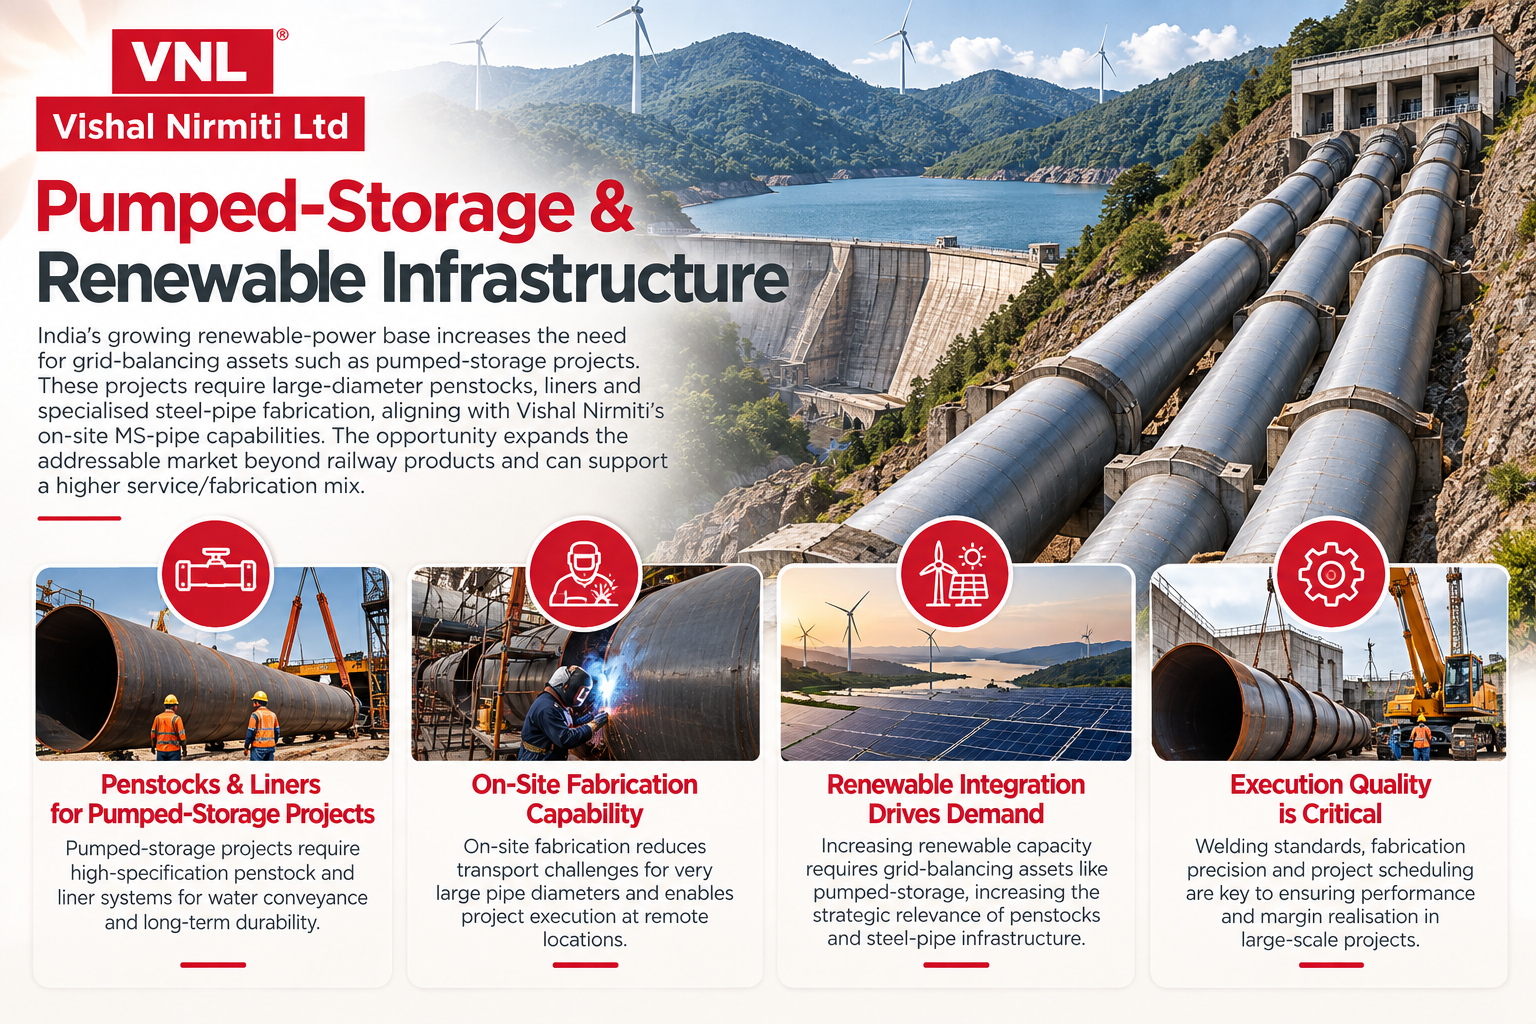
India’s increasing renewable-energy capacity is creating a structural requirement for grid-scale energy storage. Pumped Storage Projects are emerging as one of the principal solutions because they can provide large-scale storage and grid balancing. Such projects require large-diameter, high-pressure steel penstocks and liners, directly aligning with Vishal Nirmiti’s MS-pipe fabrication capabilities.
The key details are:
Identified PSP potential: Approximately 267 GW across India
Under construction: Approximately 15.87 GW across 11 projects
CEA-concurred pipeline: Approximately 8.14 GW across another six projects
Required pumped-storage capacity is projected to rise from approximately 7.45 GW in FY27 to 26.69 GW by FY32
Risks in the Industry
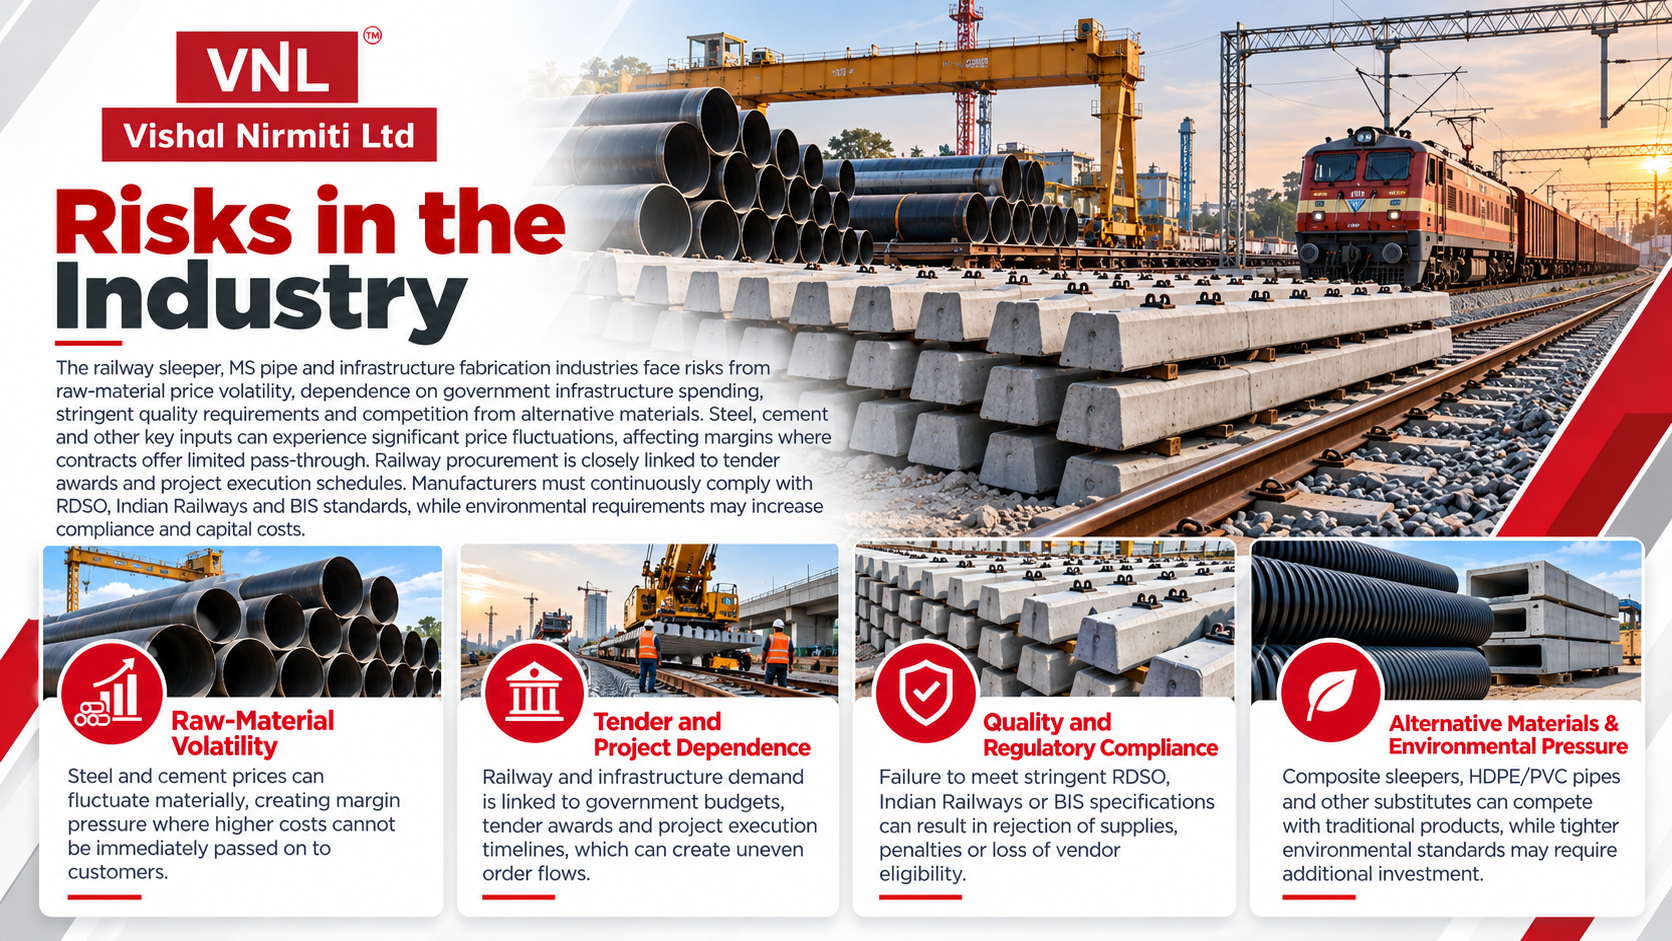
The railway sleeper, MS pipe and infrastructure fabrication industries face risks from raw-material price volatility, dependence on government infrastructure spending, stringent quality requirements and competition from alternative materials. Steel, cement and other key inputs can experience significant price fluctuations, affecting margins where contracts offer limited pass-through. Railway procurement is also closely linked to tender awards and project execution schedules. At the same time, manufacturers must continuously comply with RDSO, Indian Railways and BIS standards, while environmental requirements may increase compliance and capital costs.
The key risks are:
Steel and cement prices can fluctuate materially, creating margin pressure where higher costs cannot be immediately passed on to customers
Railway and infrastructure demand is linked to government budgets, tender awards and project execution timelines, which can create uneven order flows
Failure to meet stringent RDSO, Indian Railways or BIS specifications can result in rejection of supplies, penalties or loss of vendor eligibility
Composite sleepers, HDPE/PVC pipes and other substitutes can compete with traditional products, while tighter environmental standards may require additional investment
Government Policy Support
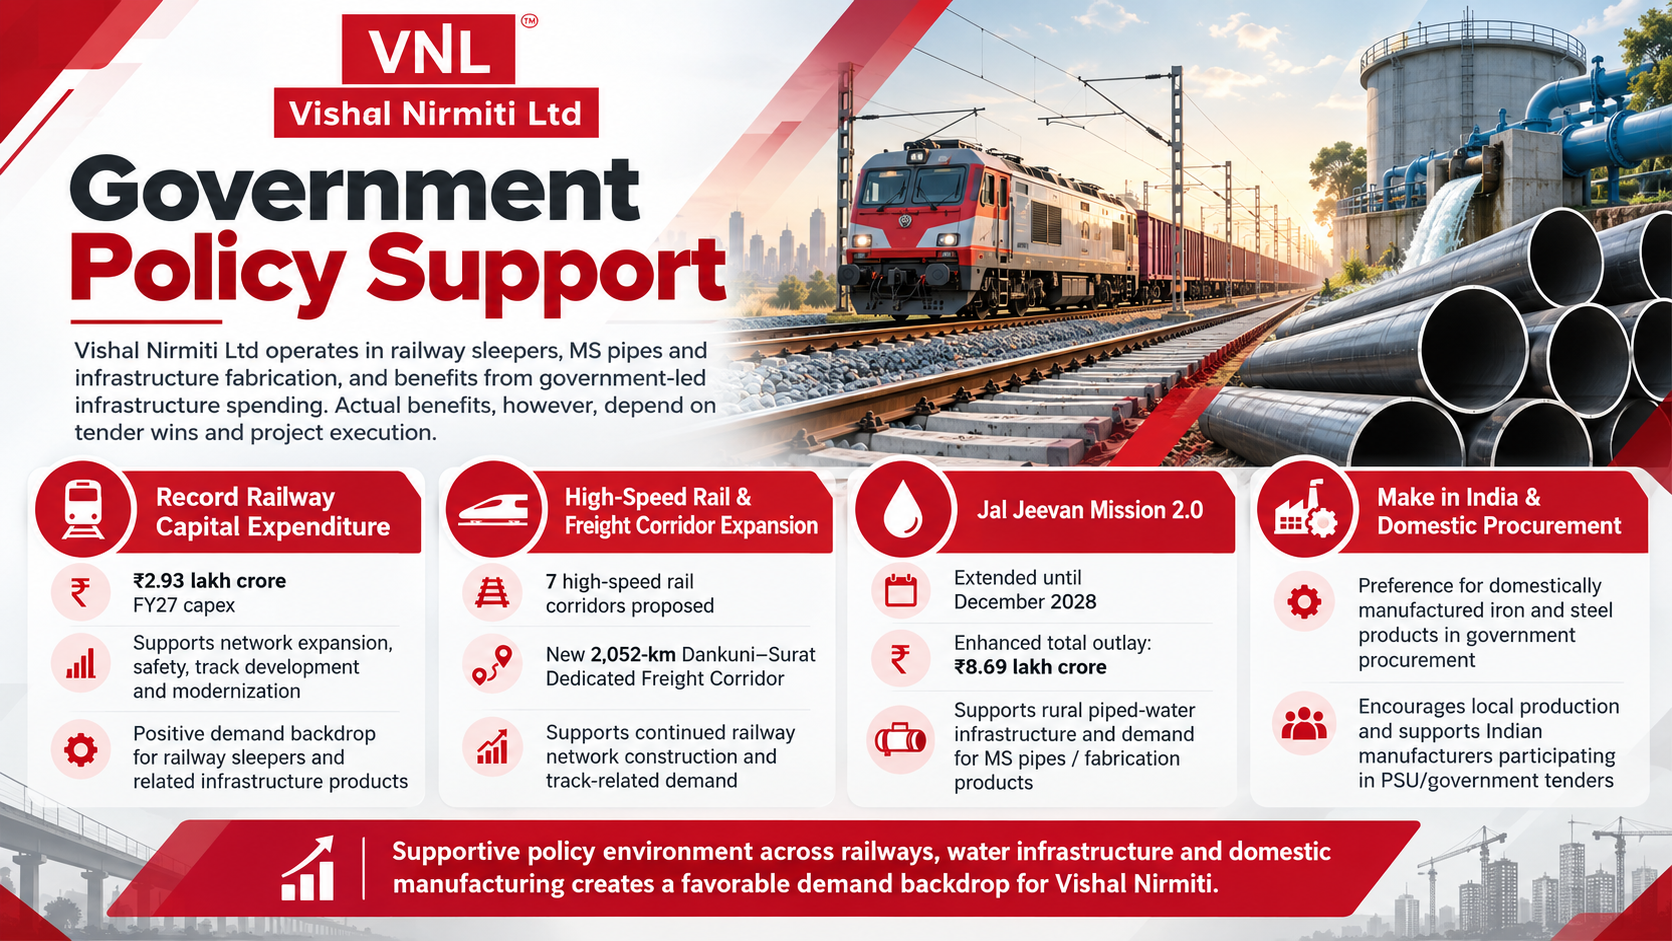
Vishal Nirmiti operates in segments that are directly linked to government-led infrastructure spending, particularly railway sleepers, MS pipes and infrastructure fabrication. The policy environment remains supportive, with the Government continuing to raise capital expenditure on railways, freight corridors, water infrastructure and domestic manufacturing. Indian Railways has received record capital allocations for network expansion, safety and new lines, while programmes such as Jal Jeevan Mission support sustained demand for pipes and water-distribution infrastructure. In addition, Make in India and domestic procurement preferences for iron and steel products can support local manufacturers participating in government and PSU tenders.
The key policies are:
Indian Railways has planned INR 2.93 lakh crore of capex for FY27, with spending directed toward capacity expansion, safety, track development and modernisation. This supports long-term demand for railway sleepers and associated infrastructure products
The Union Budget 2026–27 proposed seven high-speed rail corridors and a new 2,052-km Dankuni–Surat Dedicated Freight Corridor, supporting continued railway network construction and demand for track-related components
The Government extended JJM until December 2028, with an enhanced total outlay of INR 8.69 lakh crore. Continued investment in rural piped-water infrastructure can support demand for MS pipes and related fabrication products
Government procurement policy provides preference to domestically manufactured iron and steel products, encouraging local production and creating a supportive environment for Indian steel-product
Fundraise/Future Plans
Shareholding
Pre-issue shareholding
Promoter Holding 0.0%
Post-Issue Shareholding
Promoter Holding 0.0%
Category
Pre-Issue%Post-Issue%
Promoters
Brij B. Tapadiya
3.1%2.4%
Ajay Bhagwandas Tapadiya
3.2%2.4%
Pavan Vithaldas Tapadiya
4.4%3.3%
Akhil Ranchod Tapadiya
3.1%2.4%
Naveen Tapadiya
6.3%4.8%
Rajendrakumar Badrinarayan Tapadiya
3.3%2.5%
Suyash Vithaldas Tapadiya
4.4%3.3%
Vedant Tapadiya
6.3%4.8%
Keshav Tapadiya
3.1%2.4%
Promoter Group
36.1%21.1%
Total Promoter Holding
73.5%49.4%
Additional Shareholders
Other Shareholders
26.6%50.6%
Total Additional Holding
26.6%50.6%
Total Shareholding
100.1%100.0%
- Overview
- Business
- Financial Highlights
- Industry Overview
- Fundraise/Future Plans
- Documentation
Get the Preqt App and keep in touch around the clock!
 Monitor your investments in real-time.
- Receive tailored deal suggestions.
- Get real-time updates and alerts.
