


Yogiji Digi Limited
Engineering Steel ProcessingAutomation Meets Steel
Unlisted Review and Rating
Considerable
DRHP FiledOverall Recommendation
Yogiji Digi is one of the stronger fundamentally backed unlisted companies in this scoring set. The investment case is supported by actual audited operating performance rather than only forward expectations. Revenue increased from INR 396.5 Cr in FY24 to INR 626.1 Cr in FY26, while PAT increased from INR 19.9 Cr to INR 40.4 Cr. EBITDA margin simultaneously expanded from 7.7% to 10.8%. The strongest forward indicator is the approximately INR 1,313.0 Cr order book, equivalent to more than 2.0x FY26 revenue. This provides substantial revenue visibility and positions Yogiji to benefit from India's planned steel-capacity expansion. The investment case nevertheless has three material risks. First, the top ten customers account for approximately 82.1% of revenue. Second, working-capital days have increased to approximately 89.0 days, while gross borrowings reached approximately INR 188.9 Cr. Third, at INR 285.0 per share, investors are already paying approximately INR 1,616.0 Cr, equivalent to around 40.0x FY26 PAT.
The difference versus many expensive unlisted companies is that Yogiji already has real earnings, improving margins, positive cash flow and strong ROE. The valuation therefore looks demanding rather than fundamentally disconnected from the business
PARAMETER
WEIGHT
SCORE
KEY FACTORS
Financial Performance
25.0%
4.0/5
Strong growth, expanding margins, healthy ROE and recovered cash generation are positives; rising leverage, working capital and customer concentration remain key risks
Show more
Detailed Analysis
Revenue increased 30.5% in FY26 to INR 626.1 Cr, while FY24-FY26 revenue CAGR was a strong 25.7%
Core EBITDA increased to INR 67.7 Cr, with margin improving consistently from 7.7% to 10.8% over FY24-FY26
PAT increased to INR 40.4 Cr and margin expanded from 5.0% in FY24 to 6.5% in FY26
D/E remains manageable at 0.9x, but gross borrowings more than doubled during FY26 to approximately INR 188.9 Cr
FY26 ROE of approximately 21.3% remains strong despite substantial growth in the Company's equity base
Industry
25.0%
4.0/5
Strong steel capex, import substitution, high engineering barriers and an order book above INR 1,300.0 Cr create an attractive structural opportunity
Show more
Detailed Analysis
India's steel-production capacity is targeted to reach 300.0 MT by FY31, requiring substantial investment in downstream processing infrastructure
Government policy strongly encourages domestic steel capacity, value-added products and import substitution, supporting equipment demand
FY26 exports represented approximately 19.5% of revenue, demonstrating genuine international capability, though India remains dominant
Management
25.0%
4.0/5
Deep promoter experience, strong technical leadership and clean audits are positives; promoter-linked transactions and family representation warrant routine monitoring
Show more
Detailed Analysis
Navneet Singh and Sameer Bansal each have more than 31.0 years of industry experience and long operating histories with Yogiji
Governance has been strengthened ahead of the proposed IPO through board expansion, independent directors and professional KMP appointments
RPTs appear disclosed and compliant, but promoter-family employment and promoter-linked transactions warrant ongoing monitoring
Valuation Metrics
25.0%
3.0/5
At approximately 40.0x FY26 earnings, Yogiji is not cheap, but strong growth, ROE and order visibility make the premium reasonably defensible
Show more
Detailed Analysis
At approximately 40.0x FY26 earnings, Yogiji is not cheap but remains reasonable for a high-growth specialist capital-equipment company
Approximately 26.3x EV/EBITDA incorporates a meaningful growth premium but remains supportable if the order book converts successfully
Approximately 7.7x book is expensive in isolation, although 21.3% ROE provides some justification for the premium
TOTAL
100%
3.8/5
Weighted Composite Score
Per Share Price
₹275.0
As of 24 Oct 2026
Lot Size
1,000.0 Shares
Minimum Investment
₹2,75,000.0 / 1,000 shares
Market Cap. (₹ Cr)
Revenue FY’26
PAT FY’26
P/E Multiple
Face Value
₹ 10.0Lot Size
1,000.0 sharesSale Type
Secondary SalePAT FY’26
₹ 40.4 CrPAT Margin (%)
6.5 %P/E Multiple
40.0xCAGR Growth 3Y
25.7 %ROE (FY’26)
21.3 %ROCE (FY’26)
17.7 %Price to Book Value ratio
7.7xMerchant banker appointed
✅ YesCompany Website
www.ydgroup.comDisclaimer: Unlisted shares are unregulated & illiquid. This is NOT investment advice. Please do your own due diligence before investing.
Minimum Investment
₹2,75,000.0 / 1,000 sharesShares Lot 1000 X 1
Investment amount
₹2,75,000.0
Overview
Business
Business Model
Geographical Presence
Sales Channel
Financial Highlights
Income Statement
Revenue growth with EBITDA and PAT margins
| Financial Metric | FY 2024 | FY 2025 | FY 2026 |
|---|---|---|---|
| Revenue (₹ Cr) | 396.5 | 479.7 | 626.1 |
| Growth (%) | - | 21.0% | 30.5% |
| EBITDA (₹ Cr) | 30.5 | 50.5 | 67.7 |
| EBITDA Margin (%) | 7.7% | 10.5% | 10.8% |
| PAT (₹ Cr) | 19.9 | 28.0 | 40.4 |
| PAT Margin (%) | 5.0% | 5.8% | 6.5% |
OBSERVATIONS & INSIGHTS
Revenue grew at a 25.7% two-year CAGR, with FY26 growth accelerating to 30.5% as domestic project execution increased
EBITDA grew faster than revenue and margin expanded by 3.1 percentage points to 10.8%, indicating operating leverage and improved execution mix
PAT doubled over two years to INR 40.4 Cr and margin improved to 6.5%, although finance cost and capital intensity remain important
Balance Sheet
| Financial Metric | FY 2024 | FY 2025 | FY 2026 |
|---|---|---|---|
| EQUITY & LIABILITIES | ₹ 360.2 Cr | ₹ 445.8 Cr | ₹ 644.3 Cr |
| Net Worth | ₹ 79.6 Cr | ₹ 169.3 Cr | ₹ 210.0 Cr |
| Share Capital | ₹ 1.9 Cr | ₹ 2.7 Cr | ₹ 56.7 Cr |
| Reserves & Surplus | ₹ 77.7 Cr | ₹ 166.6 Cr | ₹ 153.3 Cr |
| Total Liabilities | ₹ 280.6 Cr | ₹ 276.5 Cr | ₹ 434.3 Cr |
| Current Liabilities | ₹ 232.0 Cr | ₹ 223.0 Cr | ₹ 354.8 Cr |
| Borrowings | ₹ 33.5 Cr | ₹ 62.7 Cr | ₹ 138.3 Cr |
| Trade Payables | ₹ 65.8 Cr | ₹ 76.3 Cr | ₹ 139.3 Cr |
| Other Current Liabilities | ₹ 132.7 Cr | ₹ 84.0 Cr | ₹ 77.2 Cr |
| Non-Current Liabilities | ₹ 48.6 Cr | ₹ 53.5 Cr | ₹ 79.5 Cr |
| Borrowings | ₹ 23.2 Cr | ₹ 26.2 Cr | ₹ 50.6 Cr |
| Other Non-Current Liabilities | ₹ 25.4 Cr | ₹ 27.3 Cr | ₹ 28.9 Cr |
| ASSETS | ₹ 360.1 Cr | ₹ 447.2 Cr | ₹ 644.3 Cr |
| Current Assets | ₹ 271.2 Cr | ₹ 328.2 Cr | ₹ 430.6 Cr |
| Trade Receivables | ₹ 46.9 Cr | ₹ 122.6 Cr | ₹ 143.0 Cr |
| Inventory | ₹ 153.8 Cr | ₹ 115.4 Cr | ₹ 136.9 Cr |
| Cash & Cash Equivalents | ₹ 2.7 Cr | ₹ 5.2 Cr | ₹ 7.2 Cr |
| Other Current Assets | ₹ 67.8 Cr | ₹ 85.0 Cr | ₹ 143.5 Cr |
| Non-Current Assets | ₹ 88.9 Cr | ₹ 119.0 Cr | ₹ 213.7 Cr |
| Fixed Assets | ₹ 85.0 Cr | ₹ 110.8 Cr | ₹ 211.6 Cr |
| Other Non-Current Assets | ₹ 3.9 Cr | ₹ 8.2 Cr | ₹ 2.1 Cr |
OBSERVATIONS & INSIGHTS
Shareholders’ wealth increased to INR 210.0 Cr through retained profit, the FY26 share split and a 20:1 bonus issue. Bonus shares reclassified reserves rather than adding cash
Current and non-current borrowings increased to INR 188.9 Cr before lease liabilities, funding working capital and capital expenditure
Receivables and inventory together reached INR 279.9 Cr. These balances represented 43.4% of total assets and make execution and collection discipline critical
Fixed assets nearly doubled in FY26 to INR 211.6 Cr, reflecting a large expansion programme whose utilisation and returns remain to be demonstrated
Cash was only INR 7.2 Cr versus current borrowings of INR 138.3 Cr. Availability under sanctioned lines and restricted bank balances should be verified
Cash Flow
| Financial Metric | FY 2024 | FY 2025 | FY 2026 |
|---|---|---|---|
CFO (₹ Cr) Cash generated from core business operations. | +21.3 Cr | -47.3 Cr | +34.3 Cr |
CFI (₹ Cr) Cash used for investments and long-term assets. | -22.7 Cr | -36.4 Cr | -120.3 Cr |
CFF (₹ Cr) Cash flow related to funding and borrowings. | +2.8 Cr | +86.3 Cr | +88.0 Cr |
Working Capital
| Efficiency Metric | FY 2023 | FY 2024 | FY 2025 |
|---|---|---|---|
Debtor Days Average number of days taken to collect customer payments. | - | - | - |
Creditor Days Average time taken to pay suppliers and vendors. | - | - | - |
Inventory Days Average number of days inventory remains unsold. | - | - | - |
CCC (Cash Conversion Cycle) (Debtor Days + Inventory Days - Creditor Days) | - | - | - |
Financial Ratios
Measures the company’s leverage relative to shareholder equity.
OBSERVATIONS & INSIGHTS
ROE remained healthy at 21.3% but moderated as the equity base expanded and incremental capital had not fully matured
Leverage increased to 0.9x in FY26, reversing the FY25 improvement and increasing sensitivity to collections and project delays
Coverage stayed above 5.0x but declined in FY26 as finance cost rose faster than operating profit
The FY26 current ratio fell to approximately 1.2x, indicating limited liquidity headroom against short-term obligations
ROCE declined to 17.7% despite higher profit because working capital, fixed assets and debt expanded materially
Industry Overview
Industry Drivers
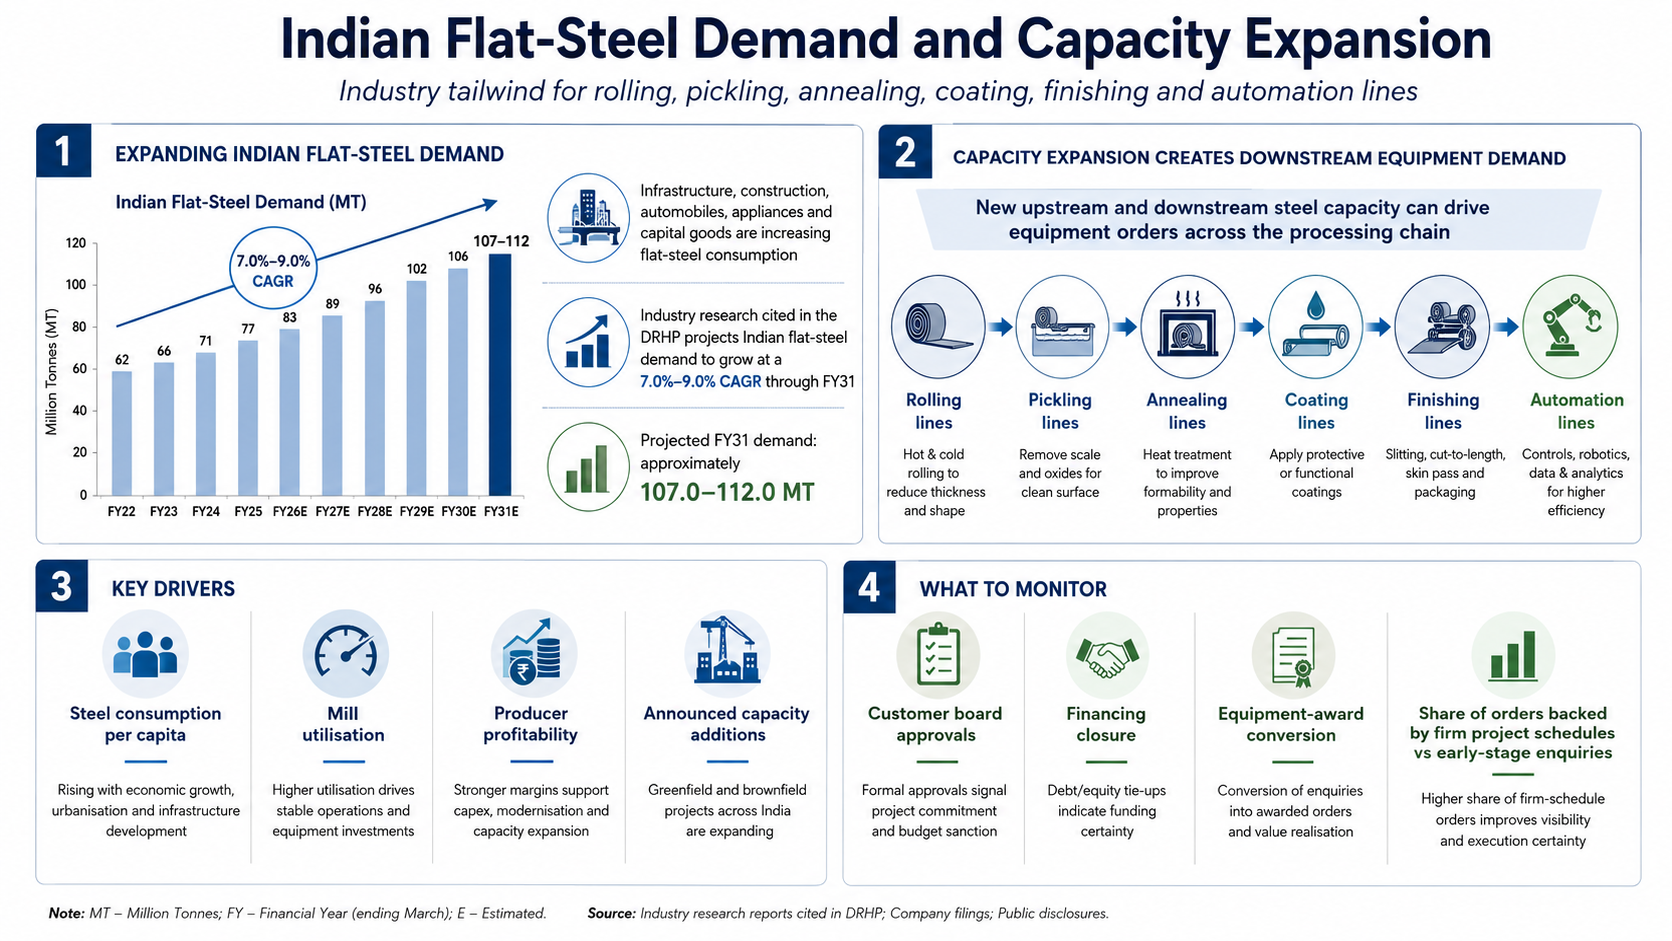
Indian flat-steel demand and capacity expansion
Infrastructure, construction, automobiles, appliances and capital-goods investment are increasing consumption of cold-rolled, galvanised and colour-coated steel. Industry research cited in the DRHP projects Indian flat-steel demand to expand at a 7.0%-9.0% CAGR through FY31 to approximately 107.0-112.0 MT
New upstream and downstream capacity can create demand for rolling, pickling, annealing, coating, finishing and automation lines. Key drivers: steel consumption per capita, mill utilisation, producer profitability and announced capacity additions
Customer board approvals, financing closure, equipment-award conversion and the share of orders supported by firm project schedules rather than early-stage enquiries should be monitored
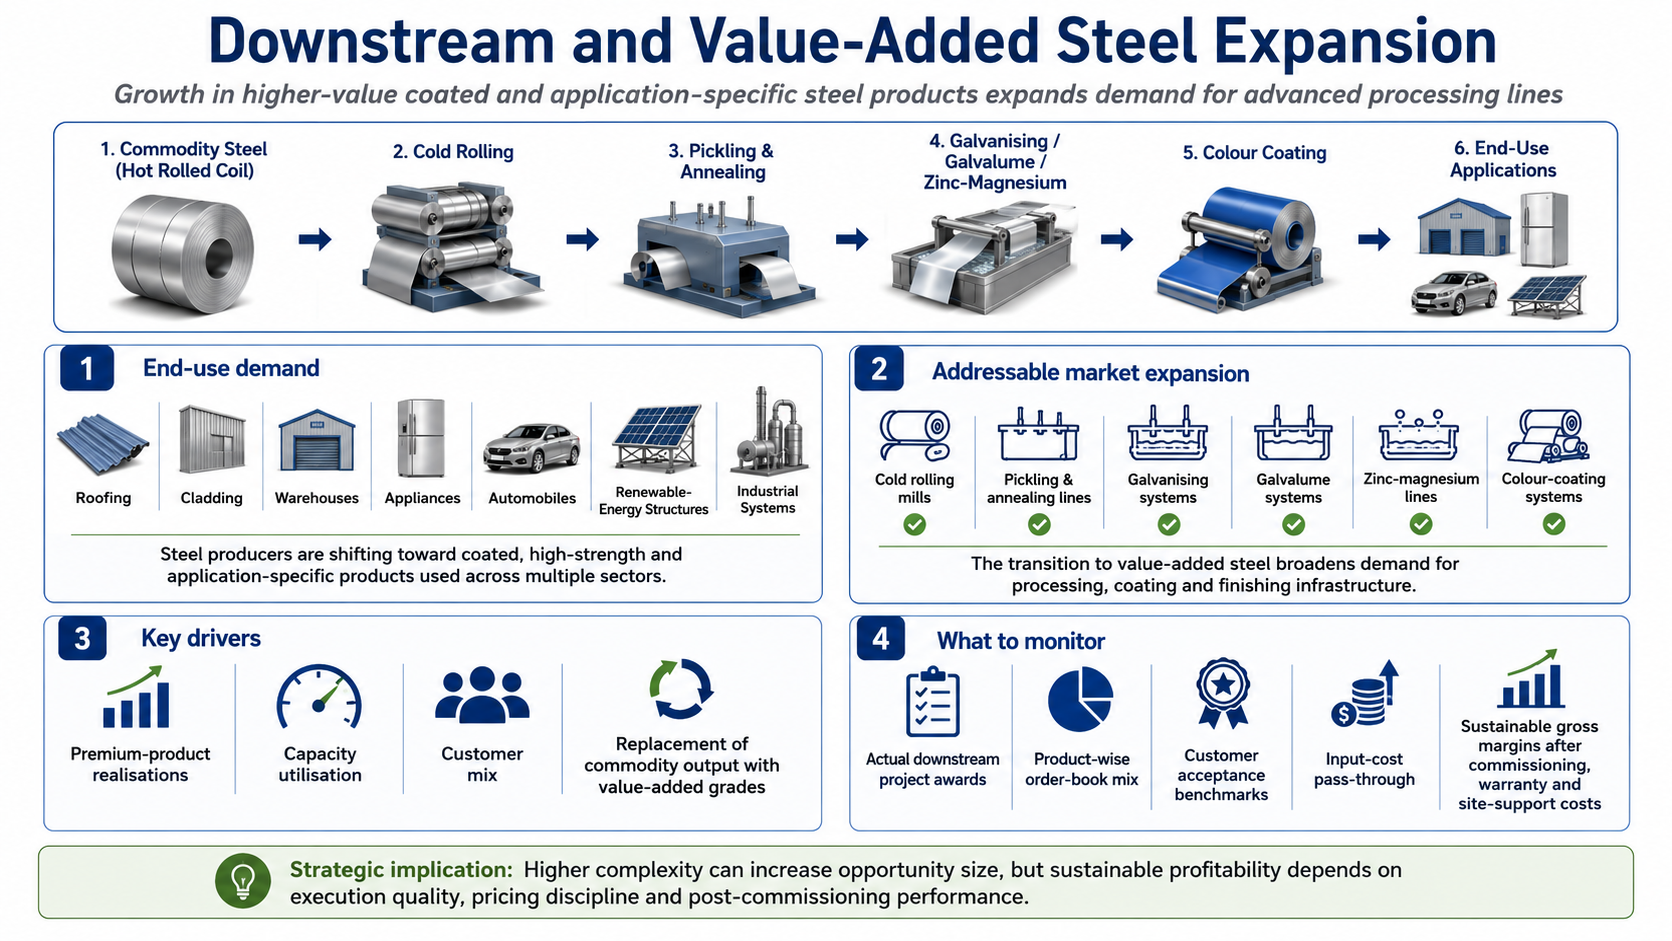
Downstream and value-added steel expansion
Steel producers are moving toward higher-value coated, high-strength and application-specific products used in roofing, cladding, warehouses, appliances, automobiles, renewable-energy structures and industrial systems
This transition requires cold rolling mills, pickling and annealing lines, galvanising, galvalume, zinc-magnesium and colour-coating systems, creating a broader addressable market for the Company
Key drivers are premium-product realisations, capacity utilisation, customer mix and replacement of commodity output with value-added grades
Actual downstream project awards, product-wise order-book mix, customer acceptance benchmarks, input-cost pass-through and whether incremental complexity produces sustainable gross margins after commissioning, warranty and site-support costs should be monitored
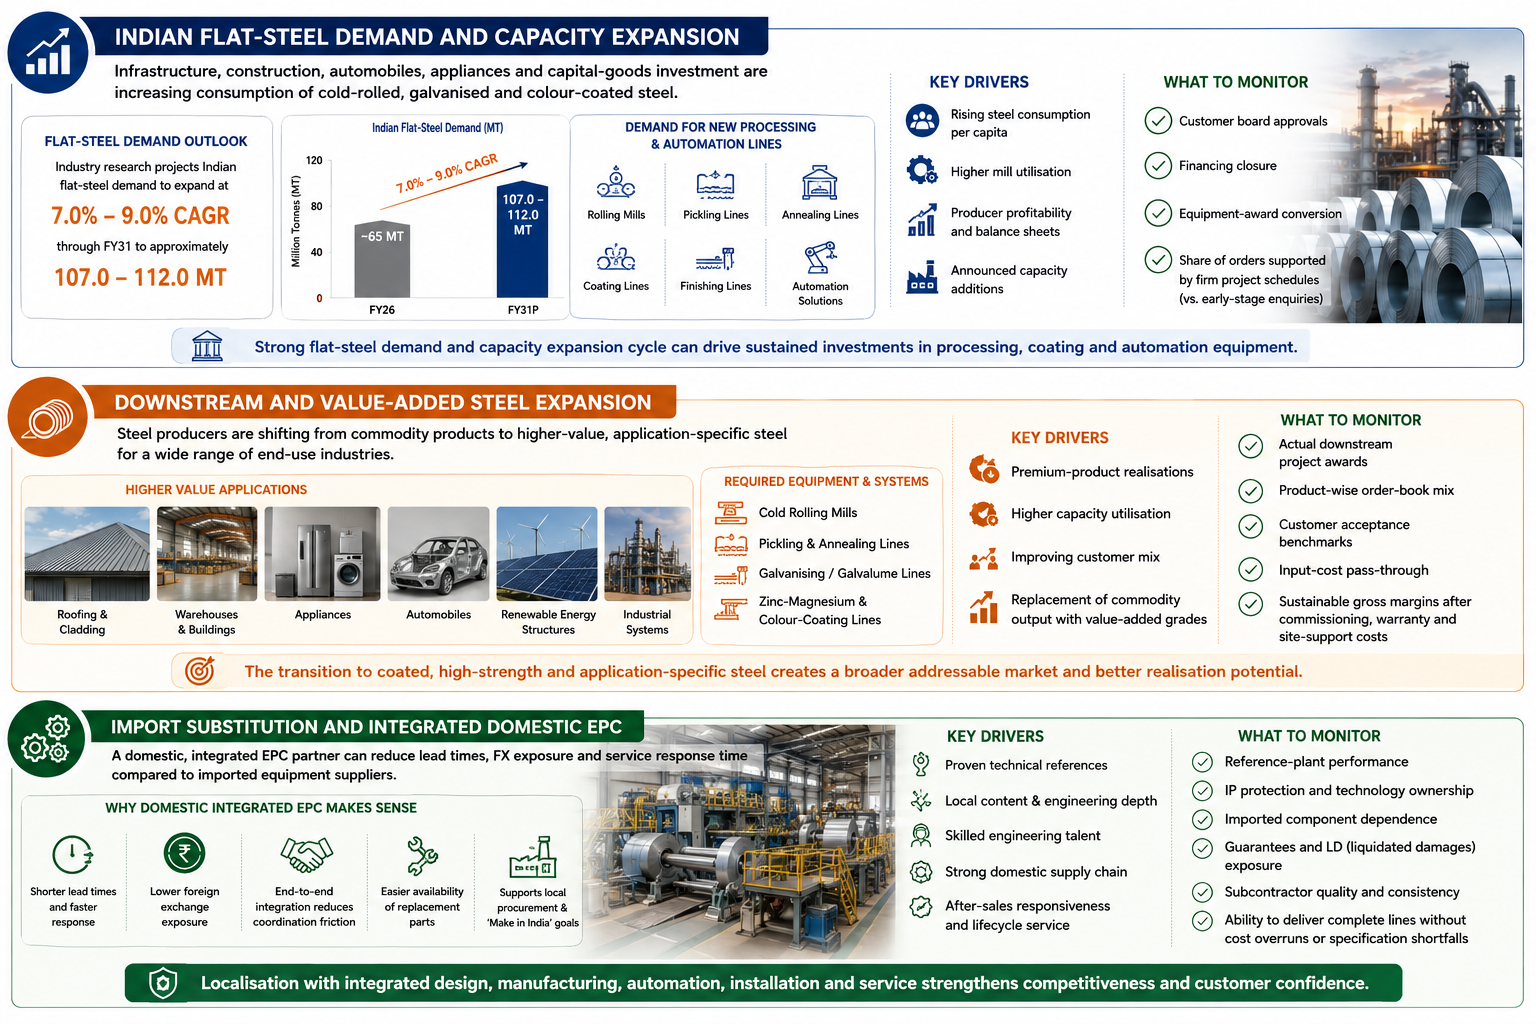
Import substitution and integrated domestic EPC
Steel-processing equipment has high engineering, process-control, fabrication, installation and commissioning requirements. Imported systems can involve long lead times, foreign-exchange exposure and distant service support, while a domestic supplier integrating design, machining, automation, erection and lifecycle service can shorten response times and reduce coordination friction. Localisation also supports customer procurement objectives and availability of replacement parts
Key drivers are technical references, local content, engineering talent, supply-chain depth and after-sales responsiveness
Reference-plant performance, intellectual-property protection, imported-component dependence, guarantees, liquidated-damages exposure, subcontractor quality and the Company’s ability to deliver complete lines without cost overruns or specification shortfalls should be monitored
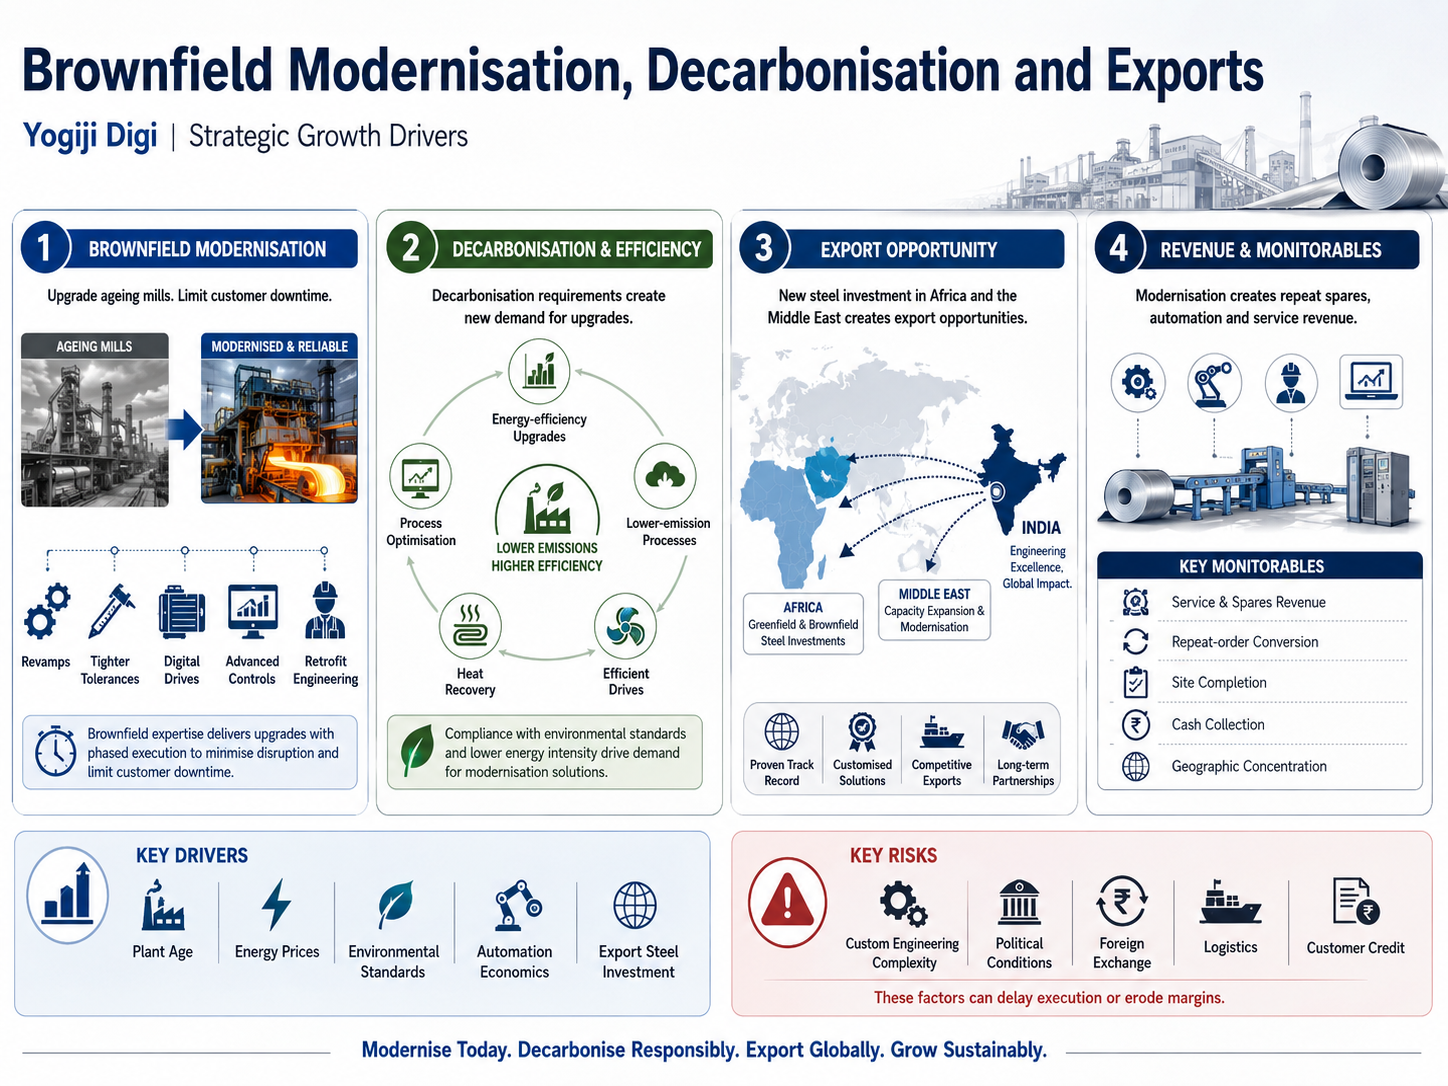
Brownfield modernisation, decarbonisation and exports
Ageing mills require revamps, tighter tolerances, digital drives, advanced controls, energy-efficiency upgrades and lower-emission processes. Brownfield work can limit customer downtime and create repeat spares, automation and service revenue, while new steel investment in Africa and the Middle East provides export opportunity. Decarbonisation requirements can add demand for heat recovery, efficient drives, process optimisation and retrofit engineering
Key drivers are plant age, energy prices, environmental standards, automation economics and export steel investment
Service and spares revenue, repeat-order conversion, site completion, cash collection and geographic concentration, because custom engineering, political conditions, foreign exchange, logistics and customer credit can delay execution or erode margins should be monitored
Government Policy Support
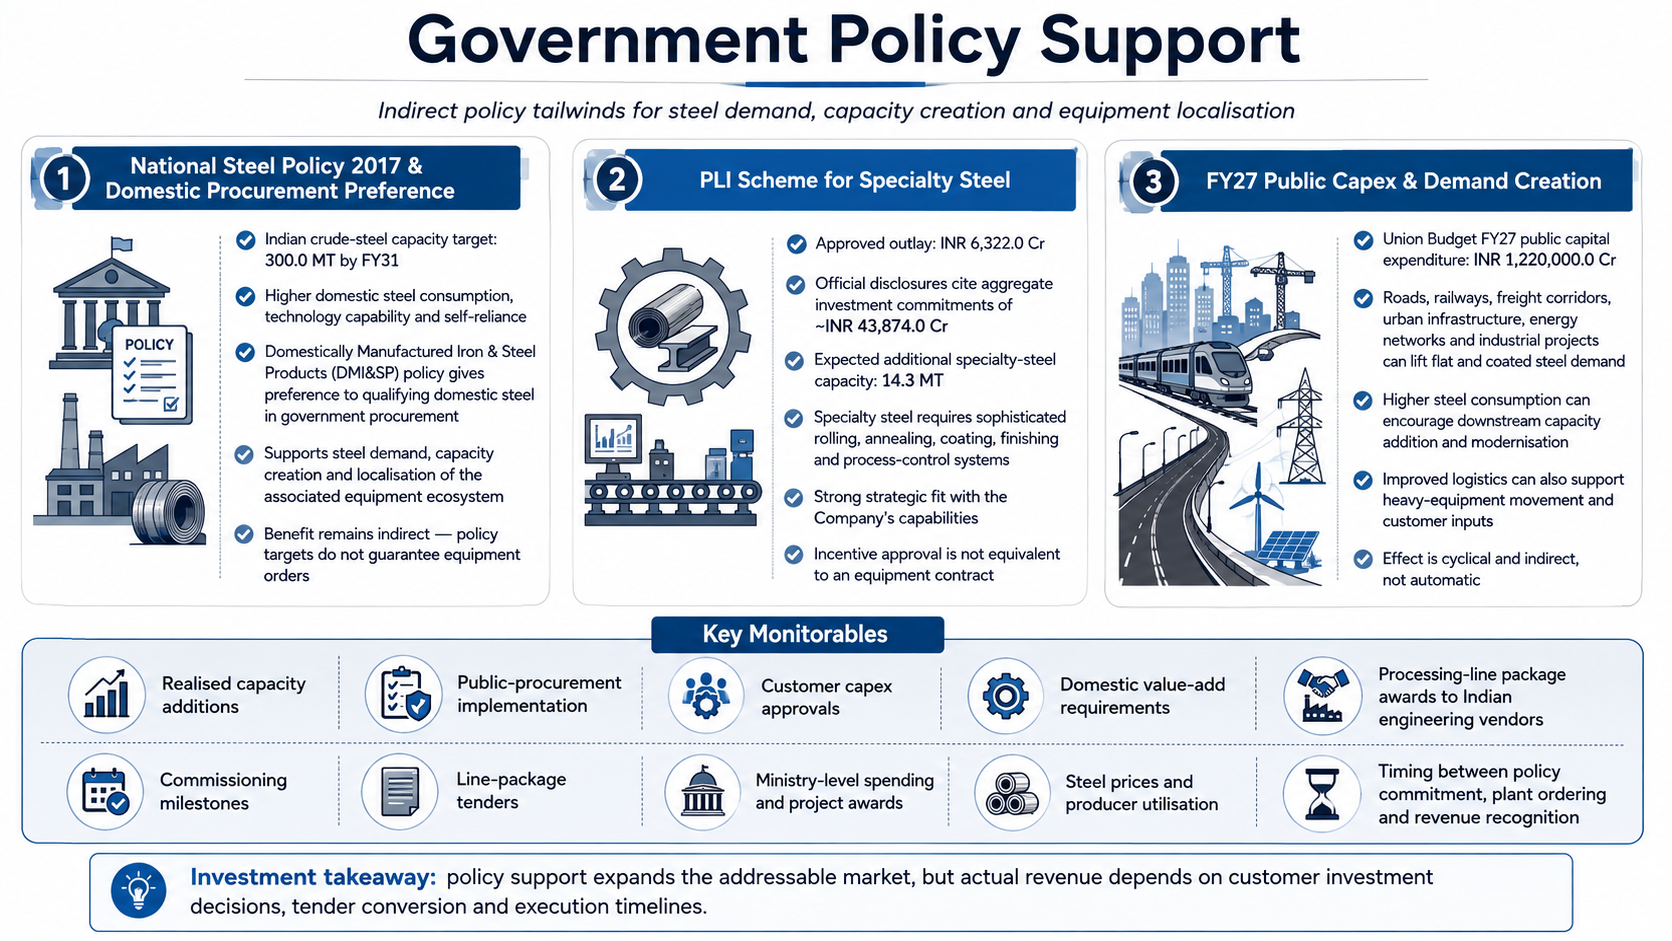
The National Steel Policy 2017 targets Indian crude-steel capacity of 300.0 MT by FY31 and seeks higher domestic steel consumption, technology capability and self-reliance. The Domestically Manufactured Iron & Steel Products policy also provides preference for qualifying domestic steel in government procurement. Together, these measures can support steel demand, capacity creation and localisation of the associated equipment ecosystem. The benefit to the Company is indirect: policy targets do not guarantee equipment orders
The Production Linked Incentive Scheme for Specialty Steel has an approved outlay of INR 6,322.0 Cr. Following subsequent rounds, official disclosures cited aggregate investment commitments of approximately INR 43,874.0 Cr and expected additional specialty-steel capacity of 14.3 MT. Specialty steel generally requires more sophisticated rolling, annealing, coating, finishing and process-control systems, which aligns with the Company’s capabilities. However, incentive approval is not equivalent to an equipment contract, and project sequencing may change with steel spreads or financing
The Union Budget for FY27 proposed public capital expenditure of INR 1,220,000.0 Cr. Roads, railways, freight corridors, urban infrastructure, energy networks and industrial projects can increase demand for flat and coated steel, while improved logistics can support movement of heavy equipment and customer inputs. Higher steel consumption can encourage producers to add or modernise downstream capacity, supporting the Company’s addressable market. The effect remains cyclical and indirect, because budget allocation, tendering, land availability and execution determine actual demand
Fundraise/Future Plans
Shareholding
Pre-issue shareholding
Promoter Holding 0.0%
Category
Pre-Issue%
Promoters
0.0%
Total Promoter Holding
0.0%
Additional Shareholders
0.0%
Total Additional Holding
0.0%
Total Shareholding
0.0%
- Overview
- Business
- Financial Highlights
- Industry Overview
- Fundraise/Future Plans
- Documentation
Get the Preqt App and keep in touch around the clock!
 Monitor your investments in real-time.
- Receive tailored deal suggestions.
- Get real-time updates and alerts.
