

A-One Steels India
Strength That BuildsEngineering Strength in Steel
IPO Summary (PreQT)
A-One Steels India Limited is a Bengaluru-headquartered, backward-integrated steel manufacturer operating across long steel, flat steel and industrial products used within the steelmaking value chain. Its product chain includes sponge iron and MS billets, TMT bars, HR and CR coils, HR/CR pipes and galvanized tubes, together with industrial products such as met coke and ferro alloys. The group operates six manufacturing facilities across Karnataka and Andhra Pradesh with aggregate installed capacity of approximately 17.33 lakh MTPA as of March 31, 2026. The integrated model gives the Company participation across multiple conversion stages rather than dependence on a single finished-steel category.
Financial performance has been volatile but improved sharply in FY26. Revenue from operations recovered to INR 4,148.6 Cr from INR 3,541.8 Cr in FY25, while EBITDA increased to INR 303.6 Cr and PAT to INR 127.4 Cr. FY25 had been a weak earnings year, with PAT of only INR 7.7 Cr. The FY26 debt/equity ratio was disclosed at 1.17x and total borrowings remained substantial at INR 1,010.9 Cr. Working capital is also material: current RHP-based public disclosures indicate FY26 inventory of about INR 899.3 Cr and trade receivables of about INR 664.5 Cr.
The IPO is structured as a fresh issue of up to INR 355.0 Cr plus an OFS of up to INR 50.0 Cr. INR 250.0 Cr of the fresh proceeds is proposed for pre-payment / partial repayment of identified borrowings; the balance of Net Proceeds is for general corporate purposes, subject to offer expenses and regulatory limits.
IPO Review Rating
Average
MainboardDelivering Durable Steel Solutions for Infrastructure and Industrial Applications
A-One Steels may currently be viewed as a provisionally above-average IPO candidate, primarily because its indicative valuation appears attractive relative to listed peers, while the offer structure is also supportive. At prevailing indicative unlisted-market levels, the Company appears to trade at a substantial discount on P/E and EV/EBITDA compared with its peer set, while its RoNW remains respectable. The IPO is also largely Fresh Issue-led, with approximately 87.7% of the offer comprising fresh capital, and a significant portion of the proceeds is proposed to be used for debt repayment. This should help strengthen the balance sheet and reduce finance-cost pressure after listing.
From an operating perspective, FY26 reflects a meaningful recovery in profitability, with EBITDA Margin improving to around 7.3%, PAT rising sharply to approximately INR 127.4 Cr and leverage reducing compared with earlier periods. The Company also benefits from an integrated steel manufacturing model, experienced promoters and relatively low single-customer concentration. These factors provide some comfort around operating scale and execution capability. However, investors may need to remain cautious about the sustainability of the FY26 earnings recovery. The Company’s profitability has been volatile across the last three years, with FY25 PAT materially lower than FY26, while Revenue CAGR over FY24–FY26 has remained modest. Operating cash flow also trails reported profitability, and leverage, although improving, remains meaningful. In addition, the business remains exposed to steel-price cycles, raw-material and energy-cost volatility, regulatory requirements and geographic concentration.
PARAMETER
WEIGHT
SCORE
KEY FACTORS
Financial Performance
40.0%
3.0/5
A-One has delivered a strong FY26 profitability recovery, improving margins, leverage and ROE, but its three-year Revenue CAGR remains modest and historical earnings are volatile. Declining operating cash conversion and continued leverage prevent the financial profile from receiving a high score
Show more
Detailed Analysis
FY24–FY26 Revenue CAGR was only ~4.0%, although FY26 Revenue rebounded by ~17.1% YoY
FY26 EBITDA Margin improved sharply to 7.3% from 4.9% in FY25 and ~4.5% in FY24
FY26 PAT Margin improved to ~3.1%, but remains thin and profitability has been highly volatile
D/E improved materially to 1.17x from 2.34x in FY24, though leverage remains meaningful
FY26 ROE recovered to 14.8%, versus just ~1.1% in FY25
FY26 OCF was positive at ~INR 62.8 Cr, but declined sharply from INR 325.4 Cr in FY24 and covered only ~49% of PAT
Largest customer contributed only ~5.3% of FY26 Revenue, indicating low single-customer concentration
Industry
15.0%
3.0/5
A-One benefits from a 6–8% domestic steel-demand growth outlook and strong infrastructure exposure, but steel remains a mature, cyclical and price-sensitive commodity industry. Regulatory requirements, raw-material volatility, regional concentration and subdued global demand moderate the industry score
Show more
Detailed Analysis
CRISIL expects Indian steel demand to grow at 6–8% CAGR during FY25–FY29
Steel is a mature and cyclical commodity industry, though Indian infrastructure and construction demand provide structural growth
Environmental regulation, BIS standards, mining/raw-material policies and trade safeguards create moderate-to-high regulatory exposure
Management
15.0%
4.0/5
Management is backed by experienced promoters and a 50%-independent Board, with high pre-IPO promoter ownership and a largely Fresh Issue-led IPO. The principal governance deductions arise from meaningful RPTs, historical compliance penalties and outstanding litigation
Show more
Detailed Analysis
Promoters have extensive steel-industry experience; Krishan Kumar Jalan has 30+ years and the other key promoters have 20+ years
Six-member Board includes three Independent Directors, providing 50% independent representation
No promoter-share pledge identified, but outstanding disputes and historical regulatory penalties warrant monitoring
Operating RPTs are approximately 10% of Revenue, meaningful enough to require monitoring
Valuation
20.0%
4.0/5
A-One Steels appears attractively valued on earnings, with its 24.5x P/E at a ~46% discount to peers and EV/EBITDA at a modest ~7% discount. However, its pro-forma P/B carries an ~18% premium, while zero GMP provides limited sentiment support
Show more
Detailed Analysis
A-One trades at a post-issue P/E of ~24.5x, representing a ~45.7% discount to the RHP peer average of ~45.2x and a ~46.4% discount to the peer median of 45.8x
A-One's gross post-raise EV/EBITDA is ~12.4x, compared with a current peer average of ~13.4x, implying a ~7.2% discount to peers
A-One's gross pro-forma P/B is ~2.7x, versus a current peer average of ~2.3x, implying an ~18.2% premium to peers
FY26 RoNW is 15.4%, materially above Shyam Metalics' disclosed 10.1%, providing reasonable support for the valuation
Merchant Banker Track Record
10.0%
3.0/5
The BRLM combination has a strong numerical track record, with ~50% average listing gains and ~109x average subscription across a six-IPO sample. However, results are highly skewed by exceptional deals, and the franchises are smaller than top-tier institutional ECM houses.
Show more
Detailed Analysis
Six-IPO mainboard sample across the two BRLMs averages approximately 50.3%, though heavily skewed by Vibhor Steel
Same sample averages approximately 109.0x subscription, again boosted by a few very heavily subscribed issues
5 of 6, or approximately 83.3%, of sampled issues listed above offer price
TOTAL
100%
3.4/5
Weighted Composite Score
Issue Price
₹385.0 to ₹405.0
As of 18 Sep 2026
GMP
₹55.0
As of 18 Sep 2026
Estimated Gain / Loss
+13.6%
Lot Size
37.0 Shares
Grey Market Premium (GMPs) are shared for knowledge purpose only. PrEqt doesn’t promote or execute the trades.
| Issue size | |
|---|---|
| Overall | ₹405.0 Cr |
| Fresh Issue | ₹355.0 Cr |
| Offer for Sale | ₹50.0 Cr |
Minimum Investment
₹14,985.0 / 1,369 shares

Merchant Banker
PL Capital Markets Pvt.Ltd., Khambatta Securities Limited
PL Capital Markets Pvt.Ltd.
Khambatta Securities Limited
IPO Document
Offer Start Date
Offer End Date
Valuation
Revenue (FY'26)
PAT (FY'26)
Issue Size
Face Value
₹ 10.0Offer Price
₹ 405.0Lot Size
37.0 sharesSale Type
Fresh capital cum OFSPAT (FY'26)
₹ 127.4 CrPAT Margin (FY'26)
3.0 %P/E Multiple
24.5xEBITDA (FY'26)
₹ 303.6 CrCAGR Growth 2Y
4.3 %ROE (FY'26)
14.7 %ROCE (FY'26)
12.9 %Price to Book Value
2.7xDebt/Equity
1.2xCompany Website
aonesteelgroup.comExplore new deals
Overview
Fund Allocation
Total: ₹0 CrSource:Company DRHP
Timeline
IPO Open Date
To Be Announced
IPO Close Date
To Be Announced
Tentative Allotment
To Be Announced
Initiation of Refunds
To Be Announced
Credit of Shares to Demat
To Be Announced
Tentative Listing Date
To Be Announced
Business
Products
Business Model
Geographical Presence
Sales Channel
Key Risk Factor
Financial Highlights
Income Statement
Revenue growth with EBITDA and PAT margins
| Financial Metric | FY 2024 | FY 2025 | FY 2026 |
|---|---|---|---|
| Revenue (₹ Cr) | 3,834.2 | 3,541.8 | 4,202.1 |
| Growth (%) | - | -7.6% | 17.1% |
| EBITDA (₹ Cr) | 172.2 | 174.1 | 303.6 |
| EBITDA Margin (%) | 4.5% | 4.9% | 7.3% |
| PAT (₹ Cr) | 38.9 | 7.7 | 127.4 |
| PAT Margin (%) | 1.0% | 0.2% | 3.1% |
OBSERVATIONS & INSIGHTS
Revenue from operations grew 21.2% in FY24, declined 7.6% in FY25, and recovered 17.1% in FY26 to INR 4,148.6 Cr. The FY26 recovery more than reversed the FY25 decline
EBITDA remained broadly flat between FY24 and FY25 at INR 172.2 Cr and INR 174.1 Cr, before increasing 74.4% to INR 303.6 Cr in FY26. Margin expanded from 4.5% in FY24 to 7.3% in FY26, with most of the improvement occurring in FY26, indicating materially stronger operating spreads
PAT fell 80.2% in FY25 to INR 7.7 Cr before recovering to INR 127.4 Cr in FY26. The sharp movement relative to revenue highlights the Company's sensitivity to steel spreads and operating leverage. PAT margin recovered from only 0.2% in FY25 to 3.1% in FY26, though net profitability remains relatively modest compared with the Company's revenue scale
Balance Sheet
| Financial Metric | FY 2024 | FY 2025 | FY 2026 |
|---|---|---|---|
| Net Worth | ₹ 421.8 Cr | ₹ 676.6 Cr | ₹ 819.5 Cr |
| Total Assets | ₹ 2,395.9 Cr | ₹ 2,753.1 Cr | ₹ 3,191.3 Cr |
| Total Borrowing | ₹ 1,042.5 Cr | ₹ 963.7 Cr | ₹ 1,010.9 Cr |
OBSERVATIONS & INSIGHTS
Net worth increased from INR 421.8 Cr in FY24 to INR 676.6 Cr in FY25 and INR 819.5 Cr in FY26, reflecting strengthening of the equity base. Growth was 60.4% in FY25 and 21.1% in FY26
Total assets expanded steadily from INR 2,395.9 Cr in FY24 to INR 2,753.1 Cr in FY25 and INR 3,191.3 Cr in FY26, driven by the Company's expanding manufacturing and working-capital base. Asset growth was 14.9% in FY25 and 15.9% in FY26
Borrowings declined from INR 1,042.5 Cr in FY24 to INR 963.7 Cr in FY25, before increasing to INR 1,010.9 Cr in FY26. Despite the stronger net worth base, absolute debt remains high and continues to be a key balance-sheet monitorable
Cash Flow
| Financial Metric | FY 2024 | FY 2025 | FY 2026 |
|---|---|---|---|
CFO in Cr Cash generated from core business operations. | +325.4 Cr | +109.0 Cr | +62.8 Cr |
CFI in Cr Cash used in / generated from investing activities. | -191.5 Cr | -192.3 Cr | -10.1 Cr |
CFF in Cr Cash from / used in financing activities. | -155.7 Cr | +45.3 Cr | -38.8 Cr |
Working Capital
| Efficiency Metric | FY 2023 | FY 2024 | FY 2025 |
|---|---|---|---|
Debtor Days Average number of days taken to collect customer payments. | - | - | - |
Creditor Days Average time taken to pay suppliers and vendors. | - | - | - |
Inventory Days Average number of days inventory remains unsold. | - | - | - |
CCC (Cash Conversion Cycle) (Debtor Days + Inventory Days - Creditor Days) | - | - | - |
Financial Ratios
Measures the company’s leverage relative to shareholder equity.
OBSERVATIONS & INSIGHTS
ROE declined sharply from 8.8% in FY24 to 1.1% in FY25 as PAT weakened significantly, before recovering to 14.8% in FY26 following the strong earnings rebound
ROCE moderated from 8.7% in FY24 to 7.0% in FY25, then improved materially to 12.9% in FY26, reflecting stronger operating profitability and improved utilisation of the capital base
Debt/Equity improved consistently from 2.3x in FY24 to 1.3x in FY25 and 1.2x in FY26. However, absolute borrowings remained high at INR 1,010.9 Cr in FY26, so leverage remains an important monitorable despite the improving ratio
Interest coverage remained relatively tight at approximately 1.6x in FY24 and 1.2x in FY25, indicating limited headroom over finance costs during weaker profitability periods
The consolidated current ratio improved from approximately 1.1x in FY24 to 1.2x in FY25, indicating modest improvement in short-term liquidity. However, the Company's large inventory and receivable balances mean liquidity remains dependent on working-capital conversion
ROA fell from 1.6% in FY24 to 0.3% in FY25, before recovering to 4.0% in FY26, as the significant increase in PAT outpaced the growth in the Company's consolidated asset base
The FY26 current ratio is not included because the detailed consolidated current assets and current liabilities required for a like-for-like calculation were not fully verified from the available restated consolidated disclosures. Using the standalone ratio would make the three-year series inconsistent
The FY26 interest coverage ratio is not included because the required consolidated EBIT and finance-cost components were not independently verified on the same basis as FY24 and FY25. The ratio has therefore not been substituted with a standalone figure to preserve consistency across the analysis
Industry Overview
Industry Drivers
Domestic Steel Demand Growth
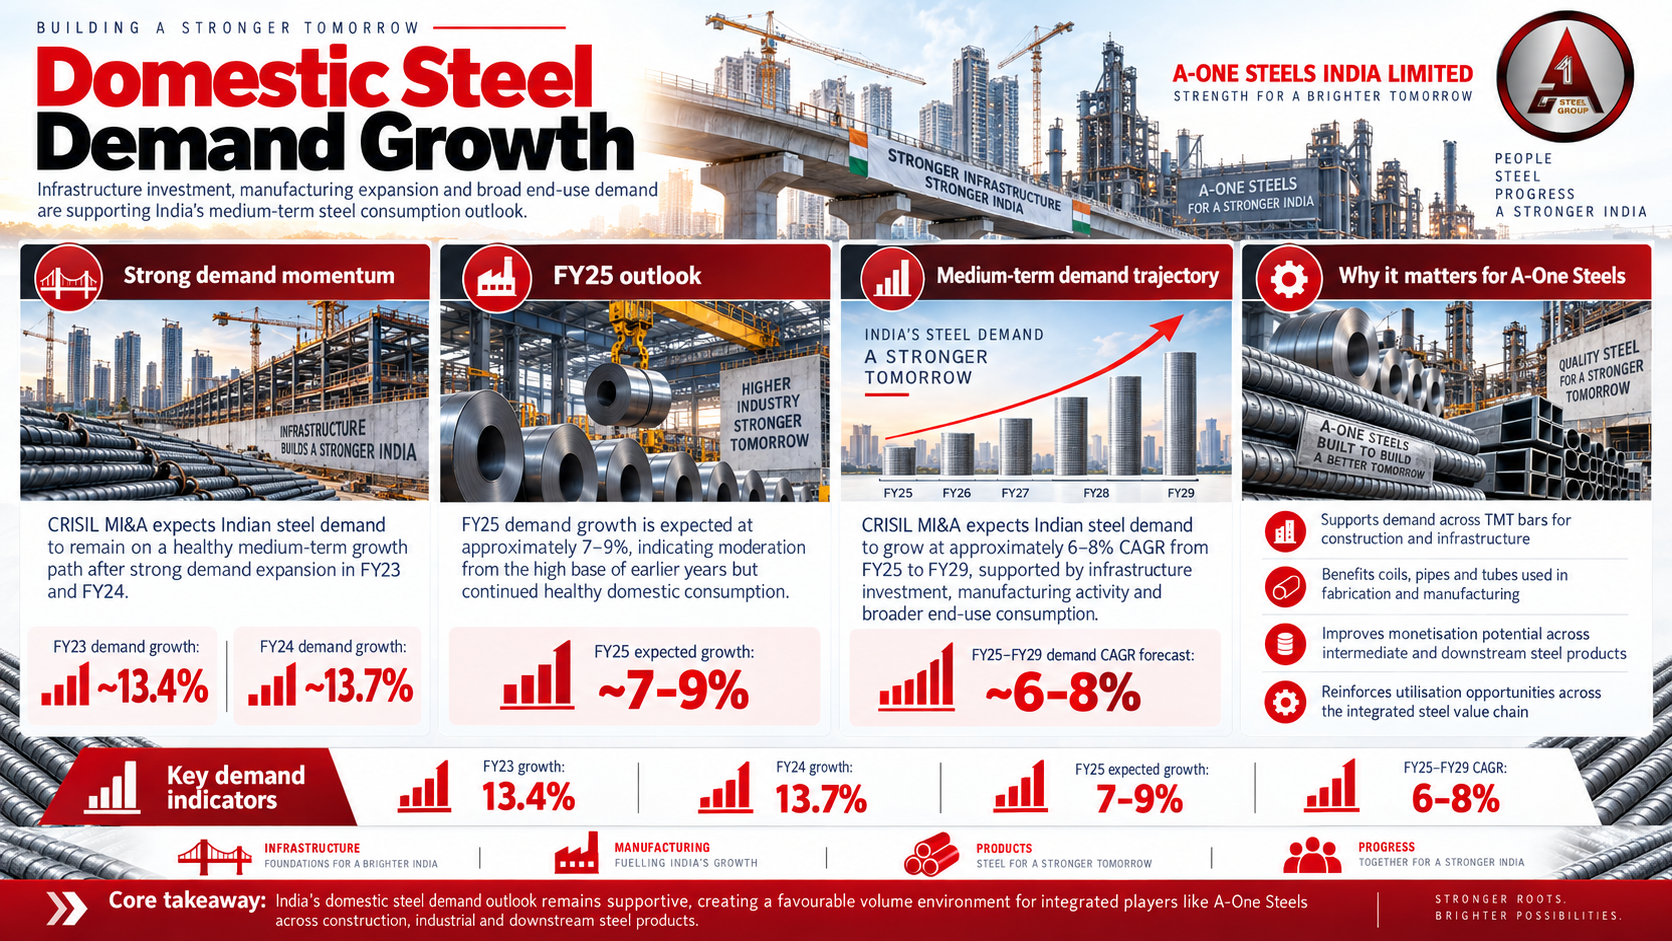
CRISIL MI&A expects Indian steel demand to grow at approximately 6-8% CAGR from FY25 to FY29 after strong demand growth in FY23 and FY24. The medium-term demand outlook is supported by infrastructure investment, manufacturing activity and broader end-use consumption. For A-One Steels, this matters across TMT bars, coils, pipes/tubes and intermediate steel products
The key drivers are:
Domestic steel demand growth: approximately 13.4% in FY23 and 13.7% in FY24
FY25 demand growth expectation: approximately 7-9%
FY25-FY29 demand CAGR forecast: approximately 6-8%
Infrastructure and Construction Remain the Largest Demand Pool
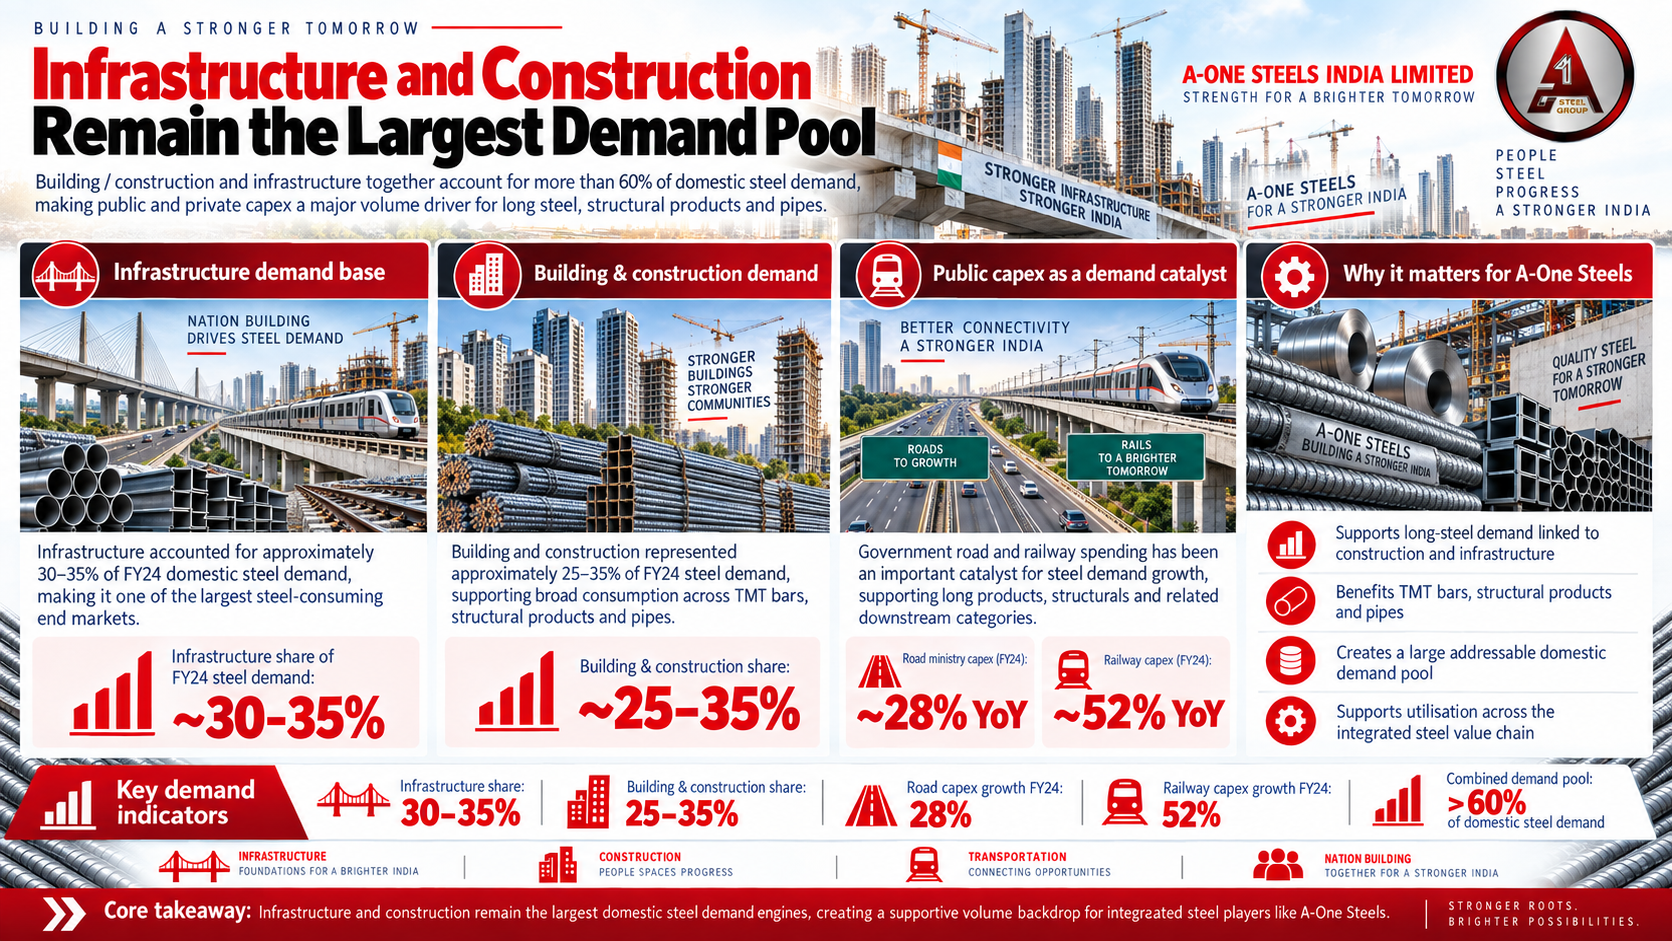
Building / construction and infrastructure together account for more than 60% of domestic steel demand, making public and private capex a major volume driver for long steel, structural products and pipes. Government road and railway capex has been a particularly important demand catalyst.
The key drivers are:
Infrastructure share of FY24 steel demand: approximately 30-35%
Building and construction share: approximately 25-35%
FY24 central road-ministry capex increased roughly 28% YoY; railway capex increased roughly 52% YoY, per the CRISIL industry material reproduced in the offer documents
Low Per-Capita Steel Consumption Leaves Structural Headroom
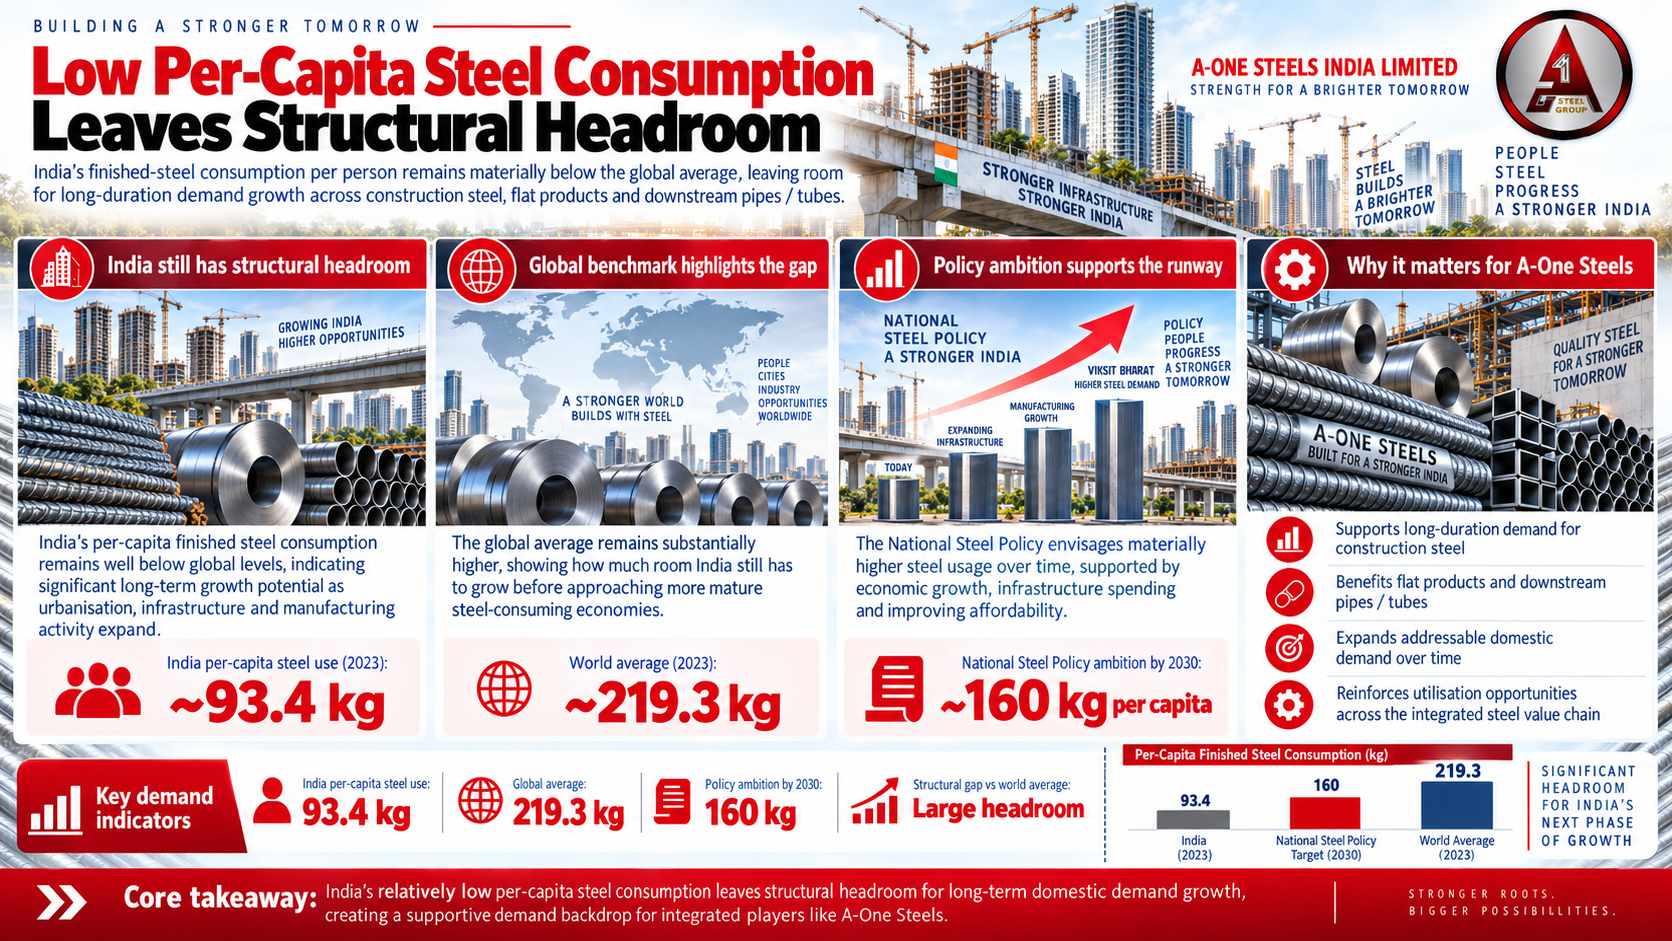
India’s per-capita finished steel consumption remains materially below the global average. A gradual closing of this gap would support long-duration demand for construction steel, flat products and downstream tubes / pipes, subject to economic growth and affordability.
The key drivers are:
India per-capita steel use is approximately 93.4 kg in 2023
World average is approximately 219.3 kg in 2023
National Steel Policy ambition is approximately 160 kg per-capita steel consumption by 2030
Industry Risks
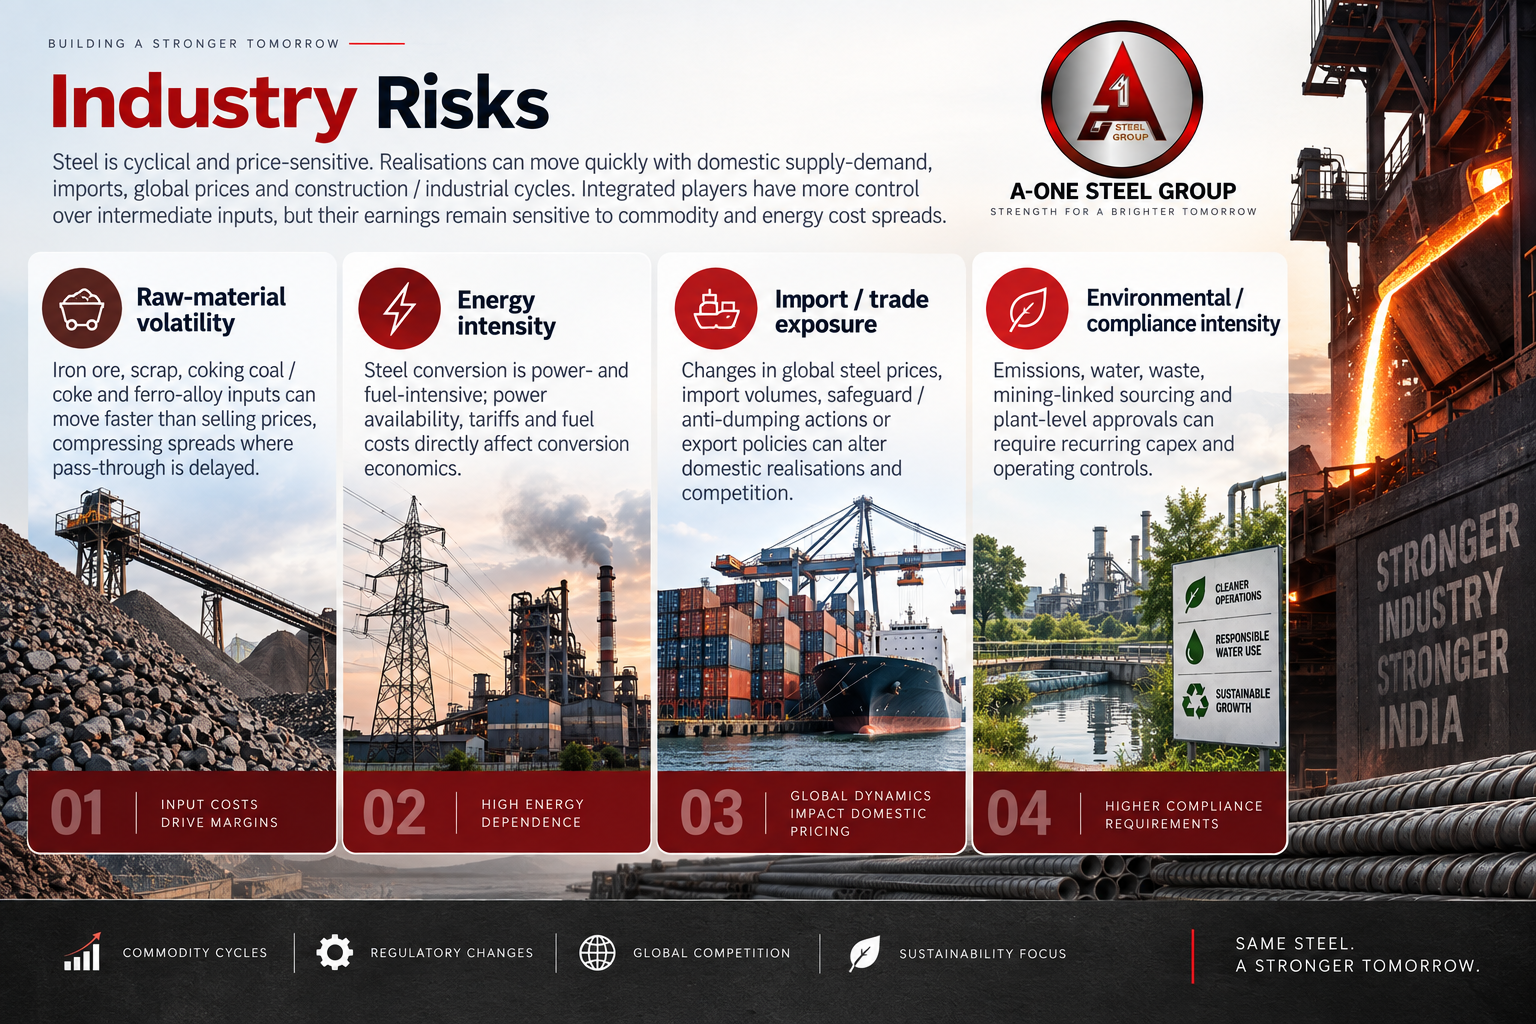
Steel is cyclical and price-sensitive. Realisations can move quickly with domestic supply-demand, imports, global prices and construction / industrial cycles. Integrated players have more control over intermediate inputs, but their earnings remain sensitive to spreads between finished-steel prices and raw-material / energy costs.
The key risks are:
Raw-material volatility: iron ore, scrap, coking coal / coke and ferro-alloy inputs can move faster than selling prices, compressing spreads where pass-through is delayed
Energy intensity: steel conversion is power- and fuel-intensive; power availability, tariffs and fuel costs directly affect conversion economics
Import / trade exposure: changes in global steel prices, import volumes, safeguard / anti-dumping actions or export policies can alter domestic realisations and competition/
Environmental / compliance intensity: emissions, water, waste, mining-linked sourcing and plant-level approvals can require recurring capex and operating controls
Government Policy Support
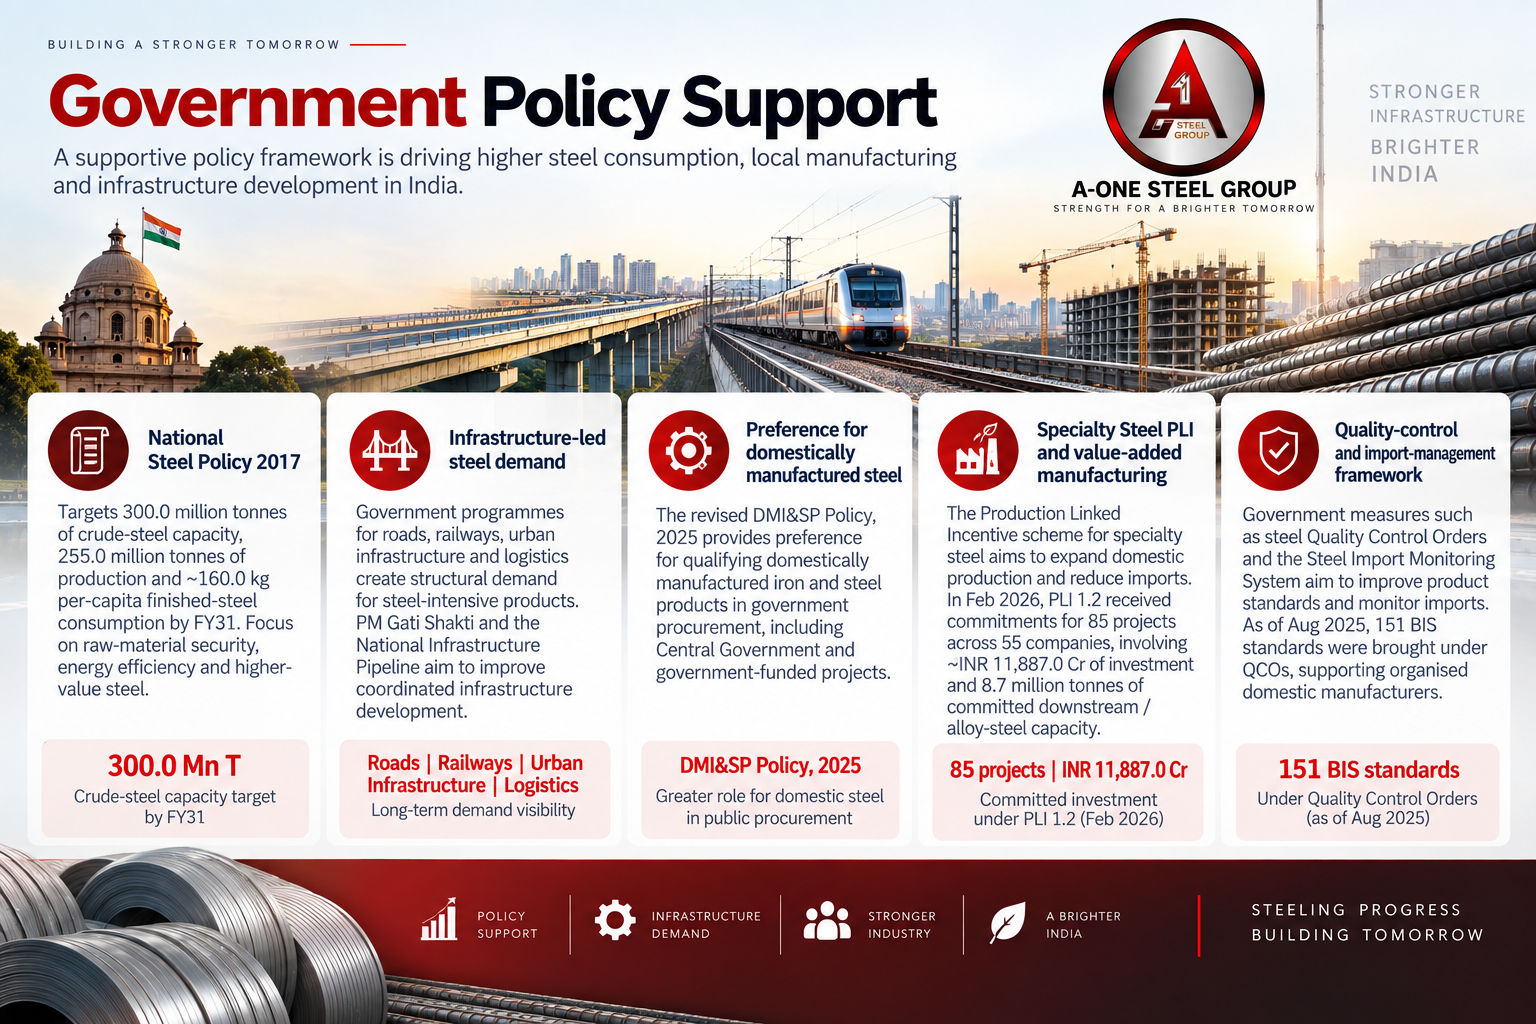
Government support for the Indian steel sector is primarily aimed at expanding domestic steel consumption, encouraging local manufacturing, improving infrastructure demand, reducing import dependence and supporting higher-value / lower-carbon steel production. For A-One Steels, the most relevant benefit is indirect: its product portfolio of TMT bars, coils, pipes, galvanized tubes, billets and other steel products participates in end markets such as construction, infrastructure, transportation and industrial manufacturing that are affected by these policy initiatives.
The key policies are:
National Steel Policy 2017: The policy provides the long-term framework for expanding India's steel industry and targets 300.0 million tonnes of crude-steel capacity, 255.0 million tonnes of production and approximately 160.0 kg of per-capita finished-steel consumption by FY31
Infrastructure-led steel demand: Government programmes covering roads, railways, urban infrastructure and logistics create structural demand for steel-intensive products. The Ministry of Steel specifically identifies infrastructure and construction as important demand drivers, while PM Gati Shakti and the National Infrastructure Pipeline are intended to improve coordinated infrastructure development
Preference for domestically manufactured steel: The revised Domestically Manufactured Iron & Steel Products (DMI&SP) Policy, 2025 provides preference for qualifying domestically manufactured iron and steel products in government procurement, including Central Government and government-funded projects
Specialty Steel PLI and value-added manufacturing: The Government's Production Linked Incentive scheme is aimed at expanding domestic production of specialty and value-added steel and reducing imports. In February 2026, PLI 1.2 resulted in commitments for 85 projects across 55 companies, involving approximately INR 11,887.0 Cr of investment and 8.7 million tonnes of committed downstream / alloy-steel capacity
Quality-control and import-management framework: Government measures such as steel Quality Control Orders and the Steel Import Monitoring System are intended to improve product standards and monitor imports. The Ministry of Steel reported that 151 BIS standards had been brought under steel Quality Control Orders by August 2025, although enforcement for certain standards was subsequently suspended or modified
Fundraise/Future Plans
Shareholding
Pre-issue shareholding
Promoter Holding 0.0%
Post-Issue Shareholding
Promoter Holding 0.0%
Category
Pre-Issue%Post-Issue%
Promoters
Sandeep Kumar
32.8%28.5%
Sunil Jallan
30.3%26.2%
Krishan Kumar Jalan
22.5%19.6%
Total Promoter Holding
85.6%74.3%
Additional Shareholders
Other Shareholders
14.4%25.7%
Total Additional Holding
14.4%25.7%
Total Shareholding
100.0%100.0%
- Overview
- Business
- Financial Highlights
- Industry Overview
- Fundraise/Future Plans
- Documentation
Get the Preqt App and keep in touch around the clock!
 Monitor your investments in real-time.
- Receive tailored deal suggestions.
- Get real-time updates and alerts.
