


Acevector (Snapdeal)
Commerce That ConnectsPowering Digital Commerce
IPO Summary (PreQT)
AceVector Limited is a digital commerce platform group built around three operating verticals: Snapdeal, a pure-play value e-commerce marketplace focused on price-conscious “Bharat Shoppers”; Unicommerce, an e-commerce enablement SaaS platform spanning order, inventory, warehouse, logistics and customer-engagement workflows; and Stellaro Brands, a smaller consumer-brands business. The Group operates an asset-light marketplace model, while Unicommerce provides a higher-margin recurring software layer across the broader e-commerce ecosystem.
FY26 revenue from operations was INR 510.4 Cr, up 29.2% year-on-year, with the SaaS contribution rising to 40.0% from 27.3% in FY24. Consolidated Adjusted EBITDA remained negative at INR (15.9) Cr, but the margin improved to (3.1)% from (9.9)% in FY25. Restated consolidated loss narrowed to INR (45.5) Cr in FY26 from INR (126.3) Cr in FY25. Operating cash burn also reduced materially to INR (1.8) Cr in FY26 from INR (54.8) Cr in FY24.
The IPO comprises 13,12,50,000 shares at INR 30.0-INR 32.0 per share, including 8,96,87,500 fresh shares and an OFS of 4,15,62,500 shares. At the cap price, total issue size is approximately INR 420.0 Cr, comprising INR 287.0 Cr of fresh capital and INR 133.0 Cr of OFS. Fresh proceeds are intended primarily for Marketplace marketing and business promotion, technology infrastructure, inorganic growth and general corporate purposes.
IPO Review Rating
Speculative
MainboardConnecting Shoppers, Sellers, Brands, and Commerce Technology Across India
The strongest part of the case is the industry opportunity and improving operating trajectory. FY24–FY26 Revenue CAGR is 15.9%, FY26 Revenue grew 29.2% YoY, adjusted EBITDA losses have narrowed considerably and statutory operating cash burn has almost reached breakeven. The Company also has negligible leverage.
The quality of the business mix is important. Unicommerce/SaaS is already meaningfully profitable, generating INR 41.3 Cr adjusted EBITDA in FY26, while Snapdeal's marketplace lost INR 50.2 Cr. Consequently, consolidated profitability depends substantially on whether SaaS continues scaling and the marketplace can reduce losses without sacrificing growth.
The largest fundamental deduction is therefore current profitability. AceVector remains EBITDA-negative, PAT-negative and RoNW-negative, with negative operating cash flow for three consecutive years. This also makes P/E and EV/EBITDA unusable, while the measurable 14.48x P/B against -59.5% RoNW is demanding on present-day accounting returns.
The IPO structure is more constructive. 68.3% of the offer is fresh capital, the founders themselves are not selling, and the bulk of new money is intended for marketing and technology investment. The trade-off is that these proceeds are being deployed primarily toward a marketplace business which remains loss-making.
PARAMETER
WEIGHT
SCORE
KEY FACTORS
Financial Performance
40.0%
2.0/5
AceVector's revenue growth and loss reduction are encouraging, while negligible leverage provides balance-sheet comfort. However, consolidated EBITDA, PAT, RoNW and operating cash flow remain negative. Profitability is currently supported by SaaS economics while the substantially larger marketplace business continues to lose money
Show more
Detailed Analysis
Revenue increased from INR 379.8 Cr in FY24 to INR 510.4 Cr in FY26, implying 15.9% CAGR
FY26 adjusted EBITDA remained negative at INR (15.9) Cr, giving -3.1% margin, although materially improved from -9.9% in FY25
FY26 restated loss was INR (45.5) Cr, implying -8.9% PAT margin
FY26 D/E was only 0.01x, making financial leverage negligible
FY26 RoNW was -59.5% because the Company remained loss-making
OCF remained negative at INR (1.8) Cr in FY26, after INR (27.4) Cr in FY25 and INR (54.9) Cr in FY24
Industry
15.0%
4.0/5
AceVector operates within a high-growth digital-commerce ecosystem benefiting from e-commerce penetration, non-metro adoption and merchant digitisation. Snapdeal targets value commerce while Unicommerce provides higher-margin SaaS exposure. Strong structural growth is offset by intense marketplace competition, regulation and customer-acquisition pressures
Show more
Detailed Analysis
India's e-commerce market is projected to grow from US$125 Bn in 2024 to US$345 Bn by 2030 — 18.4% CAGR
Indian e-commerce remains structurally expanding, with growing penetration in Tier-II/III cities and digital commerce adoption
Marketplace FDI restrictions, consumer protection, data privacy, seller compliance and competition rules create meaningful regulatory exposure
Unicommerce's SaaS business serves customers beyond India, including Southeast Asia and the Middle East, providing some international scalability
Management
15.0%
4.0/5
AceVector benefits from experienced founders, 50.0% Board independence and continued founder ownership. Governance comfort is moderated by disclosed legal and regulatory proceedings and partial promoter-group selling through Starfish. FY26 related-party intensity remains pending until the final comparable RPT table is verified
Show more
Detailed Analysis
Kunal Bahl and Rohit Bansal have led the business since 2007, representing approximately 19 years of operating experience
Current IPO documentation identifies 3 Independent Directors among 6 Directors coming to 50.0%
There are disclosed legal and regulatory matters involving the Company/promoters; no major promoter-share pledge concern was identified
A clean FY26 aggregate RPT-to-Revenue percentage from the final RHP could not be independently verified
Valuation
20.0%
1.0/5
Traditional earnings valuation is difficult because AceVector remains loss-making and EBITDA-negative. The determinable valuation metrics are demanding: P/B is 14.48x while RoNW remains negative. The predominantly fresh issue helps, but the current zero GMP provides no additional market valuation support
Show more
Detailed Analysis
FY26 earnings are negative; P/E cannot be meaningfully compared with profitable peers
FY26 adjusted EBITDA is negative; EV/EBITDA is not economically meaningful
FY26 RHP NAV is INR 2.21/share, giving a P/B of 14.5
Merchant Banker Track Record
10.0%
4.0/5
AceVector has a credible BRLM consortium combining IIFL and CLSA's institutional ECM capability with Systematix's strong recent execution. Subscription histories are particularly healthy, although listing outcomes vary and Systematix's strongest 2026 performance is based on a relatively small three-issue sample
Show more
Detailed Analysis
IIFL's broad 2026 book averages 6.47%; Systematix's recent smaller sample is much stronger, while CLSA has several successful institutional mandates
IIFL's 2026 mandates average 38.92x; Systematix's recent issues were 87–143x subscribed; CLSA/IIFL's Unicommerce book reached ~168x
Systematix has a 67% historical positive-listing ratio; the consortium overall has solid but not uniformly positive outcomes
TOTAL
100%
2.6/5
Weighted Composite Score
Issue Price
₹30.0 to ₹32.0
As of 24 Sep 2026
GMP
₹0.0
As of 24 Sep 2026
Estimated Gain / Loss
0.0%
Lot Size
468.0 Shares
Grey Market Premium (GMPs) are shared for knowledge purpose only. PrEqt doesn’t promote or execute the trades.
| Issue Size (in Cr) | |
|---|---|
| Overall | ₹420.0 Cr |
| Fresh Issue | ₹287.0 Cr |
| Offer for Sale | ₹133.0 Cr |
Minimum Investment
₹14,976.0 / 2,19,024 shares

Merchant Banker
IIFL Capital Services Ltd.
IIFL Capital Services Ltd.
Offer Start Date
Offer End Date
Valuation
Revenue (FY'26)
PAT (FY'26)
Issue Size (in Cr)
Face Value
₹ 1.0Offer Price
₹ 32.0Lot Size
468.0 sharesSale Type
Fresh capital cum OFSPAT (FY'26)
₹ -45.5 CrPAT Margin (FY'26)
-8.9 %EBITDA (FY'26)
₹ -15.9 CrCAGR Growth 3Y
18.2 %ROE (FY'26)
-59.5 %ROCE (FY'26)
-12.0 %Price to Book Value
14.5xDebt/Equity
0.0xCompany Website
www.acevector.comExplore new deals
Overview
Fund Allocation
Total: ₹0 CrSource:Company DRHP
Timeline
IPO Open Date
To Be Announced
IPO Close Date
To Be Announced
Tentative Allotment
To Be Announced
Initiation of Refunds
To Be Announced
Credit of Shares to Demat
To Be Announced
Tentative Listing Date
To Be Announced
Business
Business Model
Geographical Presence
Sales Channel
Key Risk Factor
Financial Highlights
Income Statement
Revenue growth with EBITDA and PAT margins
| Financial Metric | FY 2024 | FY 2025 | FY 2026 |
|---|---|---|---|
| Revenue (₹ Cr) | 384.7 | 406.8 | 537.7 |
| Growth (%) | - | 4.0% | 29.2% |
| EBITDA (₹ Cr) | -26.5 | -39.2 | -15.9 |
| EBITDA Margin (%) | -7.0% | -9.9% | -3.1% |
| PAT (₹ Cr) | -51.3 | -126.3 | -45.5 |
| PAT Margin (%) | -13.5% | -32.0% | -8.9% |
OBSERVATIONS & INSIGHTS
Revenue increased from INR 384.7 Cr in FY24 to INR 537.7 Cr in FY26, implying a two-year CAGR of approximately 15.9%. FY26 growth accelerated to 29.2%
EBITDA remained negative, but improved from INR -39.2 Cr in FY25 to INR -15.9 Cr in FY26 and margin improved from -9.9% to -3.1%.
Restated consolidated loss widened to INR 126.3 Cr in FY25, partly reflecting exceptional items, before narrowing by approximately 64.0% to INR 45.5 Cr in FY26
Balance Sheet
| Financial Metric | FY 2024 | FY 2025 | FY 2026 |
|---|---|---|---|
| Net Worth | ₹ -142.1 Cr | ₹ 126.3 Cr | ₹ 102.1 Cr |
| Total Assets | ₹ 410.5 Cr | ₹ 558.1 Cr | ₹ 575.3 Cr |
| Total Borrowing | ₹ 0.0 Cr | ₹ 0.5 Cr | ₹ 0.0 Cr |
| Reserves & Surplus | ₹ -181.8 Cr | ₹ 86.6 Cr | ₹ 57.0 Cr |
OBSERVATIONS & INSIGHTS
Equity recovery: Total equity moved from negative INR (122.4) Cr in FY24 to positive INR 260.4 Cr in FY26, supported by capital transactions and a larger non-controlling-interest base
Goodwill: Goodwill increased to INR 196.5 Cr in FY25 and remained at that level in FY26, making acquisition performance and impairment testing relevant monitorables
Low conventional debt: The Group carried negligible conventional borrowings at FY26, although lease liabilities and other financial liabilities remain material balance-sheet obligations
Receivables and liquidity: Trade receivables declined to INR 23.0 Cr in FY26 while cash and cash equivalents increased to INR 17.5 Cr
Cash Flow
| Financial Metric | FY 2024 | FY 2025 | FY 2026 |
|---|---|---|---|
CFO (₹ Cr) Cash generated from core business operations. | -54.8 Cr | -27.3 Cr | -1.8 Cr |
CFI (₹ Cr) Cash used for investments and long-term assets. | -32.7 Cr | -103.0 Cr | +17.6 Cr |
CFF (₹ Cr) Cash flow related to funding and borrowings. | +69.3 Cr | +126.9 Cr | -6.0 Cr |
Working Capital
| Efficiency Metric | FY 2023 | FY 2024 | FY 2025 |
|---|---|---|---|
Debtor Days Average number of days taken to collect customer payments. | - | - | - |
Creditor Days Average time taken to pay suppliers and vendors. | - | - | - |
Inventory Days Average number of days inventory remains unsold. | - | - | - |
CCC (Cash Conversion Cycle) (Debtor Days + Inventory Days - Creditor Days) | - | - | - |
Financial Ratios
Measures the company’s leverage relative to shareholder equity.
OBSERVATIONS & INSIGHTS
ROE was not meaningful in FY24 because net worth was negative; it remained negative at (110.2)% in FY25 and (59.5)% in FY26 because losses attributable to owners continued
Conventional borrowings were negligible in FY25 and nil in FY26; the ratio is therefore approximately 0.0x on a borrowing-only basis
EBIT was negative in each year, producing negative coverage of (20.3)x, (72.3)x and (17.0)x. Negative values indicate that operating earnings did not cover finance costs
Current ratio moved from 1.1x in FY24 to 0.8x in FY25 and 0.9x in FY26, reflecting current liabilities remaining high relative to current assets
ROA / ROCE both remained negative because consolidated earnings were negative. FY26 showed a material improvement from FY25 as losses narrowed and the capital base strengthened
Industry Overview
Industry Drivers
Expansion of Online Commerce and the Value-Shopper Base
India’s e-commerce market is moving from an early digital-adoption phase toward broad-based household penetration. 1Lattice estimates the market at USD 95.8 billion in FY25 and projects it to reach USD 234.4 billion by FY30. A major component of this expansion is the value shopper: consumers seeking affordable, trend-led products and often residing outside the largest metros. The value-shopper population is projected to rise from roughly 190-210 million in FY25 to 540-560 million by FY30.
The key drivers are:
India’s e-commerce market is projected to grow at approximately 19.6% CAGR during FY25-FY30
Online shoppers are projected to approach approximately 700 million by FY30, materially widening the addressable customer base
Value lifestyle e-commerce is projected to expand from USD 25.0 billion in FY25 to USD 75.3 billion by FY30
Affordability-led platforms can benefit from increasing online participation among middle-income and price-conscious households

Non-Metro Digital Adoption, UPI and Improving Commerce Infrastructure
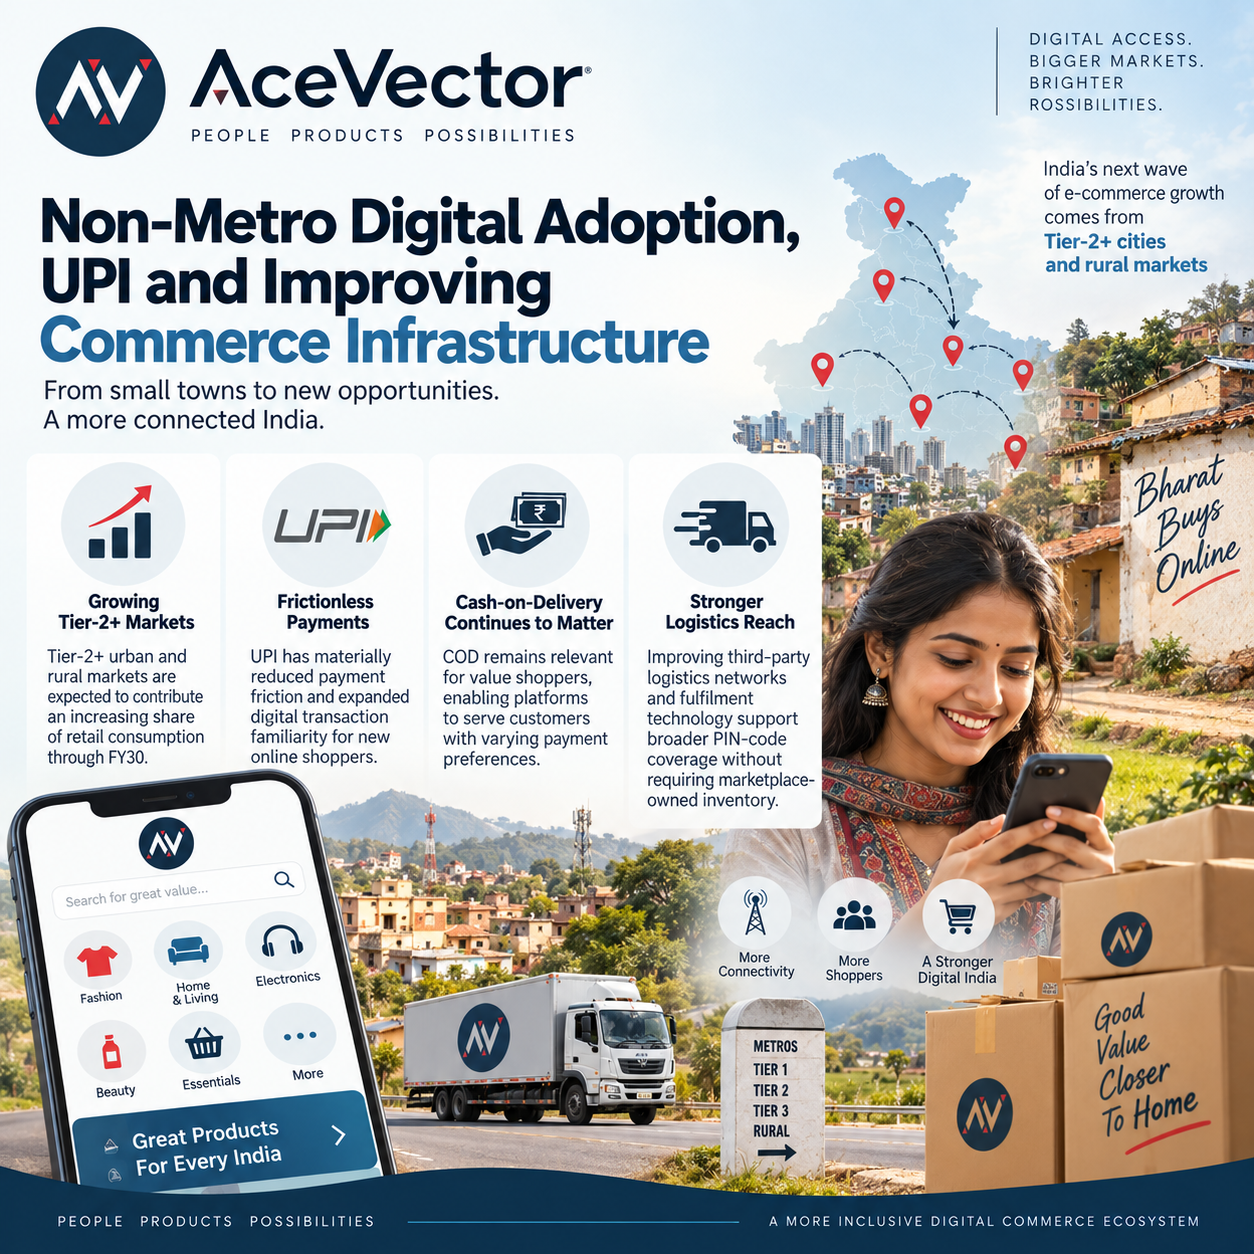
Digital access is enabling e-commerce growth beyond the largest cities. Tier-2+ urban and rural markets are becoming important consumption pools as smartphone usage, affordable data, UPI and improved logistics reduce transaction friction. 1Lattice notes that a majority of new online shoppers since 2020 have emerged from smaller towns and non-metro markets. The combination of digital payments, cash-on-delivery options, broader PIN-code coverage and improving fulfilment infrastructure allows marketplaces to address customers who were previously difficult to serve economically.
The key drivers are:
Tier-2+ urban and rural markets are expected to contribute an increasing share of retail consumption through FY30
UPI has materially reduced payment friction and expanded digital transaction familiarity for new online shoppers
Cash-on-delivery remains relevant for value shoppers, enabling platforms to serve customers with varying payment preferences
Improving third-party logistics networks and fulfilment technology support broader PIN-code coverage without requiring marketplace-owned inventory
Rapid Growth of E-Commerce Enablement SaaS
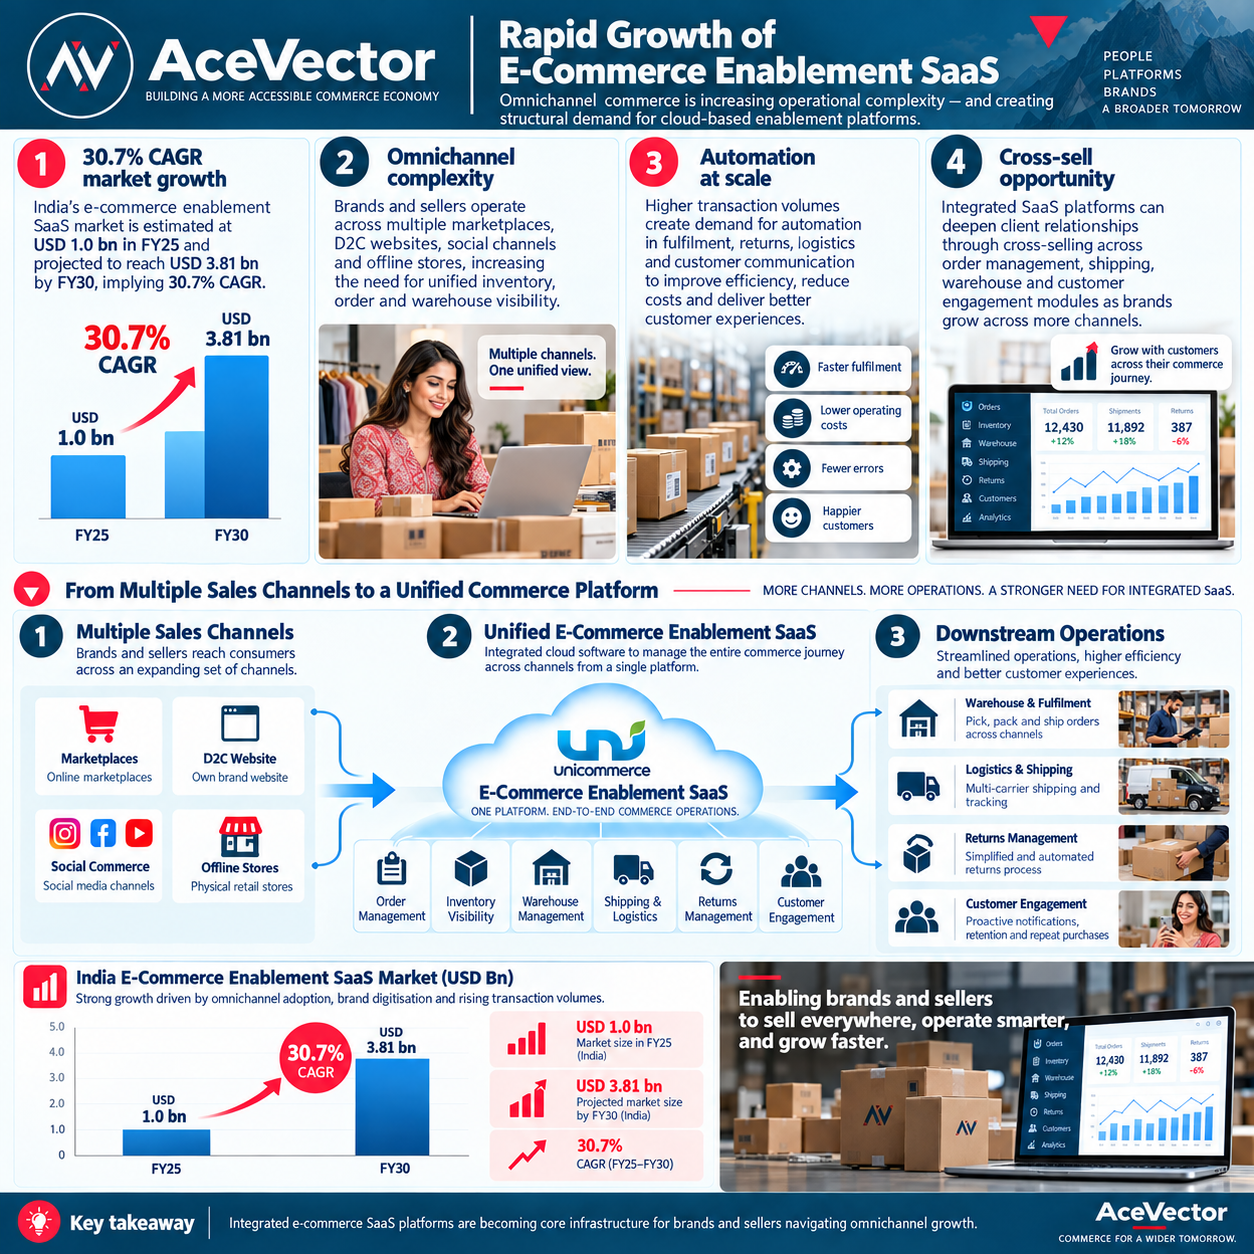
As brands and sellers distribute across marketplaces, direct-to-consumer websites, social channels and offline stores, commerce operations are becoming more complex. This increases demand for cloud-based tools that integrate order processing, inventory, warehouse management, logistics, returns and customer engagement. 1Lattice estimates India’s e-commerce enablement SaaS market at approximately USD 1.0 billion in FY25 and projects it to reach USD 3.81 billion by FY30, implying a 30.7% CAGR and creating a structural opportunity for scaled transaction-processing platforms.
The key drivers are:
The e-commerce enablement SaaS market is projected to grow at approximately 30.7% CAGR during FY25-FY30
Omnichannel selling increases the need for unified inventory, order and warehouse visibility across multiple sales channels
Higher transaction volumes create demand for automation in fulfilment, returns, logistics and customer communication
Integrated SaaS platforms can deepen client relationships through cross-selling across order management, shipping and engagement modules
Risks in the Industry
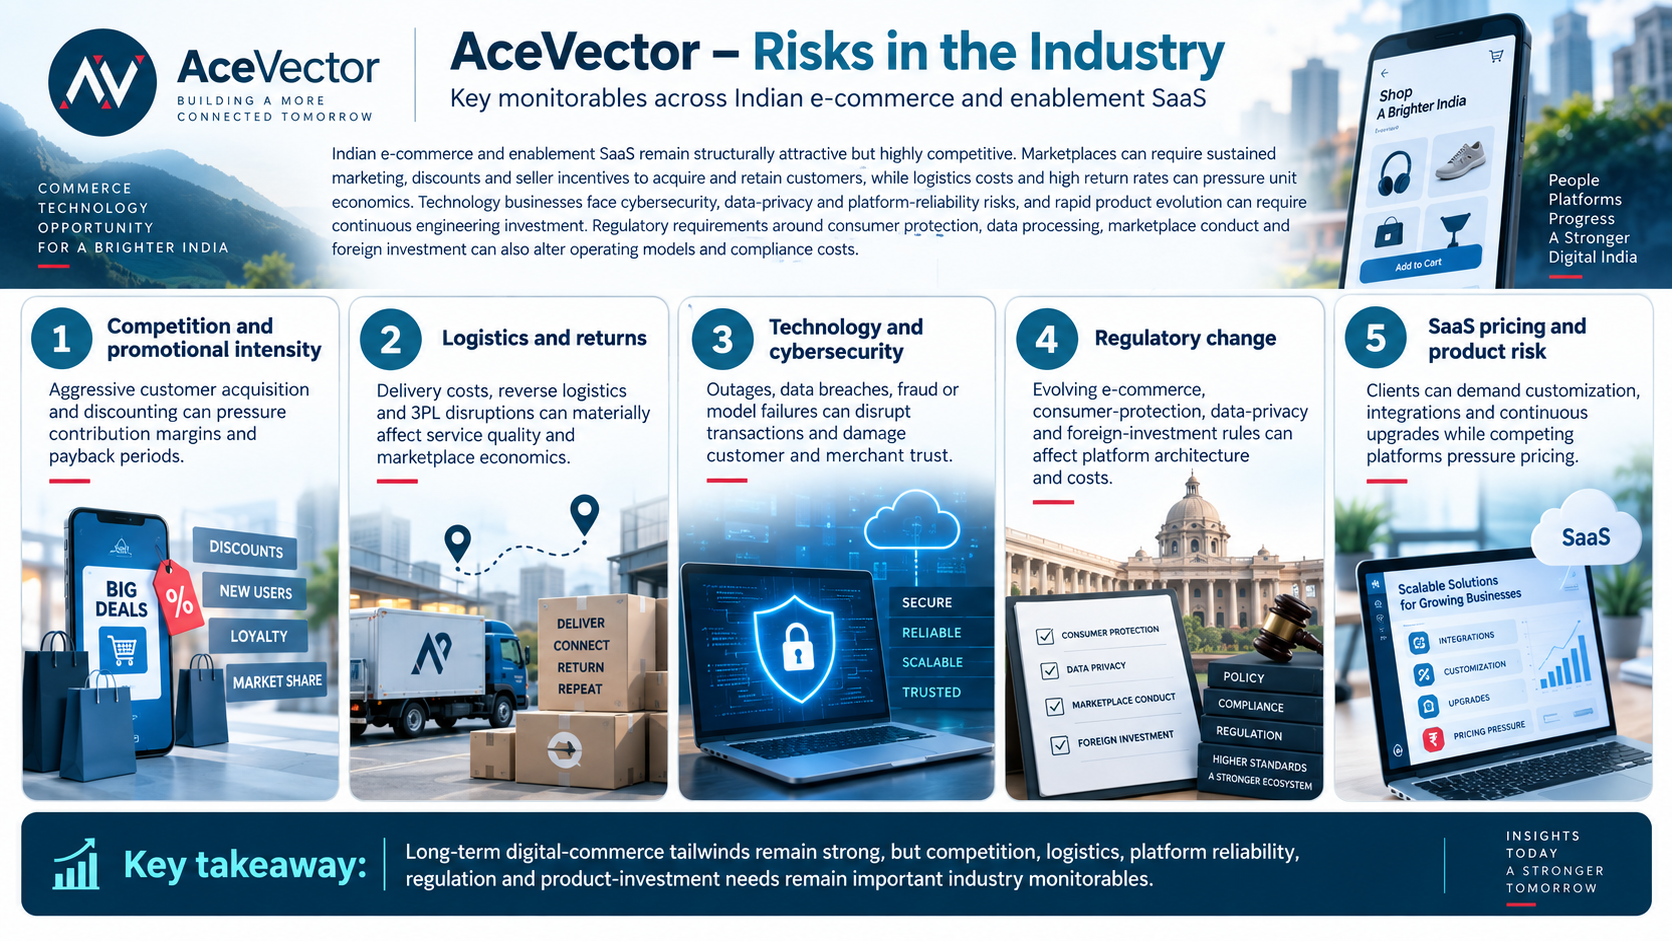
Indian e-commerce and enablement SaaS remain structurally attractive but highly competitive. Marketplaces can require sustained marketing, discounts and seller incentives to acquire and retain customers, while logistics costs and high return rates can pressure unit economics. Technology businesses face cybersecurity, data-privacy and platform-reliability risks, and rapid product evolution can require continuous engineering investment. Regulatory requirements around consumer protection, data processing, marketplace conduct and foreign investment can also alter operating models and compliance costs.
The key risks are:
Competition and promotional intensity: Aggressive customer acquisition and discounting can pressure contribution margins and payback periods
Logistics and returns: Delivery costs, reverse logistics and 3PL disruptions can materially affect service quality and marketplace economics
Technology and cybersecurity: Outages, data breaches, fraud or model failures can disrupt transactions and damage customer and merchant trust
Regulatory change: Evolving e-commerce, consumer-protection, data-privacy and foreign-investment rules can affect platform architecture and costs
SaaS pricing and product risk: Clients can demand customization, integrations and continuous upgrades while competing platforms pressure pricing
Government Policy Support
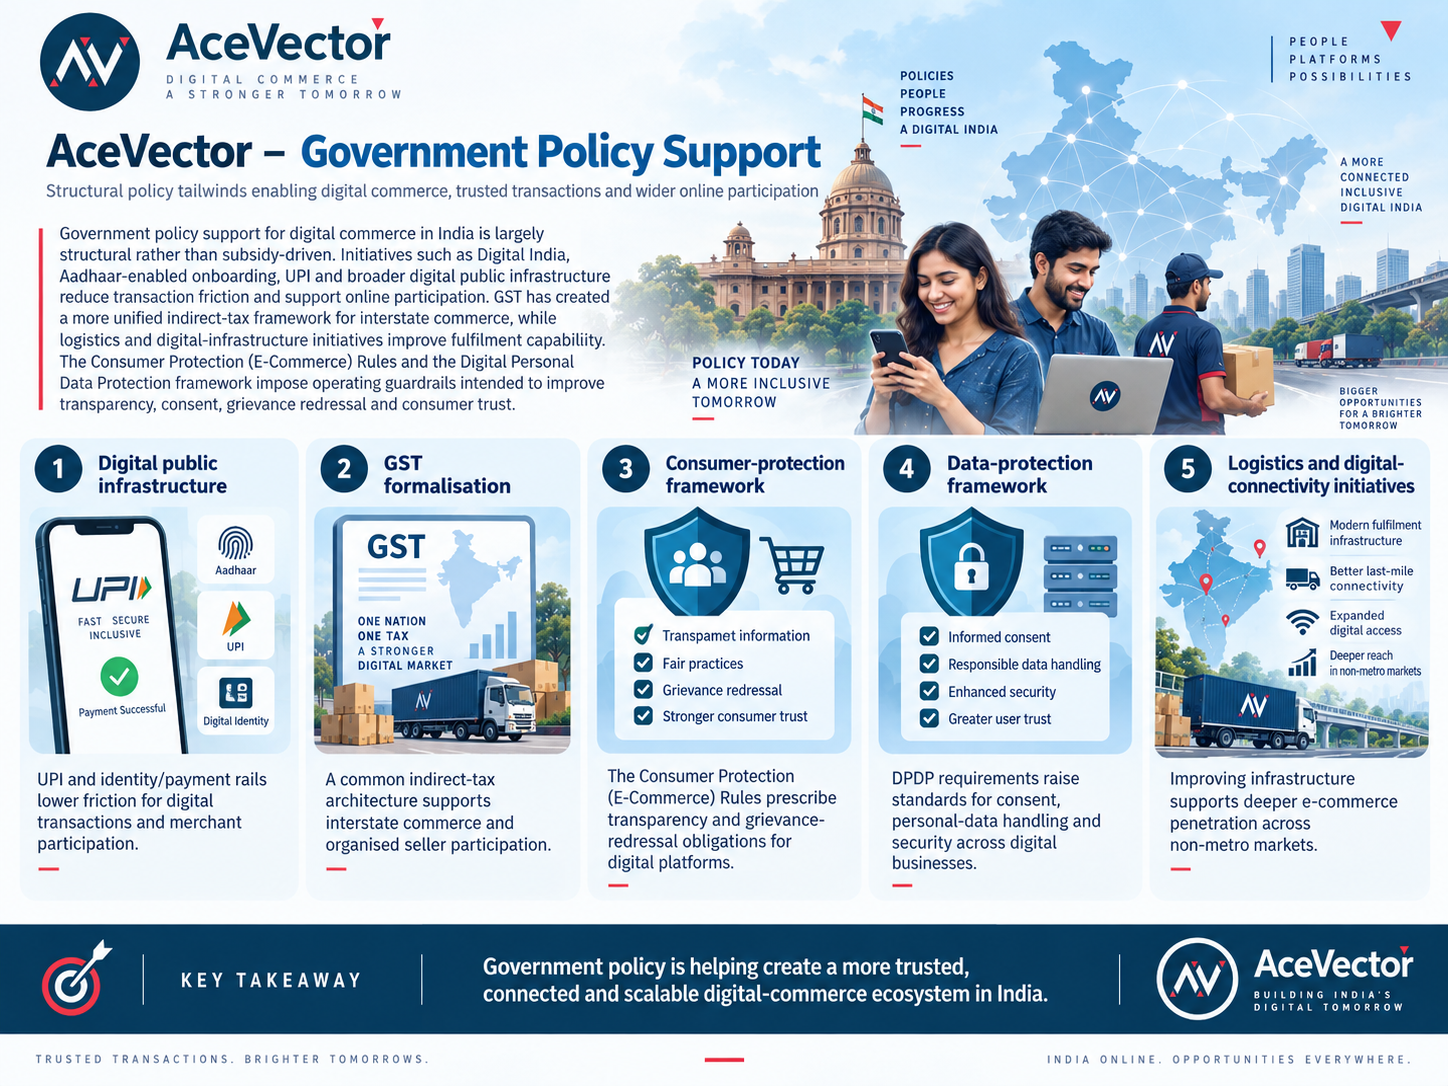
Policy support for digital commerce is largely structural rather than subsidy-driven. Digital India, Aadhaar-enabled onboarding, UPI and broader digital public infrastructure reduce transaction friction and support online participation. GST has created a more unified indirect-tax framework for interstate commerce, while logistics and digital-infrastructure initiatives improve fulfilment capability. At the same time, the Consumer Protection (E-Commerce) Rules and the Digital Personal Data Protection framework impose operating guardrails intended to improve transparency, consent, grievance redressal and consumer trust.
The key policies are:
Digital public infrastructure: UPI and identity/payment rails lower friction for digital transactions and merchant participation
GST formalisation: A common indirect-tax architecture supports interstate commerce and organised seller participation
Consumer-protection framework: E-commerce rules prescribe transparency and grievance-redressal obligations for digital platforms
Data-protection framework: DPDP requirements raise standards for consent, personal-data handling and security across digital businesses
Logistics and digital-connectivity initiatives: Improving infrastructure supports deeper e-commerce penetration across non-metro markets
Fundraise/Future Plans
Shareholding
Pre-issue shareholding
Promoter Holding 0.0%
Post-Issue Shareholding
Promoter Holding 0.0%
Category
Pre-Issue%Post-Issue%
Promoters
Starfish I Pte. Ltd.
31.0%20.8%
Kunal Bahl
12.5%10.5%
Rohit Kumar Bansal
11.2%9.4%
Promoter Group
11.2%9.3%
Total Promoter Holding
65.9%50.0%
Additional Shareholders
Other Shareholders
34.1%50.0%
Total Additional Holding
34.1%50.0%
Total Shareholding
100.0%100.0%
- Overview
- Business
- Financial Highlights
- Industry Overview
- Fundraise/Future Plans
- Documentation
Get the Preqt App and keep in touch around the clock!
 Monitor your investments in real-time.
- Receive tailored deal suggestions.
- Get real-time updates and alerts.
