

ASK Investment Managers Limited
Sustainable Long-Term WealthDisciplined Equity Investing
Unlisted Review and Rating
Speculative
DRHP Not FiledOverall Recommendation
ASKIM receives an overall score of 3.3/5, supporting a Speculative view. The Company has a profitable, cash-generative and lightly leveraged business with an established position in India’s growing wealth-management industry. However, slow recent revenue growth, declining FY25 operating EBITDA, the INR 119.5 Cr tax adjustment supporting reported profitability, limited Board independence, high related-party exposure and volatile unlisted pricing require caution. Investment may be considered only at an adequate liquidity and governance discount, with future revenue growth, recurring earnings, related-party transactions and the final resolution of the tax matter monitored closely.
PARAMETER
WEIGHT
SCORE
KEY FACTORS
Financial Performance
25.0%
4.0/5
Tax-normalising FY25 PBT at the statutory 25.17% rate gives approximately INR 321.1 Cr PAT, a 30.9% margin and approximately 19.0% ROE
Show more
Detailed Analysis
Revenue increased from INR 927.0 Cr in FY23 to INR 1,037.7 Cr in FY25, representing a 5.8% two-year CAGR. FY25 revenue declined 2.3% YoY
Operating EBITDA was approximately INR 376.1 Cr, producing a 36.2% margin. EBITDA declined approximately 20% YoY
Reported PAT was INR 443.6 Cr, giving a 42.7% reported PAT margin
Debt securities and lease liabilities were approximately INR 75.9 Cr against INR 1,813.5 Cr equity, producing 0.04x D/E
PAT attributable to owners divided by average attributable equity gives approximately 26.4% reported ROE
Industry
25.0%
3.0/5
India’s wealth, PMS and alternative investment industry remains in a growth phase, with an estimated 15% to 20% medium-term growth outlook. The opportunity is supported by increasing financialisation, affluent investor wealth and demand for professionally managed products.
Show more
Detailed Analysis
The relevant PMS, wealth and alternatives market has an approximately 15%-20% blended growth outlook. SEBI reported AIF commitments rising 25.6% to INR 16.9 Lakh Cr in FY26
PMS, AIF and mutual-fund activities are extensively regulated by SEBI
ASK has international distribution and UCITS exposure, but disclosed foreign-exchange earnings remain modest relative to group revenue
Management
25.0%
3.0/5
ASKIM benefits from highly experienced promoters and investment professionals with over three decades of industry experience. However, independent directors represent less than one-third of the Board, resulting in a governance-related deduction. Related-party service revenue of approximately INR 223 Cr, equivalent to 21.5% of operating revenue, is the principal management monitorable.
Show more
Detailed Analysis
Founder Sameer Koticha and senior investment leaders have approximately 29-38 years of experience
The disclosed Board had 3 independent directors out of 11, or approximately 27.3%
Services rendered to related entities were approximately INR 223.0 Cr, equivalent to 21.5% of operating revenue
Valuation Metrics
25.0%
3.0/5
At approximately INR 788 per share, ASKIM trades at 15.5x reported earnings, representing a significant discount to the selected listed-peer median of 38.8x. However, the tax-normalised P/E is higher at approximately 21.4x, while EV/EBITDA of 17.8x offers only a modest peer discount. The 3.79x P/B multiple, substantial price correction and limited liquidity reduce the attractiveness of the headline P/E discount.
Show more
Detailed Analysis
Public-peer median is approximately 38.8x, giving ASKIM a 60.1% reported-P/E discount
ASKIM’s 17.8x compares with a selected peer median of approximately 19.5x; peer/ASKIM ratio is about 1.09x
Current P/B is approximately 3.79x
TOTAL
100%
3.3/5
Weighted Composite Score
Per Share Price
₹888.0
As of 14 Oct 2026
Lot Size
100.0 Shares
Minimum Investment
₹88,800.0 / 100 shares
Market Cap. (₹ Cr)
Revenue FY’25
PAT FY’25
P/E Multiple
Face Value
₹ 2.0Offer Price
₹ 788.0Lot Size
100.0 sharesSale Type
Secondary SharePAT FY’25
₹ 443.6 CrPAT Margin (%)
42.7 %P/E Multiple
15.5xCAGR Growth 2Y
5.8 %ROE (FY’25)
26.4 %ROCE (FY’25)
24.5 %Price to Book Value ratio
3.8xDebt/Equity (FY’25)
0.0xMerchant banker appointed
❌ NoCompany Website
www.askfinancials.com/ask-investment-managers/our-portfoliosDisclaimer: Unlisted shares are unregulated & illiquid. This is NOT investment advice. Please do your own due diligence before investing.
Minimum Investment
₹88,800.0 / 100 sharesShares Lot 100 X 1
Investment amount
₹88,800.0
Overview
Business
Business Model
Geographical Presence
Sales Channel
Key Risk Factor
Financial Highlights
Income Statement
Revenue growth with EBITDA and PAT margins
| Financial Metric | FY 2024 | FY 2025 |
|---|---|---|
| Revenue (₹ Cr) | 1,062.5 | 1,037.7 |
| Growth (%) | 14.6% | -2.3% |
| EBITDA (₹ Cr) | 470.0 | 376.1 |
| EBITDA Margin (%) | 44.2% | 36.2% |
| PAT (₹ Cr) | 402.6 | 443.5 |
| PAT Margin (%) | 37.9% | 42.7% |
OBSERVATIONS & INSIGHTS
Revenue from operations declined 2.3% YoY to INR 1,037.7 Cr from INR 1,062.5 Cr in FY24, after having grown 14.6% in FY24. This indicates a temporary slowdown in top-line momentum despite continued expansion across asset management, alternatives and wealth management
EBITDA declined from approximately INR 470.0 Cr in FY24 to INR 376.1 Cr in FY25, while EBITDA margin compressed from 44.2% to 36.2%. The decline reflects increased investment in employees, technology, new platforms and geographic expansion, which raised the operating cost base during FY25
PAT increased from INR 402.6 Cr to INR 443.6 Cr, taking PAT margin from approximately 37.9% to 42.7%. However, the increase was driven substantially by a INR 119.46 Cr tax provision adjustment relating to earlier-period ESOP tax deductions rather than improvement in core profitability
Excluding the FY25 tax benefit on a simple basis, PAT would have been approximately INR 324 Cr, which is below FY24 PAT. Hence, the key monitorable is whether ASKIM can restore revenue growth and EBITDA margins as investments in mutual funds, international platforms, technology and distribution begin contributing meaningfully to earnings
Balance Sheet
| Financial Metric | FY 2024 | FY 2025 | FY 2026 |
|---|---|---|---|
| EQUITY & LIABILITIES | ₹ 2,129.0 Cr | ₹ 2,157.3 Cr | ₹ 0.0 Cr |
| Net Worth | ₹ 1,560.2 Cr | ₹ 1,813.4 Cr | ₹ 0.0 Cr |
| Share Capital | ₹ 16.9 Cr | ₹ 17.4 Cr | ₹ 0.0 Cr |
| Reserves & Surplus | ₹ 1,543.3 Cr | ₹ 1,796.0 Cr | ₹ 0.0 Cr |
| Total Liabilities | ₹ 568.8 Cr | ₹ 343.9 Cr | ₹ 0.0 Cr |
| Current Liabilities | ₹ 503.3 Cr | ₹ 283.0 Cr | ₹ 0.0 Cr |
| Borrowings | ₹ 0.0 Cr | ₹ 0.0 Cr | ₹ 0.0 Cr |
| Trade Payables | ₹ 75.1 Cr | ₹ 65.9 Cr | ₹ 0.0 Cr |
| Other Current Liabilities | ₹ 428.2 Cr | ₹ 217.1 Cr | ₹ 0.0 Cr |
| Non-Current Liabilities | ₹ 65.5 Cr | ₹ 60.9 Cr | ₹ 0.0 Cr |
| Borrowings | ₹ 0.0 Cr | ₹ 0.0 Cr | ₹ 0.0 Cr |
| Other Non-Current Liabilities | ₹ 65.5 Cr | ₹ 60.9 Cr | ₹ 0.0 Cr |
| ASSETS | ₹ 2,129.0 Cr | ₹ 2,200.0 Cr | ₹ 0.0 Cr |
| Current Assets | ₹ 1,523.1 Cr | ₹ 1,496.6 Cr | ₹ 0.0 Cr |
| Trade Receivables | ₹ 224.7 Cr | ₹ 169.0 Cr | ₹ 0.0 Cr |
| Inventory | ₹ 0.0 Cr | ₹ 0.0 Cr | ₹ 0.0 Cr |
| Cash & Cash Equivalents | ₹ 425.5 Cr | ₹ 229.4 Cr | ₹ 0.0 Cr |
| Other Current Assets | ₹ 872.9 Cr | ₹ 1,098.2 Cr | ₹ 0.0 Cr |
| Non-Current Assets | ₹ 605.9 Cr | ₹ 703.4 Cr | ₹ 0.0 Cr |
| Fixed Assets | ₹ 25.5 Cr | ₹ 50.6 Cr | ₹ 0.0 Cr |
| Other Non-Current Assets | ₹ 580.4 Cr | ₹ 652.8 Cr | ₹ 0.0 Cr |
OBSERVATIONS & INSIGHTS
Net worth strengthened from approximately INR 1,388.7 Cr in FY23 to INR 1,560.2 Cr in FY24 and INR 1,813.5 Cr in FY25, providing a larger capital base for expansion across asset management, alternatives and wealth management
Total assets increased from approximately INR 1,894.8 Cr in FY23 to INR 2,199.9 Cr in FY25. The asset mix is dominated by investments, loans, receivables and liquid financial assets rather than heavy fixed infrastructure
Total liabilities fell sharply from INR 568.8 Cr in FY24 to INR 386.4 Cr in FY25, while current liabilities declined from INR 503.3 Cr to INR 283.0 Cr. This materially strengthened near-term liquidity metrics
Financial leverage remains modest: FY25 disclosed debt securities were only INR 42.6 Cr, while most liabilities comprised trade payables, leases, provisions, taxes and operating / financial liabilities
Cash and bank balances declined from approximately INR 292.4 Cr in FY23 to INR 229.4 Cr in FY25; however, FY25 current assets of INR 1,496.6 Cr remained substantially above current liabilities of INR 283.0 Cr
The consolidated balance sheet also carries loans and investments linked to the broader wealth / NBFC and investment ecosystem. Credit quality, liquidity and fair-value movements therefore remain relevant even though the parent franchise is primarily fee-led
Cash Flow
| Financial Metric | FY 2024 | FY 2025 |
|---|---|---|
CFO (₹ Cr) Cash generated from core business operations. | +562.9 Cr | +211.1 Cr |
CFI (₹ Cr) Cash used for investments and long-term assets. | -308.3 Cr | -59.8 Cr |
CFF (₹ Cr) Cash flow related to funding and borrowings. | -233.7 Cr | -166.8 Cr |
Working Capital
| Efficiency Metric | FY 2023 | FY 2024 | FY 2025 |
|---|---|---|---|
Debtor Days Average number of days taken to collect customer payments. | - | - | - |
Creditor Days Average time taken to pay suppliers and vendors. | - | - | - |
Inventory Days Average number of days inventory remains unsold. | - | - | - |
CCC (Cash Conversion Cycle) (Debtor Days + Inventory Days - Creditor Days) | - | - | - |
Financial Ratios
Measures the company’s leverage relative to shareholder equity.
OBSERVATIONS & INSIGHTS
ROE remained strong but moderated from approximately 27.8% in FY23 and 27.7% in FY24 to 26.4% in FY25 as the equity base expanded
Conventional financial leverage is low. The Group had no material disclosed borrowings in FY23-FY24 and INR 42.6 Cr of debt securities in FY25 against total equity of INR 1,813.5 Cr, implying debt/equity of only about 0.02x
The current ratio improved materially to approximately 5.29x in FY25 from 3.03x in FY24 because current liabilities fell sharply while current assets remained substantial
Interest coverage remains very high because finance cost is small relative to operating earnings; however, this ratio is less decision-useful than AUM growth, fee margins and investment performance for an asset / wealth manager
ROCE moderated from approximately 33.4% in FY24 to 24.5% in FY25 as EBIT declined and the capital base expanded. FY23 ROCE is not shown because the required FY22 opening capital-employed base was not available in the supplied consolidated data set
FY25 ROA was approximately 20.5%, demonstrating the asset-light economics of the core fee businesses despite investments and financial assets carried on the consolidated balance sheet
Industry Overview
Industry Drivers
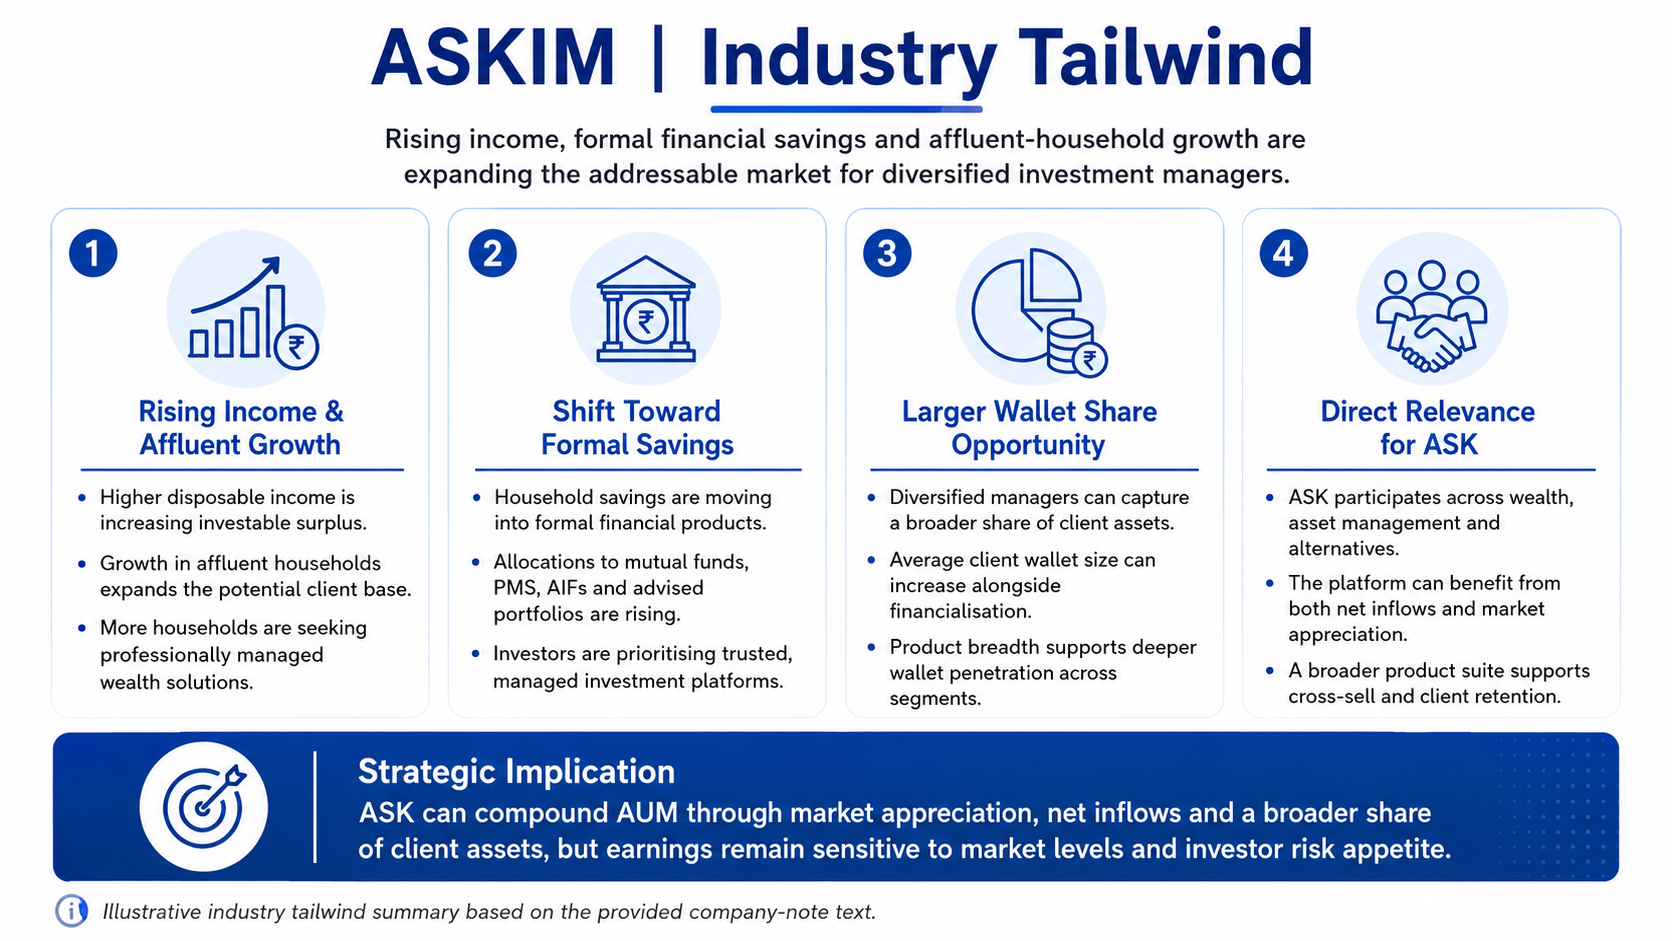
Financialisation and Affluent-Wealth Growth
Rising income, formal financial savings and growth in affluent households are increasing allocations to mutual funds, PMS, AIFs and professionally advised portfolios
This expands both the number of potential clients and the average wallet available to diversified managers
ASK can compound AUM through market appreciation, net inflows and a broader share of client assets, but earnings remain sensitive to market levels and investor risk appetite
Product Expansion and Mutual-Fund Optionality
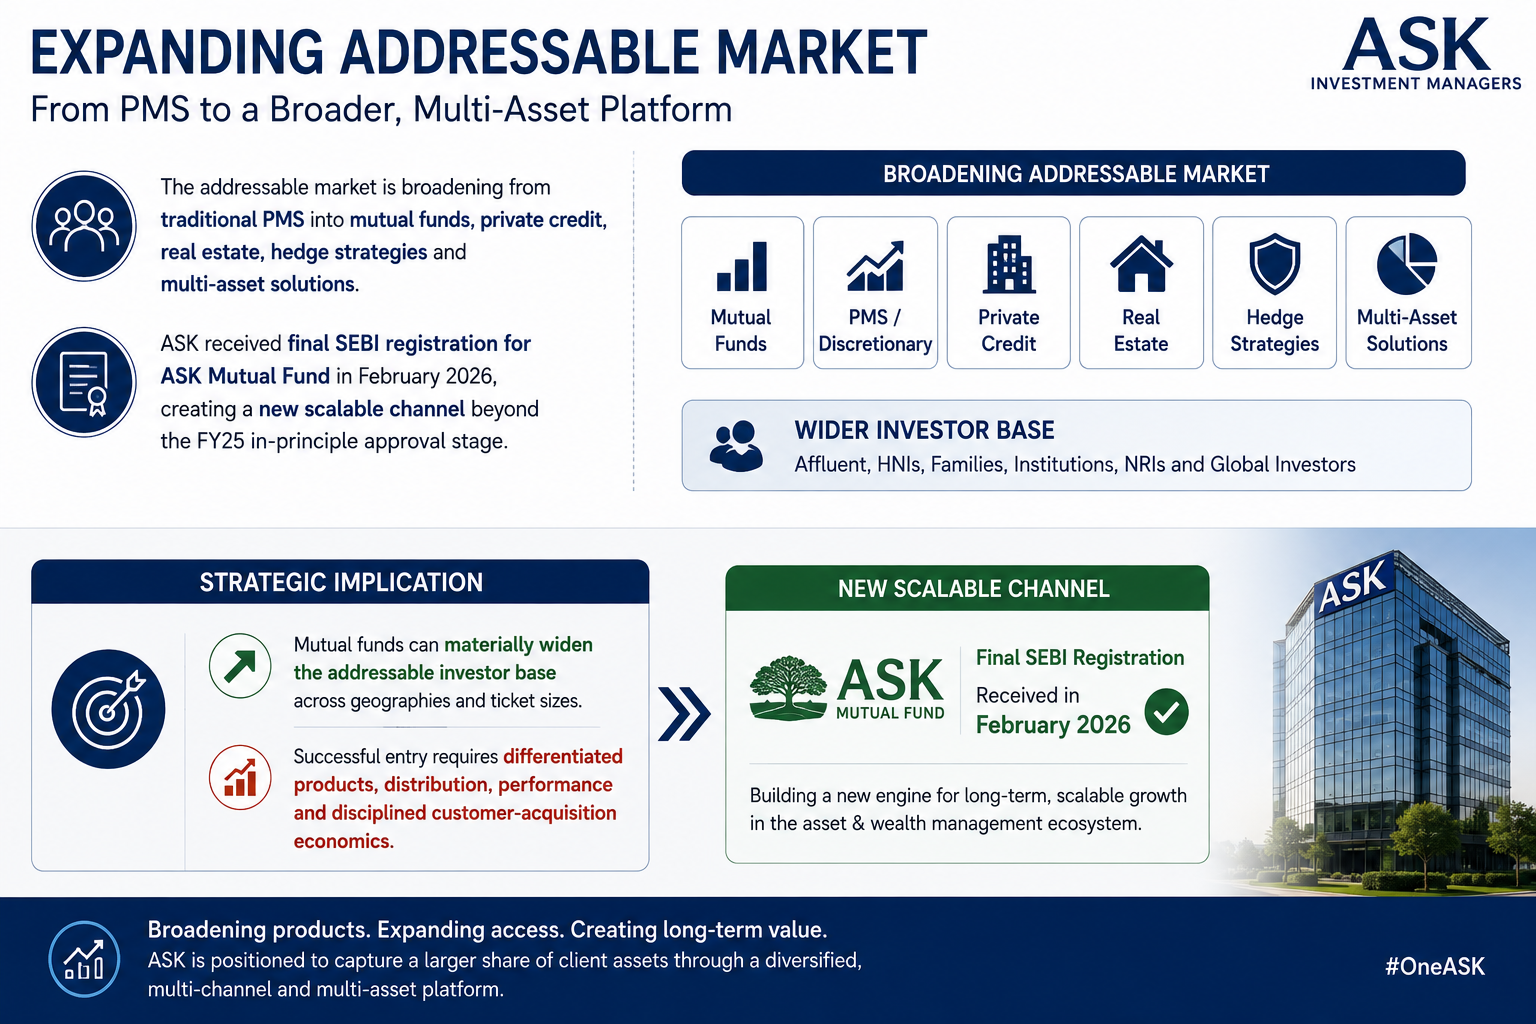
The addressable market is broadening from traditional PMS into mutual funds, private credit, real estate, hedge strategies and multi-asset solutions
ASK received final SEBI registration for ASK Mutual Fund in February 2026, creating a new scalable channel beyond the FY25 in-principle approval stage
Mutual funds can materially widen the addressable investor base, but successful entry requires differentiated products, distribution, performance and disciplined customer-acquisition economics
Distribution, Digital and Client Engagement
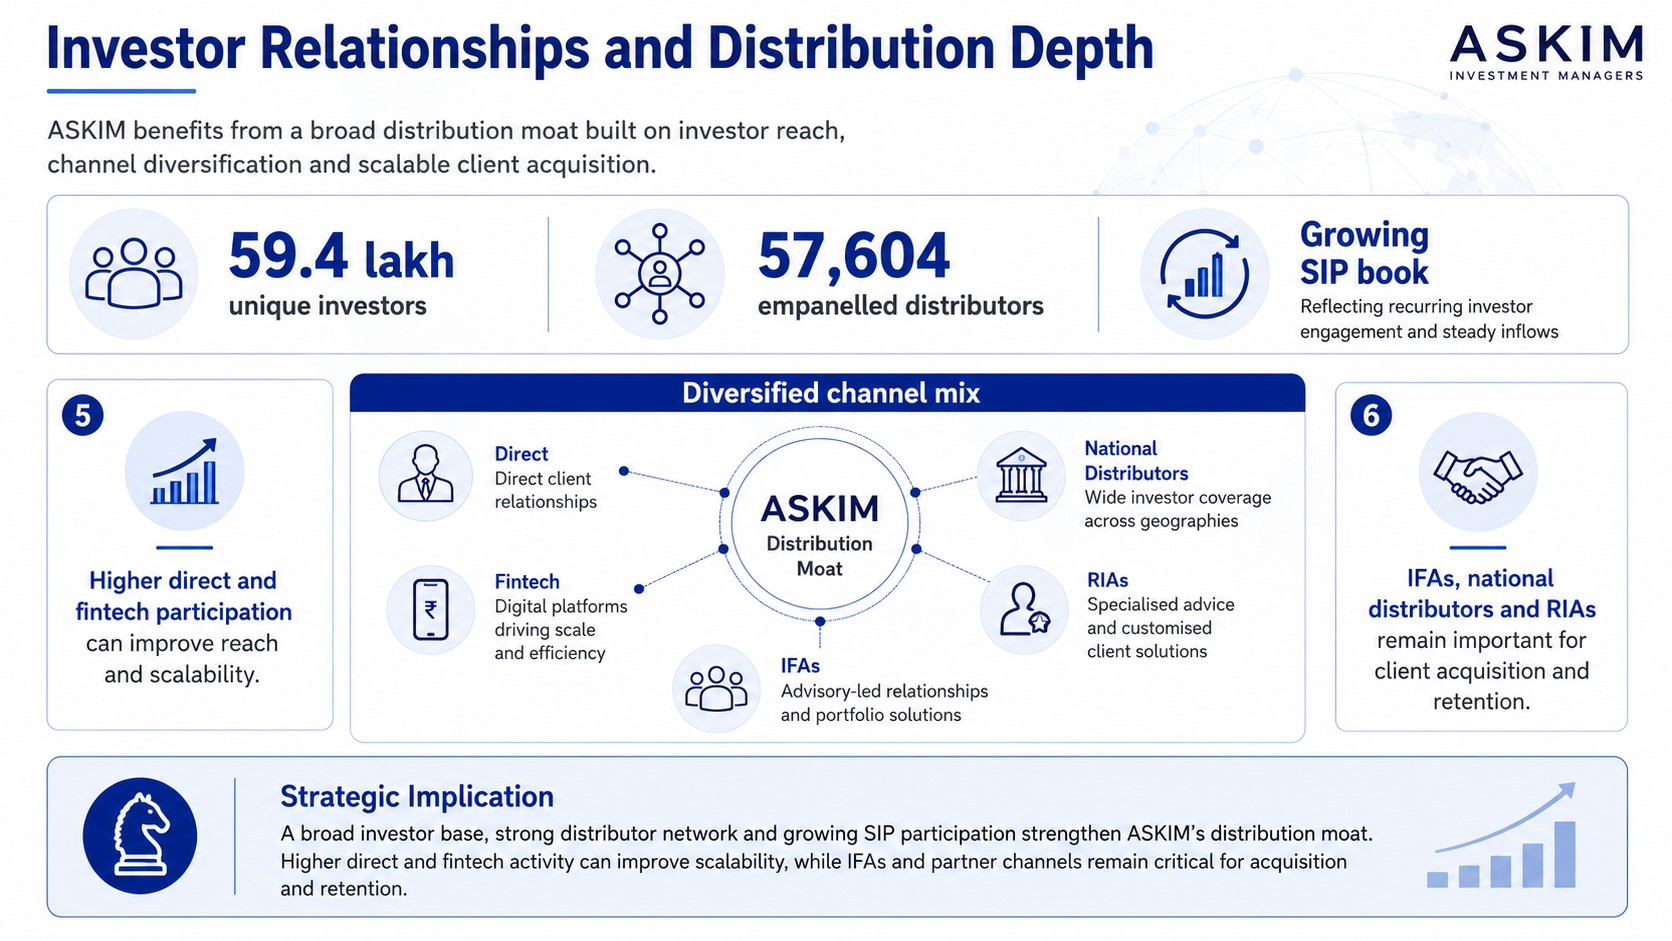
Wealth and asset management remain trust-led businesses where investment performance, adviser quality and service standards influence acquisition and retention
Digital onboarding and servicing can improve reach and productivity without fully replacing high-touch advice for affluent clients
Higher RM productivity, partner reach and digital adoption can improve operating leverage, while poor client experience or weak investment performance can quickly affect net flows
International and Alternatives Penetration
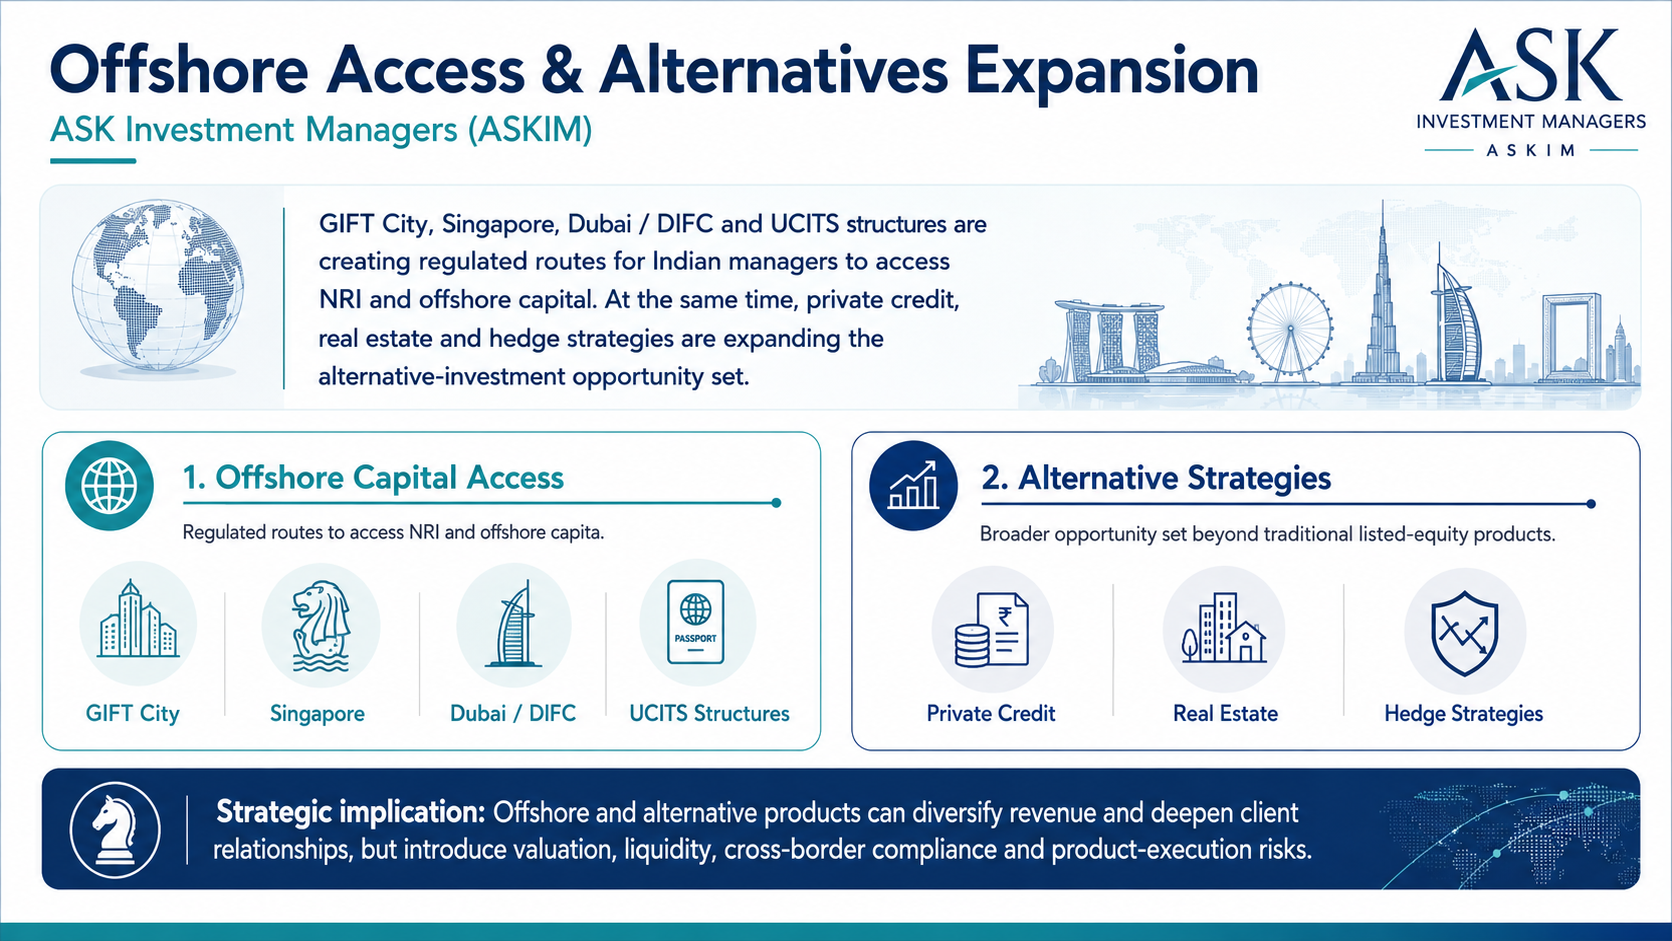
GIFT City, Singapore, Dubai / DIFC and UCITS structures are creating regulated routes for Indian managers to access NRI and offshore capital. At the same time, private credit, real estate and hedge strategies are expanding the alternative-investment opportunity set
Offshore and alternative products can diversify revenue and deepen client relationships, but introduce valuation, liquidity, cross-border compliance and product-execution risks
Government Policy Support
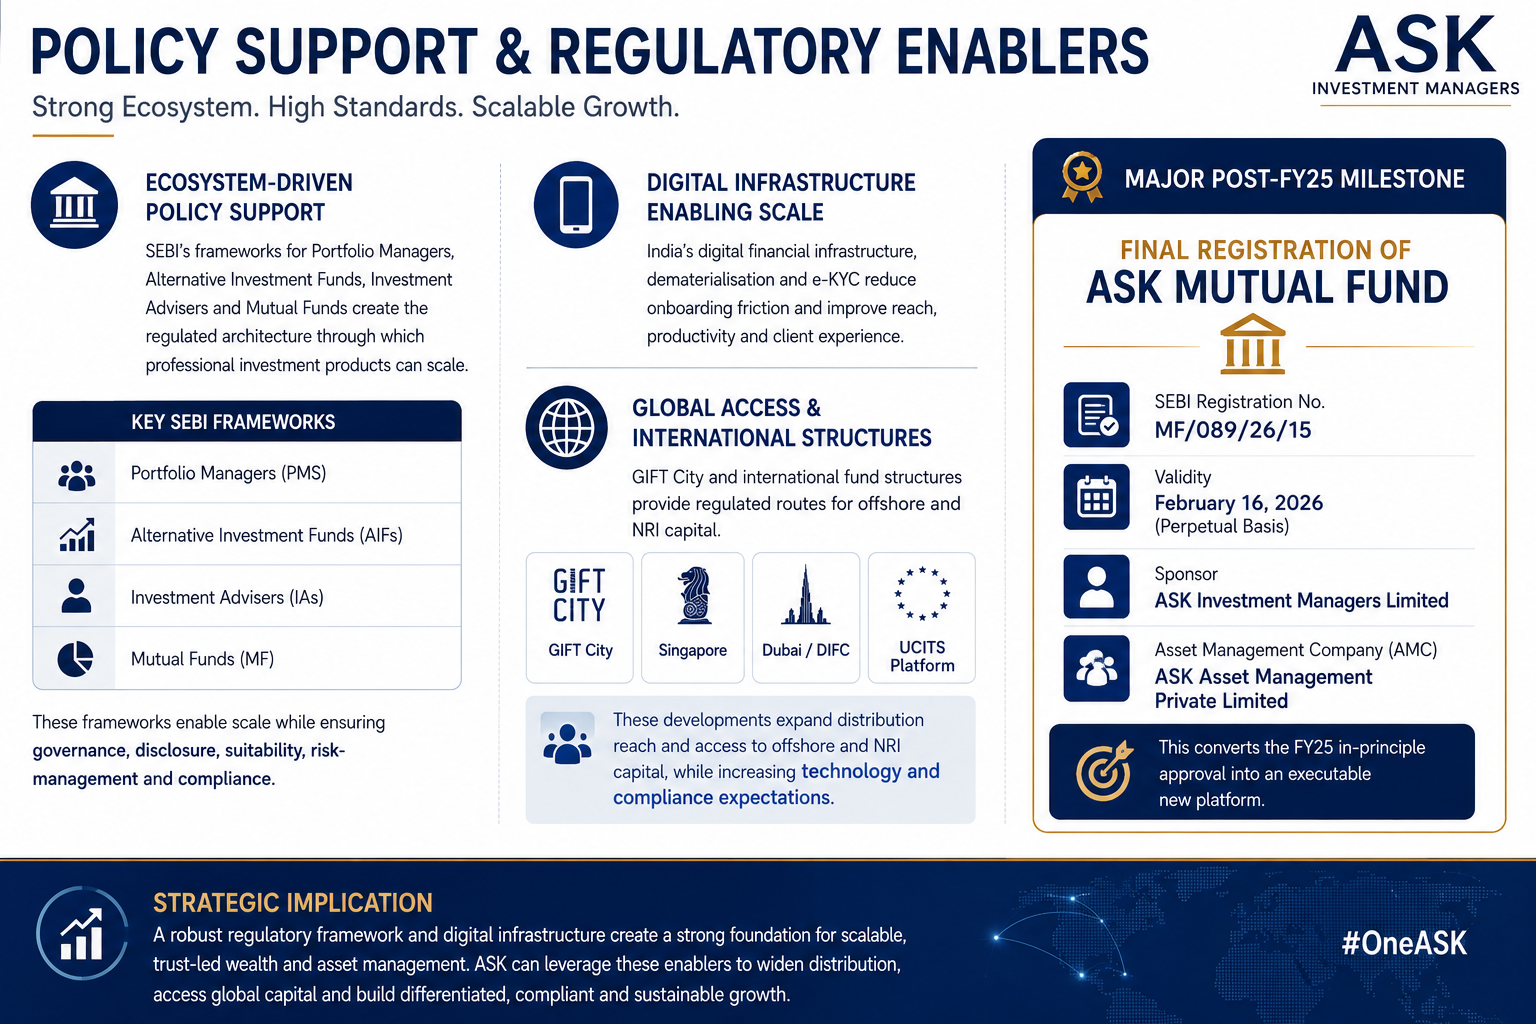
Policy support for ASK is ecosystem-driven rather than subsidy-driven. SEBI’s frameworks for Portfolio Managers, Alternative Investment Funds, Investment Advisers and Mutual Funds create the regulated architecture through which professional investment products can scale, while also imposing governance, disclosure, suitability, risk-management and compliance obligations
India’s digital financial infrastructure, dematerialisation and e-KYC reduce onboarding friction, while GIFT City and international fund structures provide regulated routes for offshore and NRI capital. These developments can expand distribution reach but also increase technology and compliance expectations
A major post-FY25 milestone is final registration of ASK Mutual Fund with SEBI (Registration No. MF/089/26/15) with validity from February 16, 2026 on a perpetual basis. AMFI identifies ASK Investment Managers Limited as sponsor and ASK Asset Management Private Limited as the AMC. This converts the FY25 in-principle approval into an executable new platform
Fundraise/Future Plans
Shareholding
Pre-issue shareholding
Promoter Holding 0.0%
Category
Pre-Issue%
Promoters
0.0%
Total Promoter Holding
0.0%
Additional Shareholders
0.0%
Total Additional Holding
0.0%
Total Shareholding
0.0%
- Overview
- Business
- Financial Highlights
- Industry Overview
- Fundraise/Future Plans
- Documentation
Get the Preqt App and keep in touch around the clock!
 Monitor your investments in real-time.
- Receive tailored deal suggestions.
- Get real-time updates and alerts.
