

Bharat Hotels Ltd
Luxury ExperiencesTimeless Indian Hospitality
Unlisted Review and Rating
Speculative
DRHP Not FiledDelivering Timeless Indian Hospitality Through Luxury and Personalized Experiences
Revenue increased from INR 800.1 Cr in FY23 to INR 901.3 Cr in FY25, representing a 6.1% 2-year CAGR, while FY25 EBITDA stood at INR 390.3 Cr with a 43.3% margin, PAT at INR 85.3 Cr with a 9.5% margin, D/E at 1x, ROE at approximately 9.5% and OCF at INR 372.5 Cr. The Indian hospitality industry is projected to grow 7.0%-9.0% in FY27, while Bharat Hotels generated INR 102.6 Cr of foreign-exchange earnings. Management metrics include 35+ years of leadership experience, 37.5% Board independence, promoter-group shares equivalent to approximately 51.0% of company equity pledged under the NCD security arrangement, INR 43.1 Cr of Holding Company contingent claims and recurring RPTs of approximately 7.5% of revenue. At the prevailing valuation, the Company trades at 33.1x P/E, 9.7x EV/EBITDA, 2.9x P/B and 3.1x FY25 P/S, with an 8.8% P/E discount and 47.1% EV/EBITDA discount to selected listed-peer medians, while the unlisted share price declined approximately 5.3% over the latest 30-day period.
PARAMETER
WEIGHT
SCORE
KEY FACTORS
Financial Performance
25.0%
4.0/5
Revenue recorded a 6.1% 2-year CAGR, FY25 EBITDA margin stood at 43.3%, PAT margin at 9.5%, D/E at 0.99x, estimated ROE at 9.5%, and operating cash flow remained positive at INR 372.5 Cr. Net debt declined 15.1% YoY to INR 867.3 Cr.
Show more
Detailed Analysis
Consolidated revenue increased from INR 800.1 Cr in FY23 to INR 862.3 Cr in FY24 and INR 901.3 Cr in FY25, representing a 6.1% FY23-FY25 2-year CAGR; FY25 revenue growth was 4.5% YoY
EBITDA increased from INR 371.8 Cr in FY24 to INR 390.3 Cr in FY25, +5.0% YoY; EBITDA margin improved from 43.1% to 43.3%
PAT increased marginally from INR 84.8 Cr in FY24 to INR 85.3 Cr in FY25, +0.6% YoY; PAT margin declined from 9.8% to 9.5%
FY25 borrowings stood at approximately INR 933.3 Cr against total equity of approximately INR 944.3 Cr, resulting in D/E of approximately 1x; net debt declined to INR 867.3 Cr from INR 1,021.4 Cr in FY24
FY25 PAT of INR 85.3 Cr against average FY24-FY25 total equity of approximately INR 902.5 Cr resulted in estimated ROE of 9.5%
Industry
25.0%
2.0/5
Indian hospitality revenue is projected to grow 7.0%-9.0% in FY27, with premium occupancy of 72.0%-74.0%. The sector is classified as Early Mature, the estimated HHI is <1,200, regulatory risk is Moderate, and Bharat Hotels generated INR 102.6 Cr of foreign-exchange earnings, equivalent to approximately 13.0% of standalone revenue.
Show more
Detailed Analysis
ICRA expects Indian hospitality-industry revenues to grow 7.0%-9.0% in FY27, following approximately 11.0% growth in FY26. Premium hotel occupancy is projected at 72.0%-74.0%
Regulatory risk is Moderate, with hotel operations subject to central/state licences, FSSAI, environmental, legal-metrology and local approvals; the FY25 report states necessary licences/registrations were maintained
FY25 foreign-exchange earnings were INR 102.6 Cr, approximately 13.0% of standalone revenue, compared with INR 122.2 Cr in FY24, representing a 16.0% YoY decline
Management
25.0%
3.0/5
Leadership experience stands at 35+ years, Board independence at 37.5%, promoter-group shares equivalent to approximately 51.0% of total company equity are pledged under the NCD security arrangement, contingent claims at the Holding Company were approximately INR 43.1 Cr, and estimated recurring RPTs represented approximately 7.5% of consolidated revenue.
Show more
Detailed Analysis
Dr. Jyotsna Suri has been associated with Bharat Hotels since 1989, representing 35+ years of experience with the Company by FY25. The Company's earlier disclosure records 34 years of experience
FY25 Board comprised 8 directors, including 3 Independent Directors, resulting in 37.5% independent representation
Estimated recurring FY25 P&L-related RPTs were approximately INR 67.3 Cr, equivalent to approximately 7.5% of consolidated revenue, excluding financing-principal movements and year-end balances
Promoter-group securities comprising approximately 38.8 Mn Bharat Hotels shares, equivalent to 51.0% of total equity, were pledged under the January 2023 NCD security arrangement. FY25 Holding Company contingent claims additionally aggregated approximately INR 43.1 Cr across direct tax, indirect tax, stamp duty and other matters
Valuation Metrics
25.0%
4.5/5
The CompaEstimated enterprise value is approximately INR 3,794.0 Cr against FY25 EBITDA of INR 390.3 Cr, resulting in 9.7x EV/EBITDA. The selected listed-peer median is approximately 18.4x, resulting in a 47.1% discount.ny is valued at approximately 33.1x P/E, 9.7x EV/EBITDA, 2.9x P/B and 3.1x FY25 P/S. P/E represents an 8.8% discount to the selected 36.3x peer median, while EV/EBITDA represents a 47.1% discount to the 18.4x peer median. The unlisted share price declined approximately 5.3% over the latest 30-day reference period.
Show more
Detailed Analysis
Bharat Hotels is valued at 33.1x P/E. Current P/Es of IHCL, EIH, Chalet Hotels and Lemon Tree are approximately 48.9x, 32.4x, 35.8x and 36.7x, respectively, giving a peer median of 36.3x. Bharat Hotels therefore trades at an 8.8% discount to the peer median
Estimated enterprise value is approximately INR 3,794.0 Cr against FY25 EBITDA of INR 390.3 Cr, resulting in 9.7x EV/EBITDA. The selected listed-peer median is approximately 18.4x, resulting in a 47.1% discount/
The Company is valued at approximately 2.9x P/B, against the stated FY25 valuation
Indicative unlisted price stood at INR 355.0/share on August 17, 2026, representing a 5.3% decline over the latest 30-day period
TOTAL
100%
3.4/5
Weighted Composite Score
Per Share Price
₹365.0
As of 14 Oct 2026
Lot Size
100.0 Shares
Minimum Investment
₹36,500.0 / 100 shares
Market Cap. (₹ Cr)
Revenue FY’25
PAT FY’25
P/E Multiple
Face Value
₹ 10.0Offer Price
₹ 355.0Lot Size
100.0 sharesSale Type
Unlisted SharesPAT FY’25
₹ 85.3 CrPAT Margin (%)
9.5 %P/E Multiple
33.0xCAGR Growth 3Y
34.7 %ROE (FY’25)
8.2 %ROCE (FY’25)
16.6 %Price to Book Value ratio
2.9xDebt/Equity (FY’26)
0.9xMerchant banker appointed
❌ NoCompany Website
share.google/EEGtgYUwPjdJFvPz7Disclaimer: Unlisted shares are unregulated & illiquid. This is NOT investment advice. Please do your own due diligence before investing.
Minimum Investment
₹36,500.0 / 100 sharesShares Lot 100 X 1
Investment amount
₹36,500.0
Overview
Business
Business Model
Geographical Presence
Sales Channel
Key Risk Factor
Financial Highlights
Income Statement
Revenue growth with EBITDA and PAT margins
| Financial Metric | FY 2023 | FY 2024 | FY 2025 |
|---|---|---|---|
| Revenue (₹ Cr) | 800.1 | 862.3 | 901.3 |
| Growth (%) | 117.0% | 7.8% | 4.5% |
| EBITDA (₹ Cr) | 364.0 | 371.8 | 390.3 |
| EBITDA Margin (%) | 45.5% | 43.1% | 43.3% |
| PAT (₹ Cr) | 49.6 | 84.8 | 85.3 |
| PAT Margin (%) | 6.2% | 9.8% | 9.5% |
OBSERVATIONS & INSIGHTS
Revenue increased from INR 800.1 Cr in FY23 to INR 901.3 Cr in FY25. Growth moderated from the post-pandemic rebound in FY23 to 7.8% in FY24 and 4.5% in FY25, indicating a transition from recovery-led growth to a more normalised demand environment.
EBITDA increased from INR 364.4 Cr to INR 390.3 Cr over FY23-FY25. EBITDA margin remained structurally high at 43-45%, demonstrating strong operating leverage in the hotel asset base.
PAT increased from INR 49.6 Cr in FY23 to INR 84.8 Cr in FY24 and remained broadly stable at INR 85.3 Cr in FY25. The modest FY25 PAT growth reflects the continued burden of high finance costs despite stable operating profitability.
The FY22-FY25 consolidated revenue CAGR is approximately 34.7%, but this is materially influenced by the low pandemic-affected FY22 base and should not be extrapolated as a normalised forward growth rate.
Balance Sheet
| Financial Metric | FY 2024 | FY 2025 | FY 2026 |
|---|---|---|---|
| EQUITY & LIABILITIES | ₹ 2,337.1 Cr | ₹ 2,248.4 Cr | ₹ 76.0 Cr |
| Net Worth | ₹ 860.8 Cr | ₹ 944.3 Cr | ₹ 76.0 Cr |
| Share Capital | ₹ 76.0 Cr | ₹ 76.0 Cr | ₹ 76.0 Cr |
| Reserves & Surplus | ₹ 784.8 Cr | ₹ 868.3 Cr | ₹ 0.0 Cr |
| Total Liabilities | ₹ 1,476.3 Cr | ₹ 1,304.1 Cr | ₹ 0.0 Cr |
| Current Liabilities | ₹ 278.8 Cr | ₹ 230.8 Cr | ₹ 0.0 Cr |
| Borrowings | ₹ 87.5 Cr | ₹ 34.8 Cr | ₹ 0.0 Cr |
| Trade Payables | ₹ 89.4 Cr | ₹ 108.2 Cr | ₹ 0.0 Cr |
| Other Current Liabilities | ₹ 101.9 Cr | ₹ 87.8 Cr | ₹ 0.0 Cr |
| Non-Current Liabilities | ₹ 1,197.5 Cr | ₹ 1,073.3 Cr | ₹ 0.0 Cr |
| Borrowings | ₹ 1,019.8 Cr | ₹ 887.1 Cr | ₹ 0.0 Cr |
| Other Non-Current Liabilities | ₹ 177.7 Cr | ₹ 186.2 Cr | ₹ 0.0 Cr |
| ASSETS | ₹ 2,337.0 Cr | ₹ 2,248.5 Cr | ₹ 0.0 Cr |
| Current Assets | ₹ 147.6 Cr | ₹ 116.2 Cr | ₹ 0.0 Cr |
| Trade Receivables | ₹ 25.6 Cr | ₹ 20.4 Cr | ₹ 0.0 Cr |
| Inventory | ₹ 17.3 Cr | ₹ 16.0 Cr | ₹ 0.0 Cr |
| Cash & Cash Equivalents | ₹ 75.3 Cr | ₹ 55.2 Cr | ₹ 0.0 Cr |
| Other Current Assets | ₹ 29.4 Cr | ₹ 24.6 Cr | ₹ 0.0 Cr |
| Non-Current Assets | ₹ 2,189.4 Cr | ₹ 2,132.3 Cr | ₹ 0.0 Cr |
| Fixed Assets | ₹ 1,592.1 Cr | ₹ 1,560.0 Cr | ₹ 0.0 Cr |
| Other Non-Current Assets | ₹ 597.3 Cr | ₹ 572.3 Cr | ₹ 0.0 Cr |
OBSERVATIONS & INSIGHTS
The balance sheet is deleveraging: total borrowings declined from approximately INR 1,347.1 Cr in FY23 to INR 921.9 Cr in FY25, a reduction of about INR 425.2 Cr over two years.
Net worth increased from INR 775.0 Cr in FY23 to INR 944.3 Cr in FY25, while owners' equity increased to INR 1,040.4 Cr before the negative non-controlling-interest balance.
Total assets reduced from INR 2,473.8 Cr to INR 2,248.4 Cr, reflecting asset disposals / reclassification, depreciation and debt reduction rather than aggressive balance-sheet expansion.
Cash and bank balances declined from INR 102.4 Cr in FY23 to INR 55.2 Cr in FY25 as liquidity was deployed toward financing outflows and debt repayment.
The Group remains asset-heavy, with property, plant and equipment of INR 1,560.0 Cr in FY25 plus substantial capital work-in-progress, right-of-use assets and goodwill within other non-current assets.
Current liabilities exceed current assets, creating a negative working-capital position. This is partly supported by strong recurring operating cash generation but increases sensitivity to debt maturities and financing access.
Cash Flow
| Financial Metric | FY 2023 | FY 2024 | FY 2025 |
|---|---|---|---|
CFO (₹ Cr) Cash generated from core business operations. | +317.1 Cr | +374.7 Cr | +372.5 Cr |
CFI (₹ Cr) Cash used for investments and long-term assets. | +32.9 Cr | +37.2 Cr | -7.6 Cr |
CFF (₹ Cr) Cash flow related to funding and borrowings. | -368.9 Cr | -421.7 Cr | +378.1 Cr |
Working Capital
| Efficiency Metric | FY 2023 | FY 2024 | FY 2025 |
|---|---|---|---|
Debtor Days Average number of days taken to collect customer payments. | - | - | - |
Creditor Days Average time taken to pay suppliers and vendors. | - | - | - |
Inventory Days Average number of days inventory remains unsold. | - | - | - |
CCC (Cash Conversion Cycle) (Debtor Days + Inventory Days - Creditor Days) | - | - | - |
Financial Ratios
Measures the company’s leverage relative to shareholder equity.
OBSERVATIONS & INSIGHTS
Leverage improved materially: debt/equity reduced from 1.7x in FY23 to 1.3x in FY24 and 1.0x in FY25 as the Group used strong operating cash generation to repay borrowings.
Interest coverage remains the principal financial constraint. It improved only modestly from 1.7x in FY23-FY24 to 1.8x in FY25 because finance costs remained high at INR 188.3 Cr despite debt reduction.
ROCE improved from 13.7% in FY23 to 16.7% in FY25, indicating better operating returns on the asset and capital base as hospitality demand normalised.
ROE rose to 10.1% in FY24 before moderating to 9.0% in FY25 as owners' equity expanded faster than profit attributable to owners.
ROA improved from 2.0% to 3.7% across FY23-FY25, but remains moderate because the business is asset-heavy, with more than INR 2,100 Cr of non-current assets.
The current ratio fell to approximately 0.5x in FY24 and FY25. This reflects a negative working-capital structure and debt repayment from liquid resources; liquidity therefore needs to be assessed together with strong operating cash flow rather than the current ratio in isolation.
Industry Overview
Industry Drivers
Expansion of Technological Capabilities
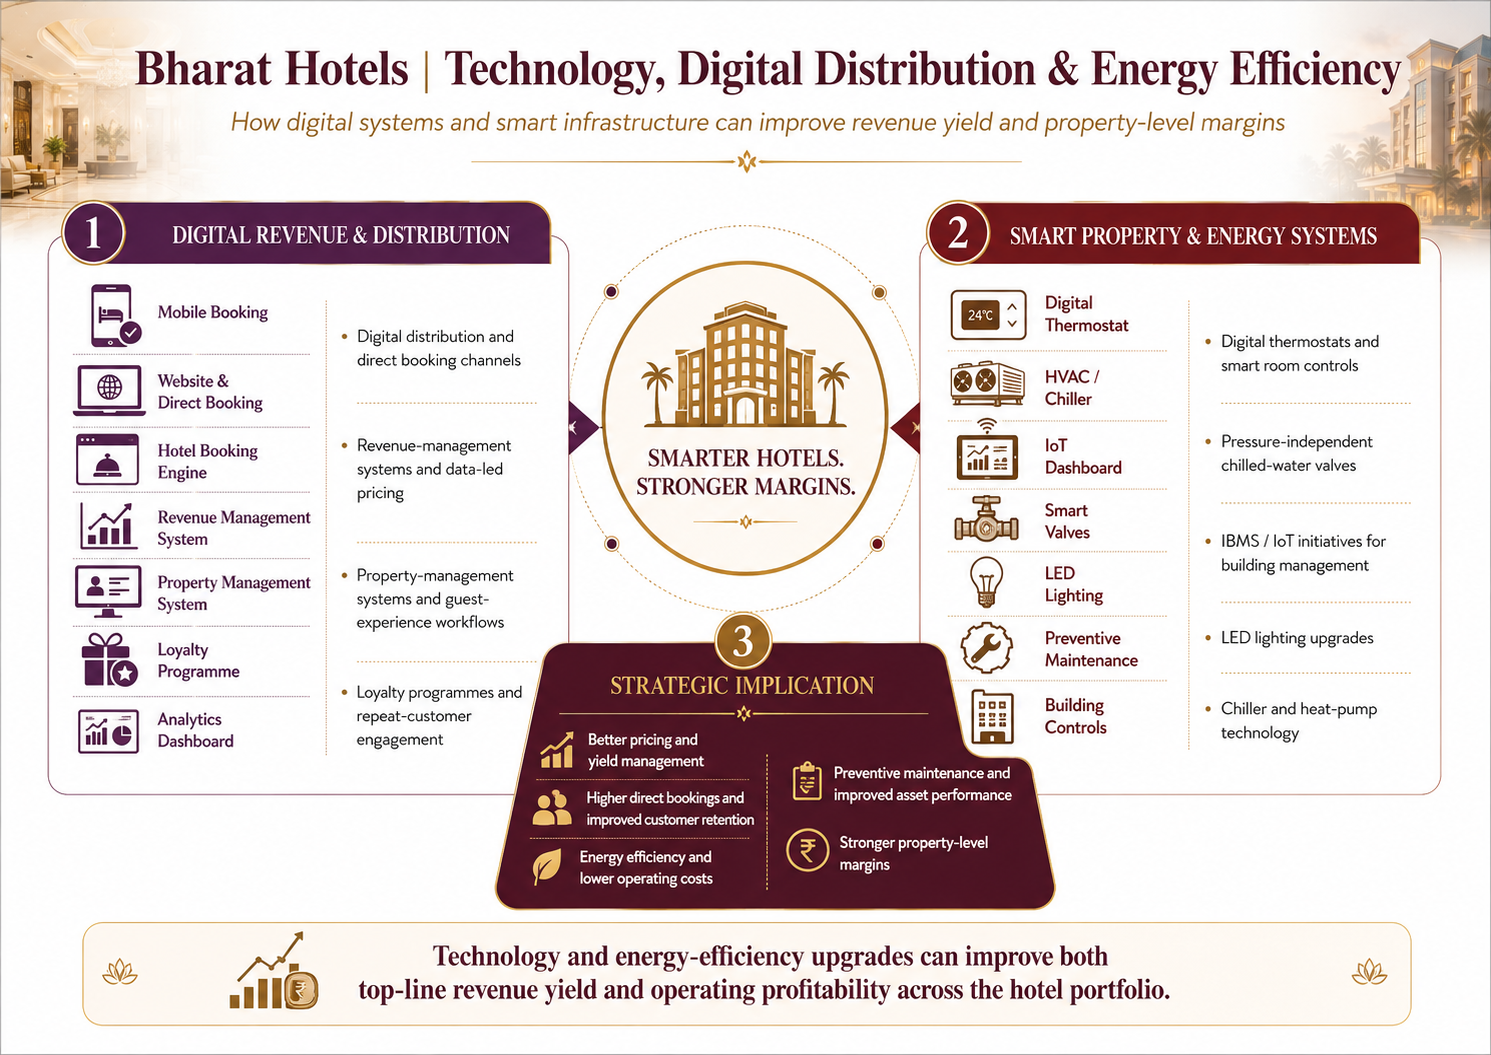
Digital distribution, revenue-management systems, property-management systems, loyalty programmes and data-led pricing are increasingly important to hotel profitability
Bharat Hotels is also upgrading building-management and energy systems, including digital thermostats, pressure-independent chilled-water valves, IBMS / IoT initiatives, LED lighting and chiller / heat-pump technology
Strategic implication: better pricing, direct bookings, energy efficiency and preventive maintenance can improve both revenue yield and property-level margins
Capacity Expansion
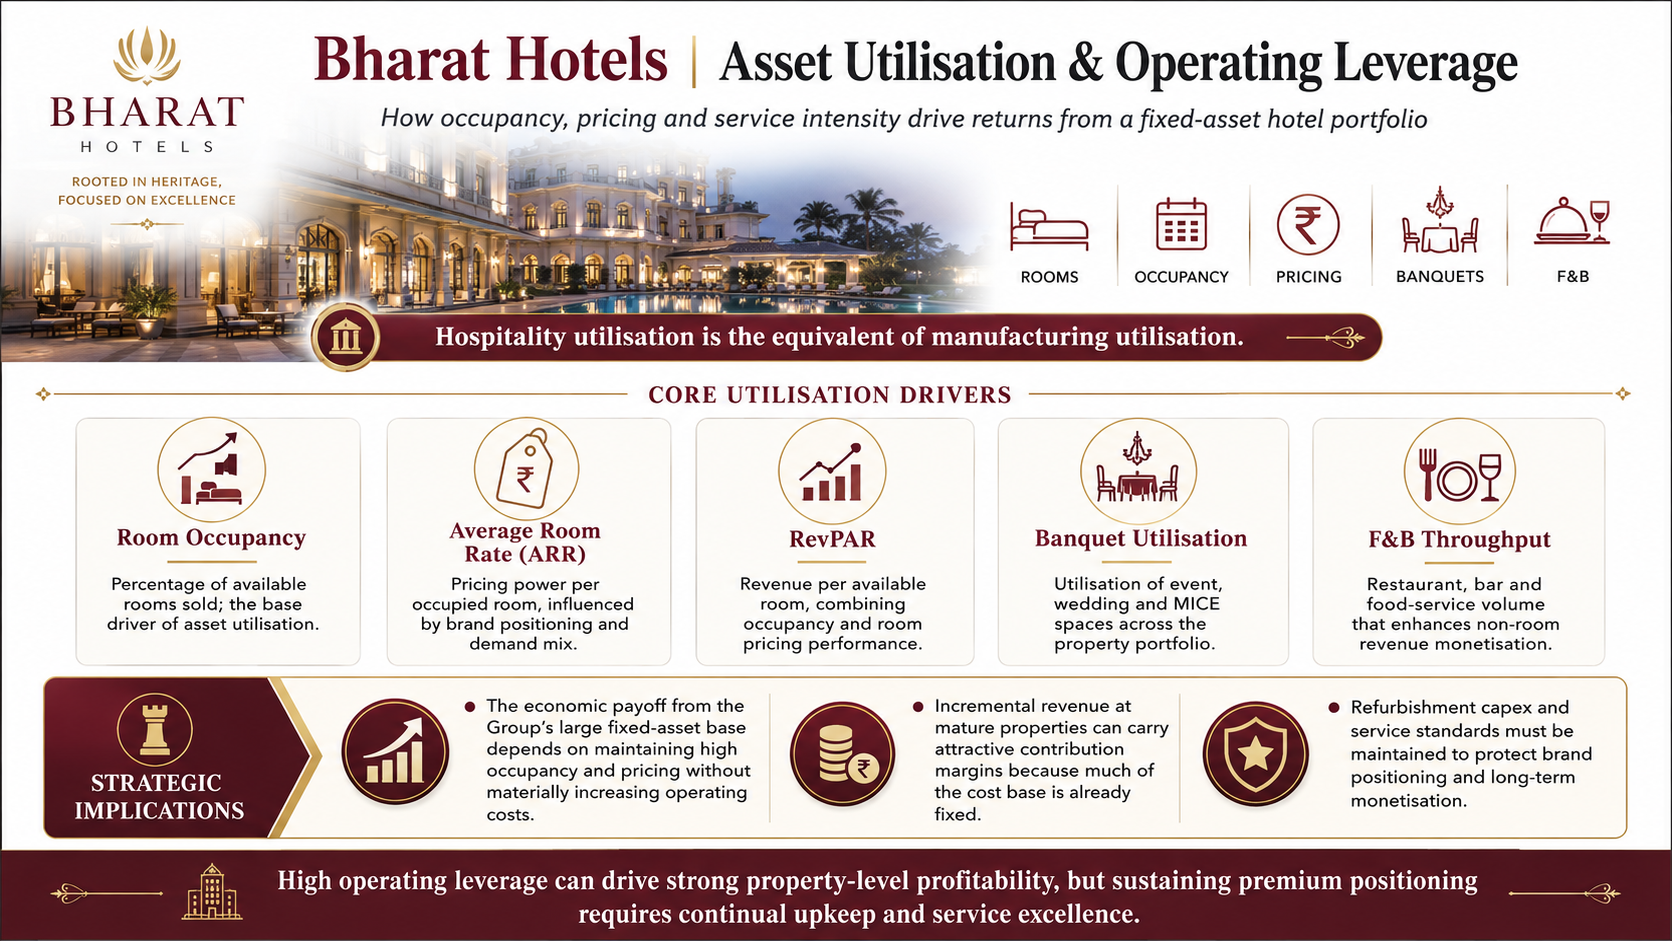
For hotels, the equivalent of manufacturing utilisation is room occupancy, average room rate, RevPAR, banquet utilisation and F&B throughput
The economic payoff from the Group's large fixed-asset base depends on maintaining high occupancy and pricing without materially increasing operating costs
Strategic implication: incremental revenue at mature properties can carry attractive contribution margins, but refurbishment capex and service standards must be maintained to protect brand positioning
Geographic & Premium-Market Penetration
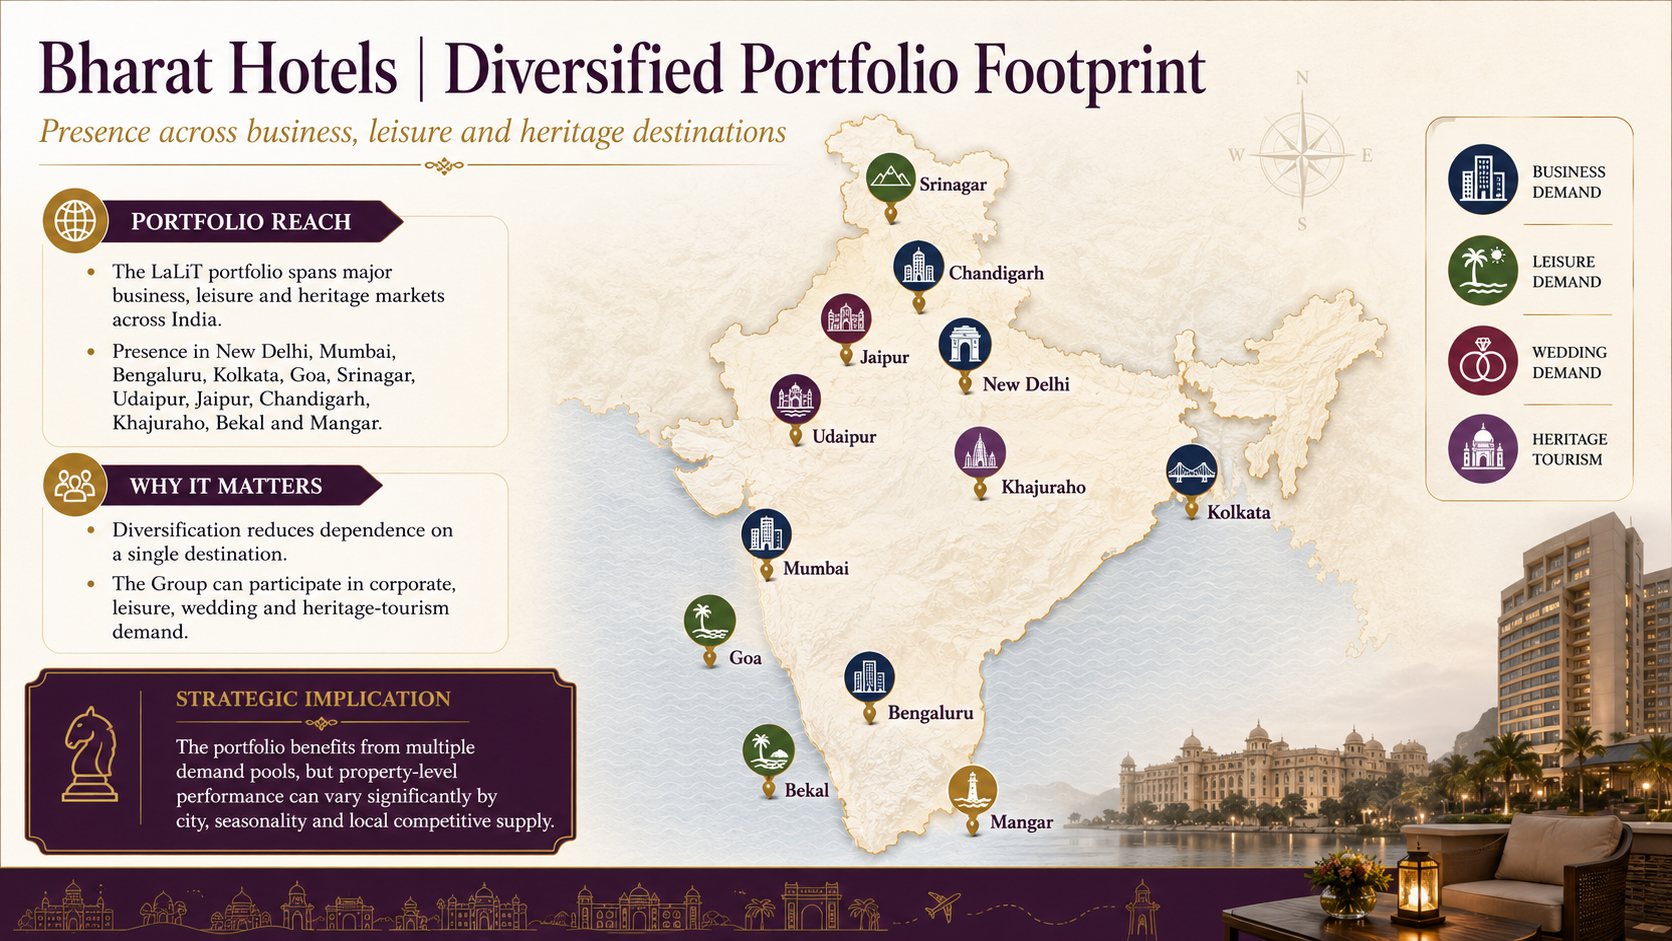
The LaLiT portfolio spans major business, leisure and heritage markets including New Delhi, Mumbai, Bengaluru, Kolkata, Goa, Srinagar, Udaipur, Jaipur, Chandigarh, Khajuraho, Bekal and Mangar.
This diversification reduces dependence on a single destination and allows the Group to participate in corporate, leisure, wedding and heritage-tourism demand.
Strategic implication: the portfolio benefits from multiple demand pools, but property-level performance can vary significantly by city, seasonality and local competitive supply.
Customer Relationship and Revenue Depth
The Company's revenue mix extends beyond rooms into F&B, liquor and wine, banquets, membership programmes, commercial rentals and management fees.
Corporate accounts, weddings, events and repeat guests can therefore increase revenue per occupied room and improve customer lifetime value.
Strategic implication: deeper ancillary monetization reduces dependence on room occupancy alone and supports higher EBITDA margins.
Government Policy Support
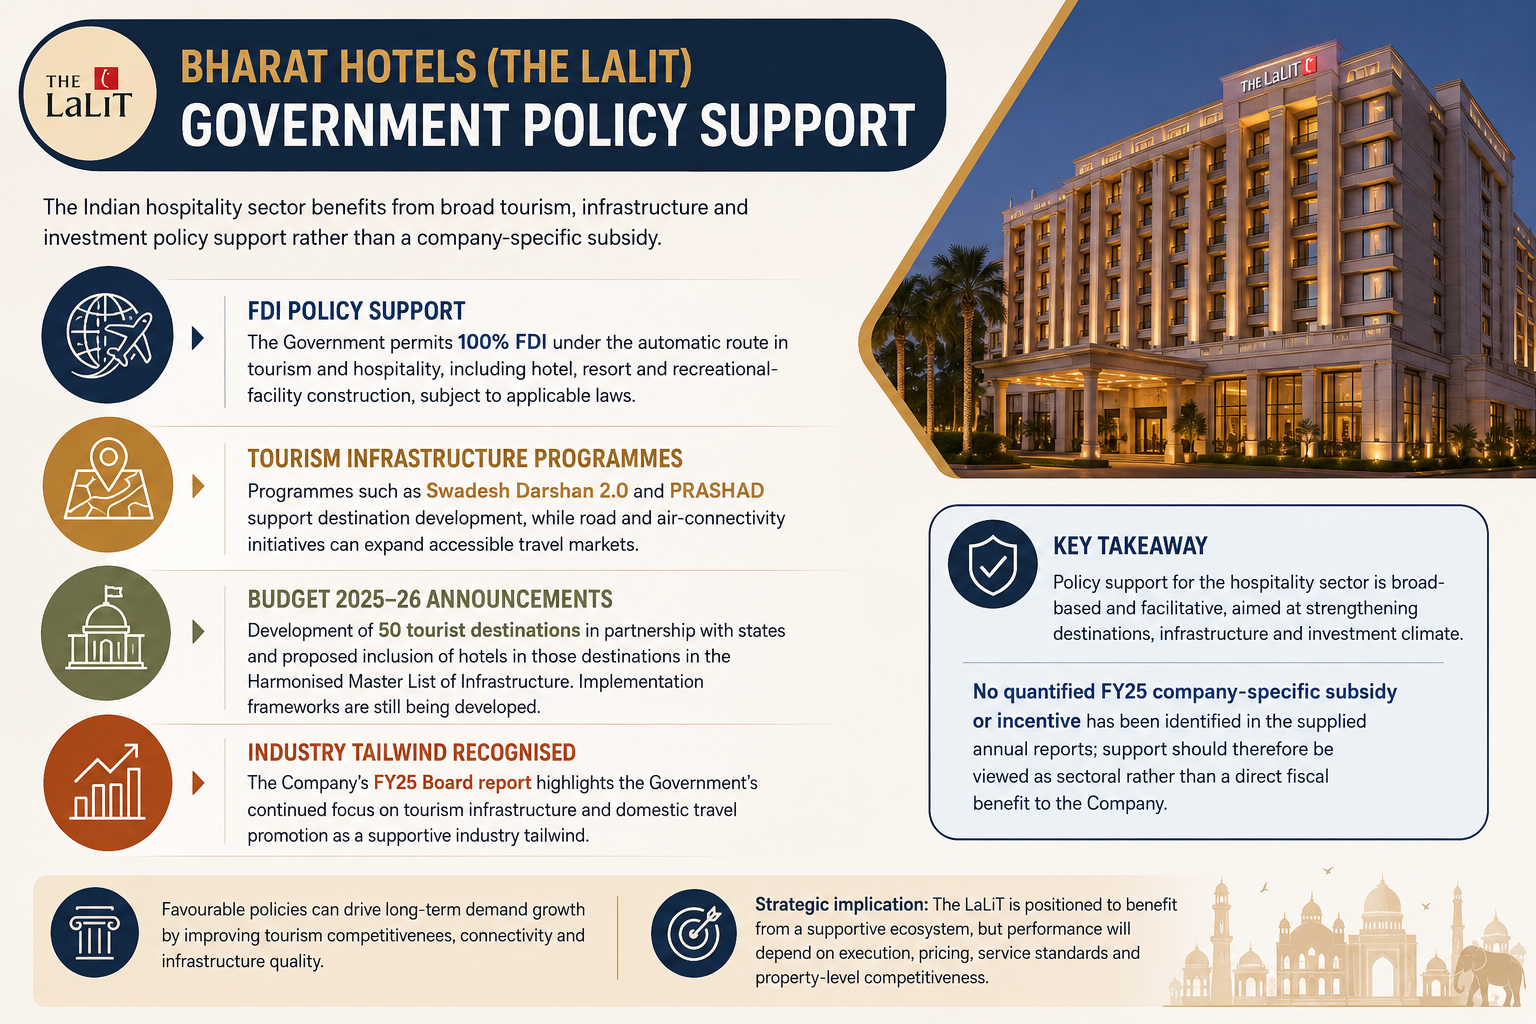
The Indian hospitality sector benefits primarily from broad tourism, infrastructure and investment policy support rather than a company-specific subsidy. The Government permits 100% FDI under the automatic route in tourism and hospitality, including hotel, resort and recreational-facility construction, subject to applicable laws.
Tourism infrastructure programmes such as Swadesh Darshan 2.0 and PRASHAD support destination development, while road and air-connectivity initiatives can expand accessible travel markets. The Union Budget 2025-26 also announced development of 50 tourist destinations in partnership with states and proposed inclusion of hotels in those destinations in the Harmonised Master List of Infrastructure, with implementation frameworks still being developed.
Bharat Hotels' FY25 Board report itself highlights the Government's continued focus on tourism infrastructure and domestic travel promotion as a supportive industry tailwind. No quantified FY25 company-specific subsidy or incentive has been identified in the supplied annual reports; policy support should therefore be viewed as sectoral rather than a direct fiscal benefit to the Company.
Fundraise/Future Plans
Shareholding
Pre-issue shareholding
Promoter Holding 0.0%
Category
Pre-Issue%
Promoters
0.0%
Total Promoter Holding
0.0%
Additional Shareholders
0.0%
Total Additional Holding
0.0%
Total Shareholding
0.0%
- Overview
- Business
- Financial Highlights
- Industry Overview
- Fundraise/Future Plans
- Documentation
Get the Preqt App and keep in touch around the clock!
 Monitor your investments in real-time.
- Receive tailored deal suggestions.
- Get real-time updates and alerts.
