


Bonfiglioli Transmissions
Driving Motion ForwardMotion Through Engineering
IPO Summary (PreQT)
Bonfiglioli Transmissions Limited designs and manufactures power-transmission components including industrial gearboxes, geared motors, off-highway drives and yaw/pitch drives for wind turbines. It operates Indian manufacturing facilities at Thirumudivakkam, Mannur and Talegaon. Revenue from continuing operations was INR 2,013.5 Cr for calendar 2025, up 8.6% from INR 1,854.2 Cr in 2024. RHP-defined EBITDA excluding other income reached INR 370.8 Cr (18.4% margin); continuing-operations PAT increased to INR 237.9 Cr.
The IPO is an offer for sale of up to 43,239,042 existing shares at an upper band of INR 586.0 per share, implying approximately INR 2,533.8 Cr gross issue size. Bonfiglioli S.p.A. is the sole selling shareholder; no capital enters the issuer. Key risk areas are raw-material and customer concentration, dependency on parent-controlled intellectual property and procurement, royalties, cyclical OEM orders and a lengthening cash conversion cycle.
IPO Review Rating
Below Avg
MainboardDriving Automation and Mobility Through Advanced Power Transmission Solutions
Bonfiglioli Transmissions receives a SUBSCRIBE recommendation. The company combines strong profitability, improving margins, a net-cash balance sheet, high return ratios and market-leading positions across several industrial transmission categories. Its FY25 P/E of 46.3x at the cap price is also below the RHP peer average despite superior RoNW.
The key concerns are the 100.0% OFS structure, significant related-party dependence on the Bonfiglioli Group, customer concentration and an expensive 10.7x P/B multiple. These factors prevent the IPO from receiving the highest rating despite otherwise strong business fundamentals.
PARAMETER
WEIGHT
SCORE
KEY FACTORS
Financial Performance
40.0%
4.0/5
Bonfiglioli demonstrates strong financial quality, supported by consistent revenue growth, expanding EBITDA and PAT margins, high return ratios and a net-cash balance sheet. The primary weakness is softer operating cash-flow conversion and moderate customer concentration
Show more
Detailed Analysis
Revenue increased from INR 1,687.3 Cr in 2023 to INR 2,013.5 Cr in 2025, a two-year CAGR of approximately 9.2%. H1 2026 revenue was already INR 1,131.9 Cr
EBITDA expanded from INR 243.9 Cr to INR 370.8 Cr, while margin improved consistently from 14.5% to 18.4% and further to 19.8% in H1 2026
PAT increased from INR 146.7 Cr to INR 237.9 Cr with margin improving from 8.6% to 11.8%; H1 2026 margin reached 13.0%
Company is effectively net-cash positive, with FY2025 net cash of INR 160.4 Cr and no conventional borrowings
ROE improved from 19.2% in 2023 to 25.7% in 2025, which is strong
OCF remained positive at INR 187.7 Cr in 2025, though cash conversion has weakened relative to rising PAT
Largest customer represented 11.4% of FY2025 customer revenue; top 10 represented 36.6%, creating some concentration risk
Industry
15.0%
3.0/5
The company operates in attractive industrial transmission markets supported by automation, infrastructure, renewable energy and manufacturing capex. Its leadership across gear motors, off-highway drives and wind drives provides a strong competitive position within steadily growing addressable markets
Show more
Detailed Analysis
Core addressable Indian markets are expected to grow at approximately 7.5%–10.0% CAGR through FY2031
Established mechanical-transmission industry, but benefiting from automation, electrification, infrastructure, wind and manufacturing-capex growth
Lower regulatory intensity than healthcare/pharma; risks primarily relate to industrial standards, safety, imports and environmental requirements
Management
15.0%
0.0/5
Bonfiglioli benefits from an experienced promoter group and long-tenured management team, with no promoter pledge and limited litigation concerns. However, substantial related-party transactions with the global parent and relatively moderate board independence warrant governance-related deductions
Show more
Detailed Analysis
Deep operating history: 25-year India presence, CFO associated for 24 years, senior sales leadership for 20+ years and significant global-parent expertise
3 Independent Directors out of 8 Directors = 37.5% independence
No promoter shares are pledged. Promoter litigation is limited mainly to tax proceedings of approximately INR 3.6 Cr
Material dependence on the Bonfiglioli Group: related-party expenses represented 24.8% of FY2025 total expenses and 32.7% in H1 2026
Valuation
20.0%
3.0/5
At the upper price band, Bonfiglioli trades below the RHP peer-average P/E despite stronger RoNW, providing reasonable relative valuation comfort. However, elevated P/B and EV/EBITDA multiples, together with the complete OFS structure, limit upside comfort
Show more
Detailed Analysis
P/E is 46.3x versus peer average 51.6x, approximately 10.3% discount
EV/EBITDA 29.3x at cap price, modestly below current peer average
P/B 10.7x latest NAV is expensive in absolute terms
FY2025 RoNW of 24.0% is materially stronger than selected peers
Merchant Banker Track Record
10.0%
5.0/5
The IPO is managed by four established Mainboard BRLMs with strong institutional execution capabilities. Historical 30-day listing performance is broadly favourable, particularly for Axis Capital and Jefferies, although comparable historical subscription data remains unavailable for complete scoring
Show more
Detailed Analysis
Across the four BRLMs, disclosed 30-day post-listing performance ranges from 57.1% to 81.8% of issues trading above their respective offer prices. The overall track record is favourable, though performance varies meaningfully between individual bankers
Comparable historical subscription data for IPOs handled by each BRLM is not sufficiently available from the current source to calculate this parameter consistently
Most BRLMs demonstrate a reasonable-to-strong proportion of successful post-listing outcomes, particularly Axis Capital and Jefferies. The collective record provides comfort regarding issue pricing and execution, although not every historical transaction has produced positive aftermarket performance
TOTAL
100%
3.1/5
Weighted Composite Score
Issue Price
₹558.0 to ₹586.0
As of 14 Oct 2026
GMP
₹180.0
As of 14 Oct 2026
Estimated Gain / Loss
+30.7%
Lot Size
25.0 Shares
Grey Market Premium (GMPs) are shared for knowledge purpose only. PrEqt doesn’t promote or execute the trades.
| Issue Size (in Cr) | |
|---|---|
| Overall | ₹2,534.0 Cr |
| Fresh Issue | ₹0.0 Cr |
| Offer for Sale | ₹2,534.0 Cr |
Minimum Investment
₹14,650.0 / 625 shares

Merchant Banker
Axis Capital Ltd., Jefferies Ltd
Axis Capital Ltd.
Jefferies Ltd
IPO Document
No Document
Offer Start Date
Offer End Date
Valuation
Revenue (FY'26)
PAT (FY'26)
Issue Size (in Cr)
Face Value
₹ 10.0Offer Price
₹ 586.0Lot Size
25.0 sharesSale Type
OFS onlyPAT (FY'26)
₹ 237.9 CrPAT Margin (FY'26)
11.8 %P/E Multiple
46.3xEBITDA (FY'26)
₹ 370.8 CrCAGR Growth 2Y
9.2 %ROE (FY'26)
25.7 %ROCE (FY'26)
34.1 %Price to Book Value
10.7xDebt/Equity
0.0xCompany Website
www.bonfiglioli.in/enExplore new deals
Overview
Fund Allocation
Total: ₹0 CrSource:Company DRHP
Timeline
IPO Open Date
To Be Announced
IPO Close Date
To Be Announced
Tentative Allotment
To Be Announced
Initiation of Refunds
To Be Announced
Credit of Shares to Demat
To Be Announced
Tentative Listing Date
To Be Announced
Business
Products
Business Model
Geographical Presence
Sales Channel
Key Risk Factors
Financial Highlights
Income Statement
Revenue growth with EBITDA and PAT margins
| Financial Metric | FY 2023 | FY 2024 | FY 2025 |
|---|---|---|---|
| Revenue (₹ Cr) | 1,687.3 | 1,854.2 | 2,013.5 |
| Growth (%) | - | 9.9% | 8.6% |
| EBITDA (₹ Cr) | 258.4 | 302.0 | 380.8 |
| EBITDA Margin (%) | 14.5% | 15.9% | 18.4% |
| PAT (₹ Cr) | 148.5 | 195.2 | 237.9 |
| PAT Margin (%) | 8.6% | 10.3% | 11.8% |
OBSERVATIONS & INSIGHTS
Sales grew 9.9% in 2024, led by 19.7% growth in the wind vertical and increased US customer demand. In 2025, revenue grew 8.6%, with off-highway mobility +16.4% (higher construction/agri OEM volumes), Industry & Automation +7.8% and Wind +5.9%/
Operating EBITDA rose from INR 243.9 Cr to INR 295.1 Cr and INR 370.8 Cr. The 2024 improvement benefited from lower material prices; 2025 gains reflected localisation, procurement measures and in-sourcing of processes. Margin moved from 14.5% to 15.9% to 18.4%. 2025 materials cost fell as a share of revenue from 63.6% to 62.1%; subcontracting costs fell 17.3% after work was insourced at Thirumudivakkam
Continuing PAT rose 30.6% in 2024 and 24.2% in 2025. Better operating profit and lower finance costs supported earnings, partly offset in 2025 by higher tax expense.
Balance Sheet
| Financial Metric | FY 2023 | FY 2024 | FY 2025 |
|---|---|---|---|
| Net Worth | ₹ 801.4 Cr | ₹ 861.0 Cr | ₹ 993.0 Cr |
| Total Assets | ₹ 1,414.7 Cr | ₹ 1,299.1 Cr | ₹ 1,439.5 Cr |
| Total Borrowing | ₹ 110.8 Cr | ₹ 0.0 Cr | ₹ 0.0 Cr |
| Reserves & Surplus | ₹ 670.2 Cr | ₹ 735.6 Cr | ₹ 867.7 Cr |
OBSERVATIONS & INSIGHTS
Total equity grew from INR 801.4 Cr in 2023 to INR 993.0 Cr in 2025, predominantly through retained earnings and reserve movements, notwithstanding shareholder distributions
Current borrowings of INR 110.8 Cr at 2023 year-end were repaid during 2024 and were nil at 2024 and 2025 year-ends; the annual capital base is not reliant on outstanding bank loans
Total assets fell from INR 1,414.7 Cr to INR 1,299.1 Cr. Other bank balances dropped from INR 170.0 Cr to almost nil as deposits matured, while debt repayment and cash uses affected the balance sheet. Assets grew INR 140.4 Cr to INR 1,439.5 Cr; receivables rose INR 111.5 Cr to INR 517.7 Cr and other current assets increased, indicating greater working-capital deployment
Cash Flow
| Financial Metric | FY 2023 | FY 2024 | FY 2025 |
|---|---|---|---|
CFO (₹ Cr) Cash generated from core business operations. | +198.2 Cr | +188.4 Cr | +187.7 Cr |
CFI (₹ Cr) Cash used for investments and long-term assets. | -99.9 Cr | +109.4 Cr | -52.4 Cr |
CFF (₹ Cr) Cash flow related to funding and borrowings. | -116.4 Cr | -243.6 Cr | -126.8 Cr |
Working Capital
| Efficiency Metric | FY 2023 | FY 2024 | FY 2025 |
|---|---|---|---|
Debtor Days Average number of days taken to collect customer payments. | - | - | - |
Creditor Days Average time taken to pay suppliers and vendors. | - | - | - |
Inventory Days Average number of days inventory remains unsold. | - | - | - |
CCC (Cash Conversion Cycle) (Debtor Days + Inventory Days - Creditor Days) | - | - | - |
Financial Ratios
Measures the company’s leverage relative to shareholder equity.
OBSERVATIONS & INSIGHTS
Current ratio: Rose from 1.8x to 2.5x; the 2024 recovery followed a reduction in current liabilities, including loan repayment, and 2025 retained high liquidity despite trade receivable growth
Net debt: The company was net-cash on the RHP measure in all three years; December 2025 net cash was INR 160.4 Cr. No year-end bank borrowings were outstanding in 2024 or 2025
ROE: Increased to 25.7%, reflecting PAT expansion of 24.2% in 2025 while average equity grew more slowly. This is the issuer’s average-equity return, distinct from closing-equity RoNW
ROCE: Increased to 34.1%, supported by EBIT growth; use the RHP tangible-net-worth calculation rather than applying a different industrial peer denominator
Interest coverage: Expanded due to rising PBT and decline in finance costs after 2024 debt repayment; lease payments and non-debt financial liabilities should still be reviewed
Industry Overview
Industry Drivers
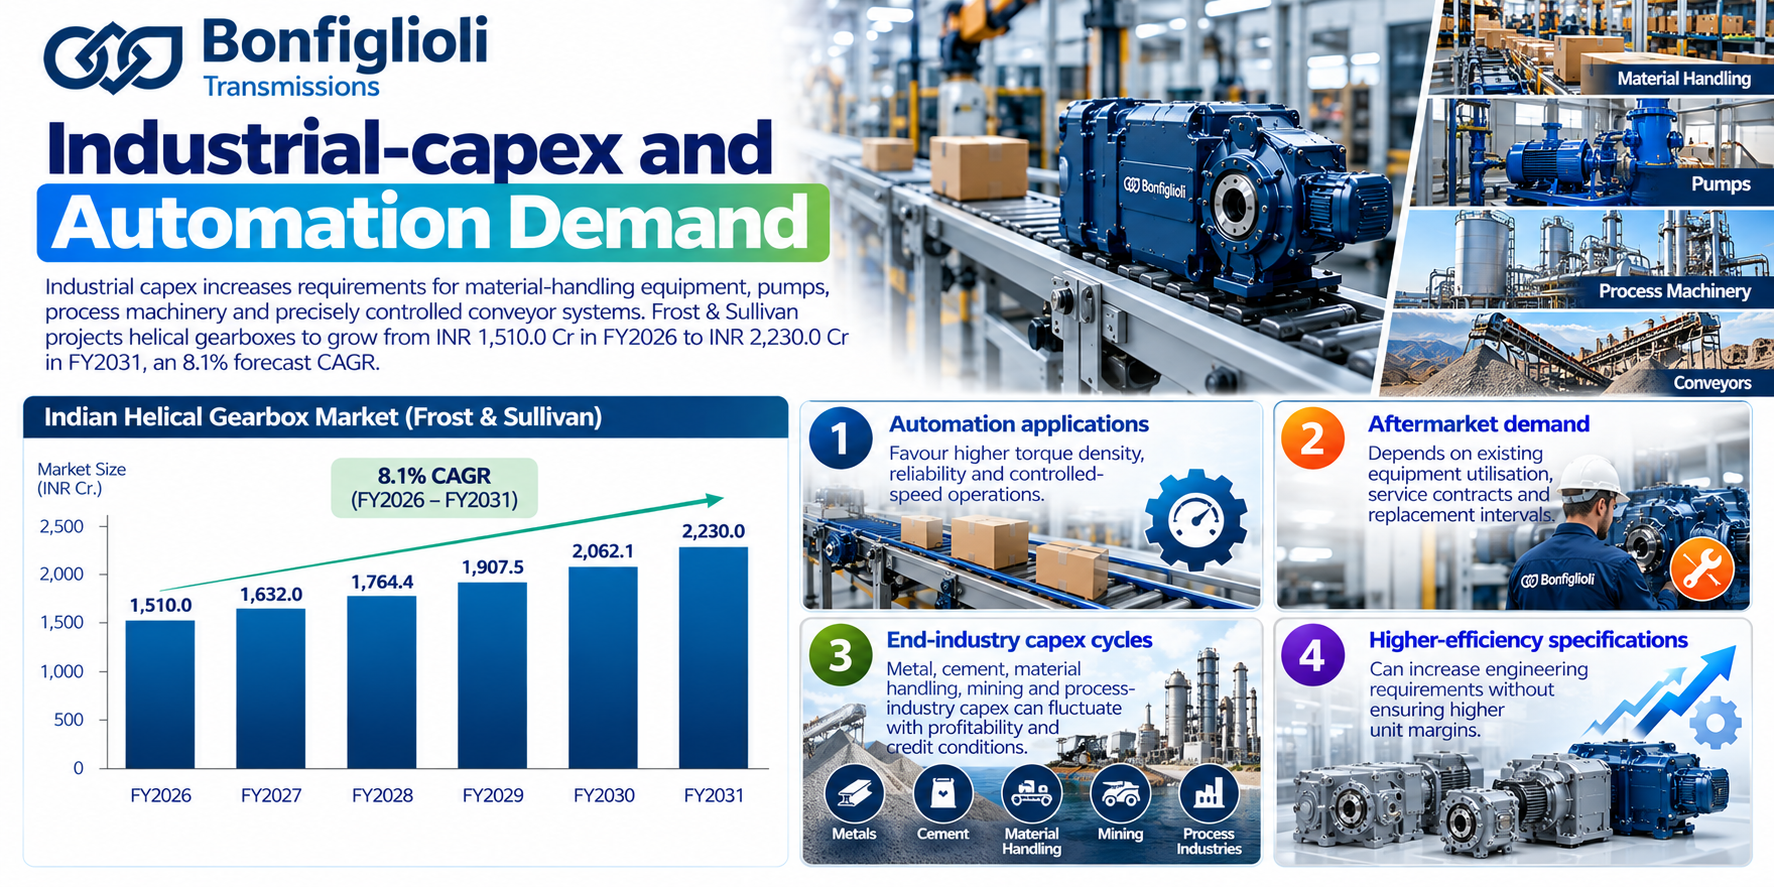
Industrial-capex and automation demand
Industrial capex increases requirements for material-handling equipment, pumps, process machinery and precisely controlled conveyor systems. Frost & Sullivan projects helical gearboxes to grow from INR 1,510.0 Cr in FY2026 to INR 2,230.0 Cr in FY2031, an 8.1% forecast CAGR.
The key drivers are:
Automation applications favour higher torque density, reliability and controlled-speed operations
Aftermarket demand depends on existing equipment utilisation, service contracts and replacement intervals
Metal, cement, material handling, mining and process-industry capex can fluctuate with profitability and credit conditions
Higher-efficiency drive specifications can increase engineering requirements without ensuring higher unit margins
Geared motors and integrated drive systems
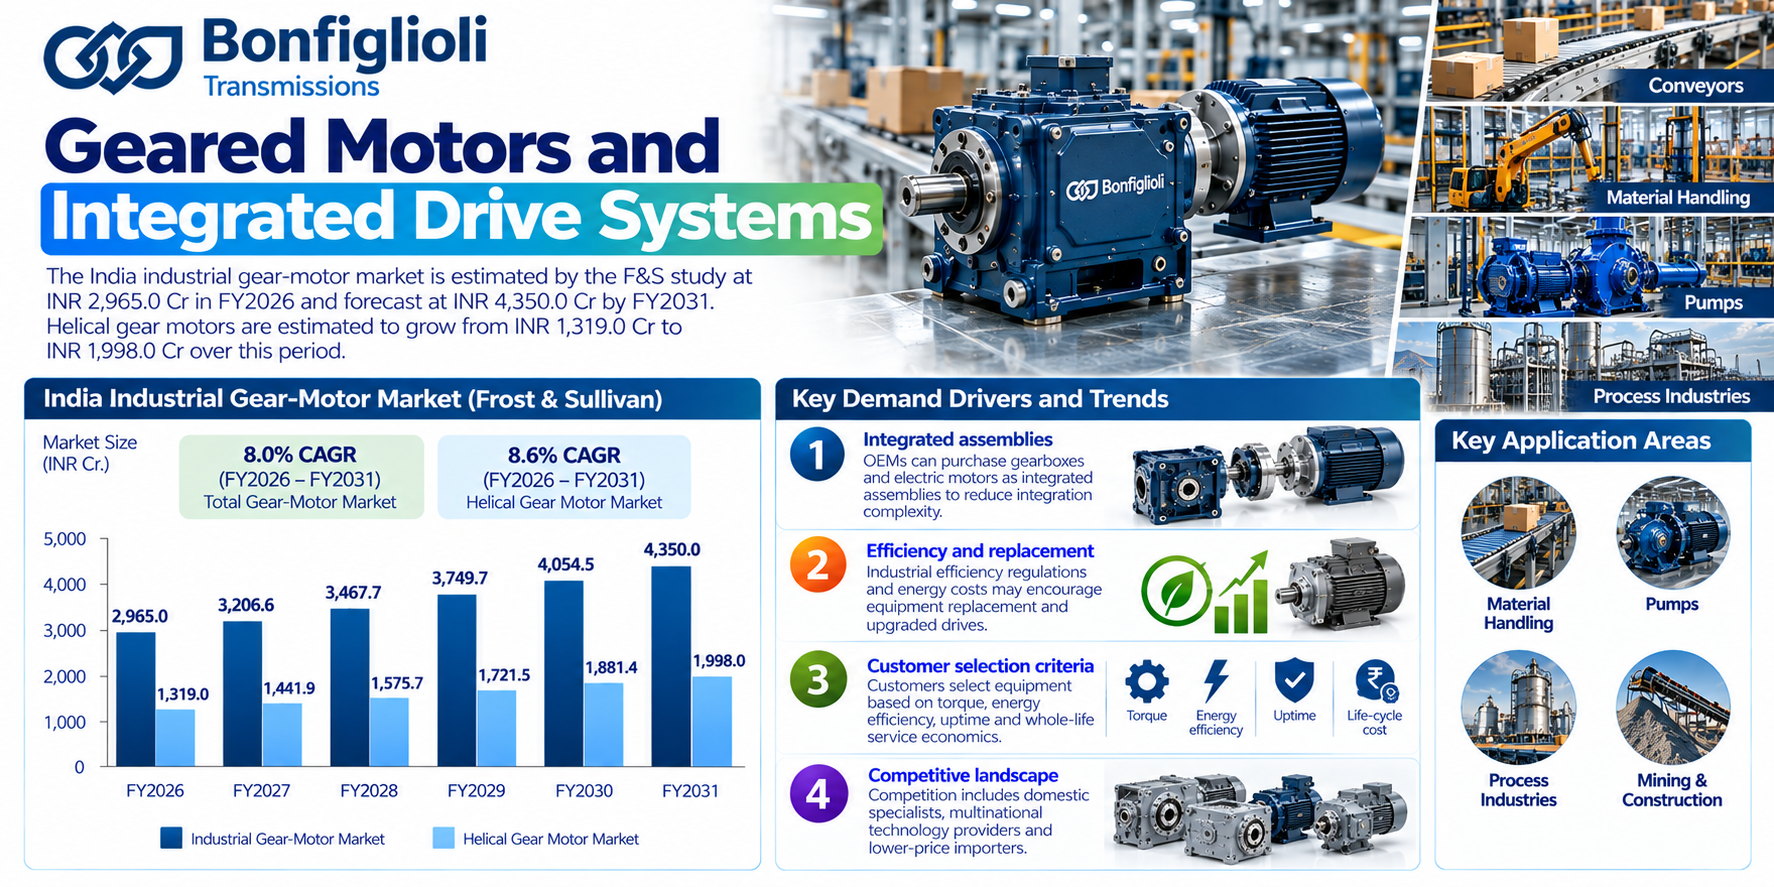
The India industrial gear-motor market is estimated by the F&S study at INR 2,965.0 Cr in FY2026 and forecast at INR 4,350.0 Cr by FY2031. Helical gear motors are estimated to grow from INR 1,319.0 Cr to INR 1,998.0 Cr over this period.
The key drivers are:
OEMs can purchase gearboxes and electric motors as integrated assemblies to reduce integration complexity
Industrial efficiency regulations and energy costs may encourage equipment replacement and upgraded drives
Customers select equipment based on torque, energy efficiency, uptime and whole-life service economics
Competition includes domestic specialists, multinational technology providers and lower-price importers
Off-highway mobility systems
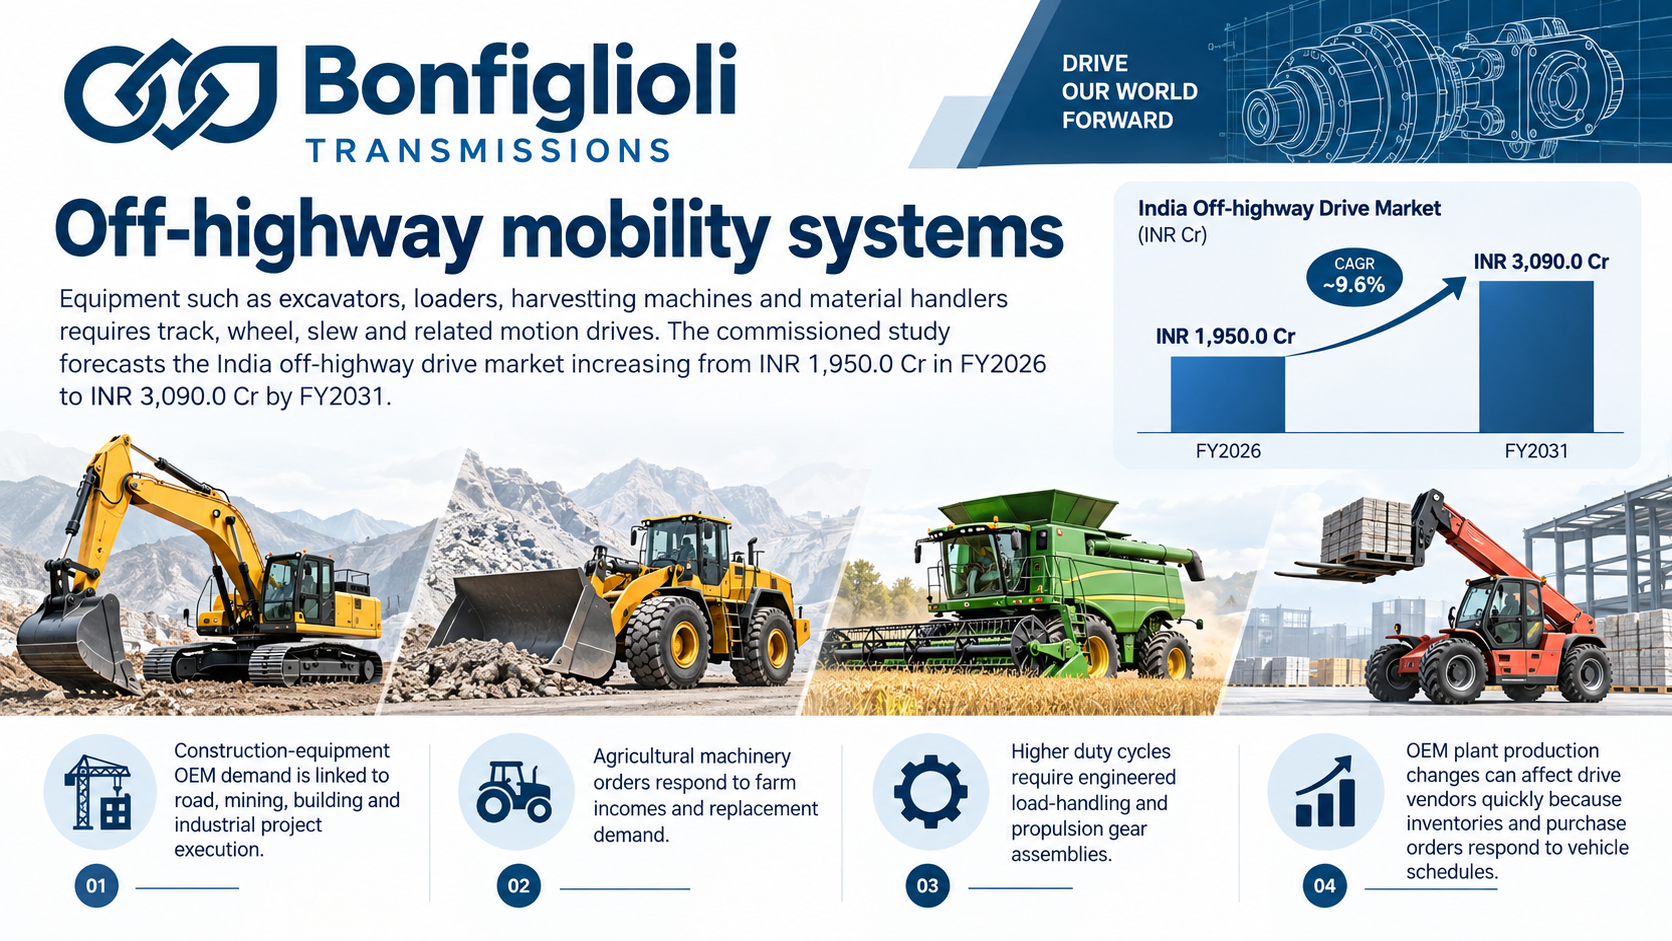
Equipment such as excavators, loaders, harvesting machines and material handlers requires track, wheel, slew and related motion drives. The commissioned study forecasts the India off-highway drive market increasing from INR 1,950.0 Cr in FY2026 to INR 3,090.0 Cr by FY2031.
The key drivers are:
Construction-equipment OEM demand is linked to road, mining, building and industrial project execution
Agricultural machinery orders respond to farm incomes and replacement demand
Higher duty cycles require engineered load-handling and propulsion gear assemblies
OEM plant production changes can affect drive vendors quickly because inventories and purchase orders respond to vehicle schedules
Risks in the Industry
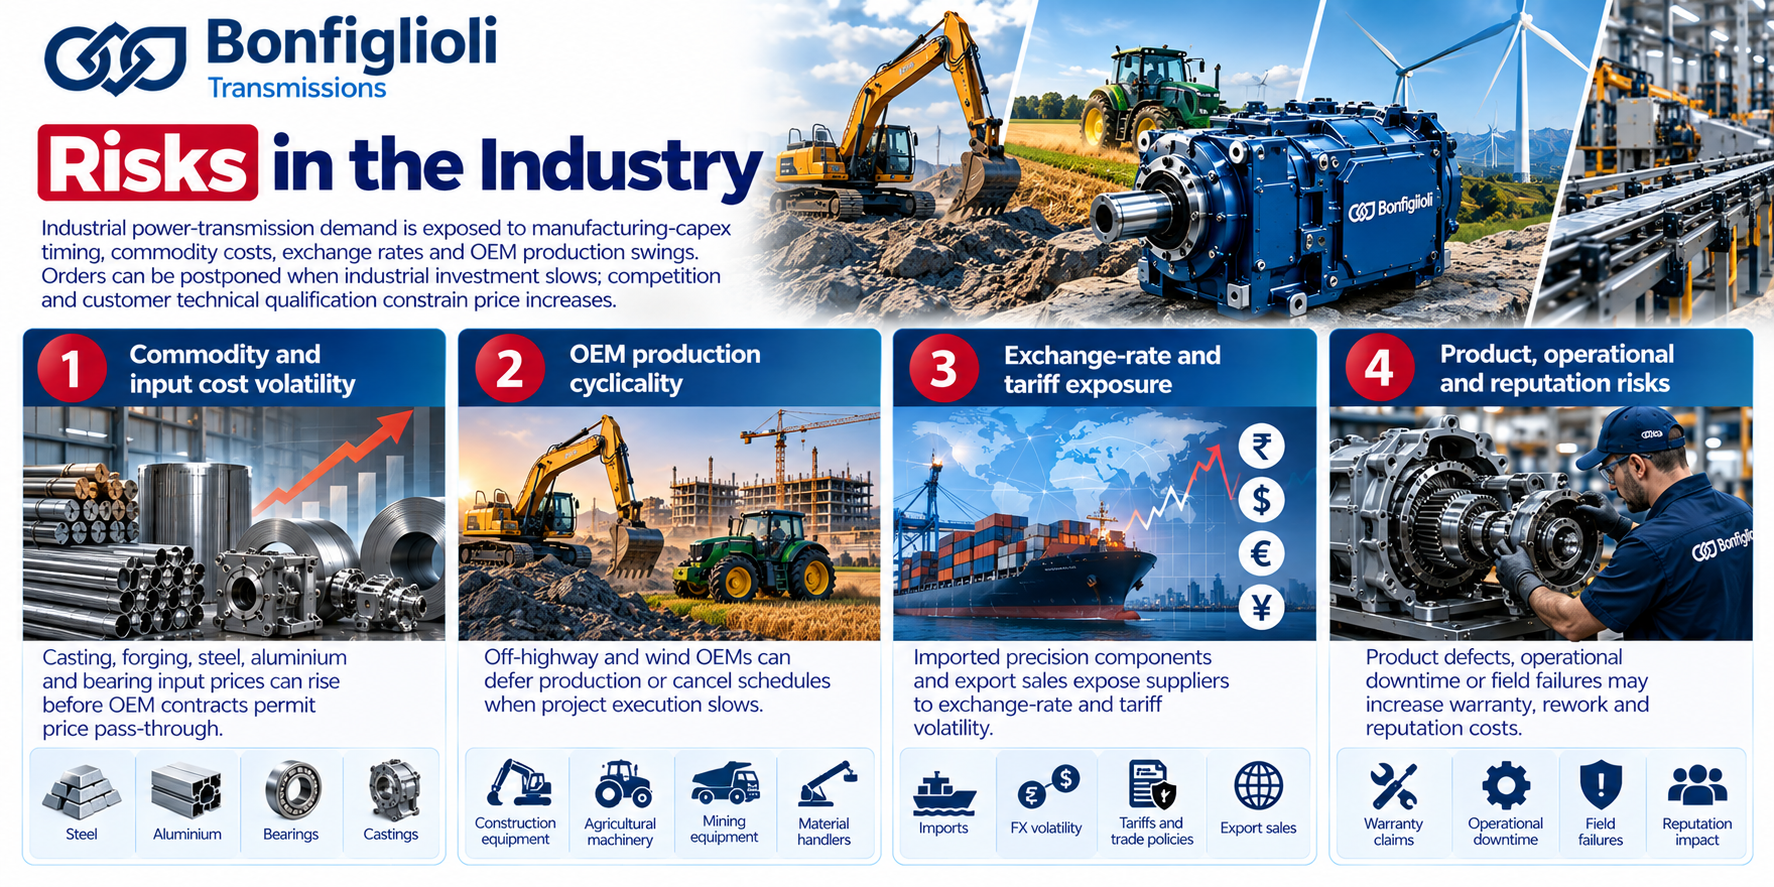
Industrial power-transmission demand is exposed to manufacturing-capex timing, commodity costs, exchange rates and OEM production swings. Orders can be postponed when industrial investment slows; competition and customer technical qualification constrain price increases.
The key risks are:
Casting, forging, steel, aluminium and bearing input prices can rise before OEM contracts permit price pass-through
Off-highway and wind OEMs can defer production or cancel schedules when project execution slows
Imported precision components and export sales expose suppliers to exchange-rate and tariff volatility
Product defects, operational downtime or field failures may increase warranty, rework and reputation costs
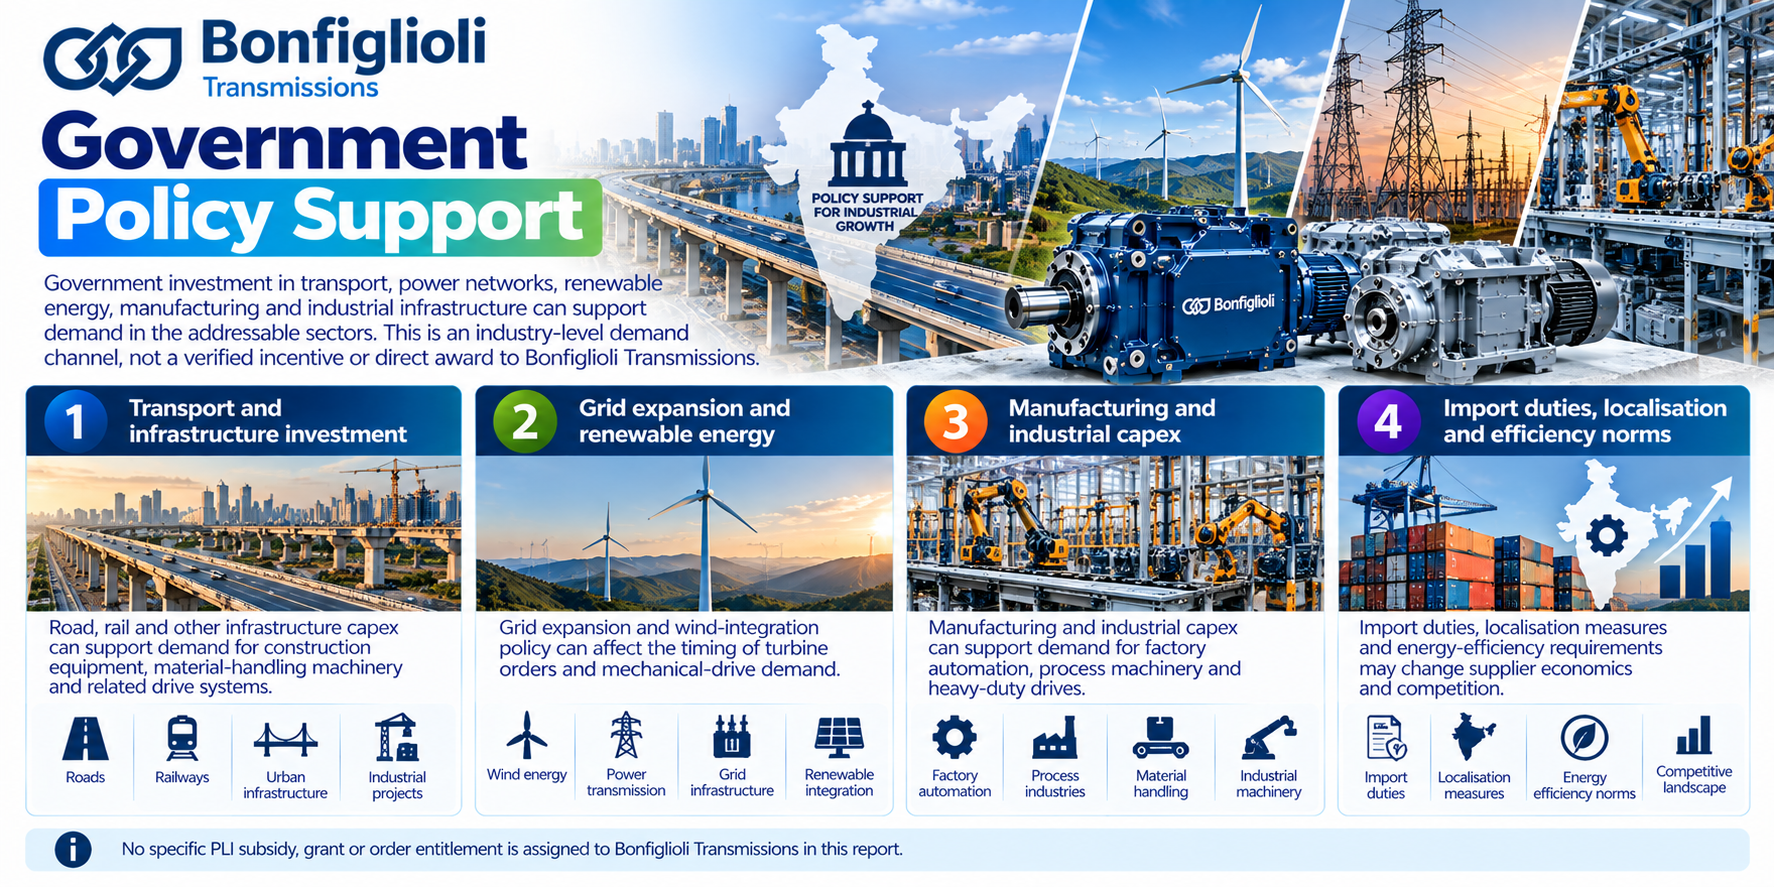
Government Policy Support
Government investment in transport, power networks, renewable energy, manufacturing and industrial infrastructure can support demand in the addressable sectors. This is an industry-level demand channel, not a verified incentive or direct award to Bonfiglioli Transmissions.
The key policies are:
Grid expansion and wind-integration policy can affect the timing of turbine orders and mechanical-drive demand
Manufacturing and infrastructure capex can support demand for factory automation and heavy-duty drives
Import duties, localisation measures and energy-efficiency requirements may change supplier economics and competition
No specific PLI subsidy, grant or order entitlement is assigned to the issuer in this report
Fundraise/Future Plans
Shareholding
Pre-issue shareholding
Promoter Holding 0.0%
Post-Issue Shareholding
Promoter Holding 0.0%
Category
Pre-Issue%Post-Issue%
Promoters
Bonfiglioli S.p.A.
100.0%77.0%
Total Promoter Holding
100.0%77.0%
Additional Shareholders
Other Shareholders
0.0%23.0%
Total Additional Holding
0.0%23.0%
Total Shareholding
100.0%100.0%
- Overview
- Business
- Financial Highlights
- Industry Overview
- Fundraise/Future Plans
- Documentation
Get the Preqt App and keep in touch around the clock!
 Monitor your investments in real-time.
- Receive tailored deal suggestions.
- Get real-time updates and alerts.
