


Calcutta Stock Exchange
Connecting Capital and OpportunityMarkets Built on Trust
IPO Review and Rating
Speculative
Based on comprehensive analysisOverall Recommendation
CSE offers a debt-free balance sheet, strong formal board independence, possible INR 253.0 crore land monetisation and optionality from the proposed revival. However, the company currently lacks an operating trading platform, reported a substantial loss, generates most income from investments, carries extensive historical litigation and has moved from voluntary exit back toward an uncertain revival proposal. At approximately INR 2,000, the investment case depends primarily on regulatory decisions and asset monetisation rather than sustainable operating earnings
PARAMETER
WEIGHT
SCORE
KEY FACTORS
Financial Performance
25.0%
2.3/5
Debt-free liquidity and VRS savings provide support, but inactive trading, investment-led income, negative ROE and weak underlying cash generation constrain quality
Show more
Detailed Analysis
FY22-FY25 operating revenue recorded a 25.9% CAGR, but FY25 revenue declined 10.8% and no income was generated from CSE trading activity
Other income contributed INR 15.4 crore, or 57.4% of total income, and consisted predominantly of interest earned on investments and deposits
The INR 21.8 crore reported loss included INR 21.0 crore of one-time VRS provision
The Group had no borrowings and held substantial cash and investments, although meaningful amounts are earmarked or matched against settlement-related obligations
Reported consolidated ROE deteriorated to negative 21.9% following the FY25 loss and reduction in book equity
Industry
25.0%
2.4/5
Indian capital markets remain attractive, but dominant national exchanges, regulatory uncertainty and expensive technology requirements severely constrain CSE’s prospects
Show more
Detailed Analysis
Financialisation of savings, increasing retail participation and growing exchange volumes provide strong structural sector growth
Exchange infrastructure is an established industry, although rising participation and new products continue to support incremental growth
NSE and BSE possess overwhelming liquidity and technology network effects, while CSE has recorded no trading on its platform since April 2013
Recognition, clearing arrangements, net-worth requirements, exit and any proposed revival remain dependent on SEBI and other regulatory approvals
Revival would require a new technology backbone, trading infrastructure, disaster-recovery capability and an acceptable clearing arrangement
Management
25.0%
3.2/5
Strong formal board independence and limited RPT concerns are offset by prolonged regulatory disputes, litigation and inconsistent strategic direction
Show more
Detailed Analysis
CSE has more than a century of institutional history, but management has not restored trading and has recently reversed its exit strategy
Three of four FY25 directors were SEBI-approved Public Interest Directors, giving the Board strong 75.0% independent representation
Trading remains suspended and the Exchange carries numerous historical tax, member, property, employment and settlement-related proceedings
Transactions were mainly with wholly owned subsidiaries and mandated investor funds, with no material conflict-of-interest RPT identified
Valuation Metrics
25.0%
2.3/5
Asset optionality appears attractive, but restricted reserves, negative earnings, litigation, strategic uncertainty and illiquid price discovery substantially weaken the discount.
Show more
Detailed Analysis
CSE reported a INR 21.8 crore consolidated loss, no dividend and negligible normalised profitability, making P/E valuation unusable
Reported P/B is 0.7x, but excluding INR 72.7 crore of SGF and investor-service funds increases adjusted P/B to approximately 1.14x
A bidder offered approximately INR 253.0 crore for the three-acre EM Bypass leasehold, but execution requires approvals and resolution of title and strategic issues
TOTAL
100%
2.5/5
Weighted Composite Score
Per Share Price
₹925.0
As of 14 Oct 2026
Lot Size
500.0 Shares
Minimum Investment
₹4,62,500.0 / 500 shares
Market Cap. (₹ Cr)
Revenue FY’25
PAT FY’25
P/E Multiple
Face Value
₹ 1.0Lot Size
500.0 sharesPAT FY’25
₹ -21.8 CrP/E Multiple
-7.6xCAGR Growth 3Y
25.9 %ROE (FY’25)
-11.2 %ROCE (FY’25)
-4.8 %Price to Book Value ratio
0.7xDebt/Equity (FY’26)
0.0xMerchant banker appointed
❌ NoCompany Website
www.cse-india.comDisclaimer: Unlisted shares are unregulated & illiquid. This is NOT investment advice. Please do your own due diligence before investing.
Minimum Investment
₹4,62,500.0 / 500 sharesShares Lot 500 X 1
Investment amount
₹4,62,500.0
Overview
Business
Business Model
Geographical Presence
Sales Channel
Financial Highlights
Income Statement
Revenue growth with EBITDA and PAT margins
| Financial Metric | FY 2023 | FY 2024 | FY 2025 |
|---|---|---|---|
| Revenue (₹ Cr) | 5.7 | 12.8 | 11.4 |
| Growth (%) | 0.0% | 126.2% | -10.8% |
| EBITDA (₹ Cr) | 4.7 | 9.2 | -13.7 |
| EBITDA Margin (%) | 25.2% | 33.9% | -51.3% |
| PAT (₹ Cr) | 0.4 | 0.8 | -21.8 |
| PAT Margin (%) | 2.1% | 3.1% | -81.2% |
OBSERVATIONS & INSIGHTS
Revenue more than doubled in FY24 and then declined 10.8% in FY25 as listing fees and penal-charge recoveries weakened, partly offset by higher processing income
Other income increased to ₹15.4 Cr and represented 57.4% of total income in FY25, highlighting dependence on interest, bonds, dividends and permitted investment deployment.
FY25 included a ₹21.0 Cr VRS provision. Excluding that one-time provision, profit before tax and regulatory-fund contributions would have been approximately ₹7.0 Cr instead of a loss of ₹13.9 Cr
After tax, CSE charged ₹4.8 Cr of net contributions to the Settlement Guarantee Fund and Investors' Service Fund, taking audited PAT to (₹21.8 Cr)
Balance Sheet
| Financial Metric | FY 2023 | FY 2024 | FY 2025 |
|---|---|---|---|
| EQUITY & LIABILITIES | ₹ 391.8 Cr | ₹ 402.8 Cr | ₹ 405.4 Cr |
| Net Worth | ₹ 197.2 Cr | ₹ 202.5 Cr | ₹ 185.6 Cr |
| Share Capital | ₹ 0.1 Cr | ₹ 0.1 Cr | ₹ 0.1 Cr |
| Reserves & Surplus | ₹ 197.1 Cr | ₹ 202.4 Cr | ₹ 185.5 Cr |
| Total Liabilities | ₹ 194.6 Cr | ₹ 200.3 Cr | ₹ 219.8 Cr |
| Current Liabilities | ₹ 100.3 Cr | ₹ 106.0 Cr | ₹ 125.6 Cr |
| Borrowings | ₹ 0.0 Cr | ₹ 0.0 Cr | ₹ 0.0 Cr |
| Trade Payables | ₹ 1.0 Cr | ₹ 1.4 Cr | ₹ 0.8 Cr |
| Other Current Liabilities | ₹ 99.3 Cr | ₹ 104.6 Cr | ₹ 124.8 Cr |
| Non-Current Liabilities | ₹ 94.3 Cr | ₹ 94.3 Cr | ₹ 94.2 Cr |
| Borrowings | ₹ 0.0 Cr | ₹ 0.0 Cr | ₹ 0.0 Cr |
| Other Non-Current Liabilities | ₹ 94.3 Cr | ₹ 94.3 Cr | ₹ 94.2 Cr |
| ASSETS | ₹ 391.9 Cr | ₹ 402.8 Cr | ₹ 405.4 Cr |
| Current Assets | ₹ 103.4 Cr | ₹ 153.2 Cr | ₹ 161.0 Cr |
| Trade Receivables | ₹ 1.7 Cr | ₹ 1.1 Cr | ₹ 1.2 Cr |
| Inventory | ₹ 0.0 Cr | ₹ 0.0 Cr | ₹ 0.0 Cr |
| Cash & Cash Equivalents | ₹ 47.1 Cr | ₹ 75.8 Cr | ₹ 69.9 Cr |
| Other Current Assets | ₹ 54.6 Cr | ₹ 76.3 Cr | ₹ 89.9 Cr |
| Non-Current Assets | ₹ 288.5 Cr | ₹ 249.6 Cr | ₹ 244.4 Cr |
| Fixed Assets | ₹ 28.1 Cr | ₹ 27.9 Cr | ₹ 28.1 Cr |
| Other Non-Current Assets | ₹ 260.4 Cr | ₹ 221.7 Cr | ₹ 216.3 Cr |
OBSERVATIONS & INSIGHTS
Equity fell from ₹202.4 Cr in FY24 to ₹185.5 Cr in FY25 as the audited loss reduced reserves, while share capital remained unchanged at approximately ₹0.1 Cr
Current liabilities rose 19.6% to ₹125.6 Cr, mainly because the VRS provision was recognised within short-term provisions
The Group reported no current or non-current borrowings in any of the three years; long-term liabilities primarily relate to deposits and exchange-related obligations
Current assets increased from ₹103.5 Cr to ₹160.9 Cr between FY23 and FY25, while non-current assets declined from ₹288.5 Cr to ₹244.4 Cr as deposits, advances and investments shifted or matured
Cash Flow
| Financial Metric | FY 2023 | FY 2024 | FY 2025 |
|---|---|---|---|
CFO (₹ Cr) Cash generated from core business operations. | +64.0 Cr | +104.2 Cr | +53.3 Cr |
CFI (₹ Cr) Cash used for investments and long-term assets. | -66.3 Cr | -108.4 Cr | -48.6 Cr |
CFF (₹ Cr) Cash flow related to funding and borrowings. | -0.1 Cr | -0.1 Cr | -0.1 Cr |
Financial Ratios
Measures the company’s leverage relative to shareholder equity.
OBSERVATIONS & INSIGHTS
FY25 ROE fell to (11.2%) and ROA to (5.4%) because the VRS-driven loss was absorbed against a broadly stable equity and asset base
Debt-to-equity remained 0.0x throughout FY23-FY25, and interest coverage is not applicable because the statements report no finance cost
The current ratio improved from 1.0x in FY23 to 1.5x in FY24 before moderating to 1.3x in FY25; restricted and fund linked balances reduce the quality of this headline measure
ROCE increased to 3.0% in FY24 but reversed to (4.8%) in FY25, well below the selected active-exchange peers
Industry Overview
Industry Drivers
Growth in Capital-market Participation
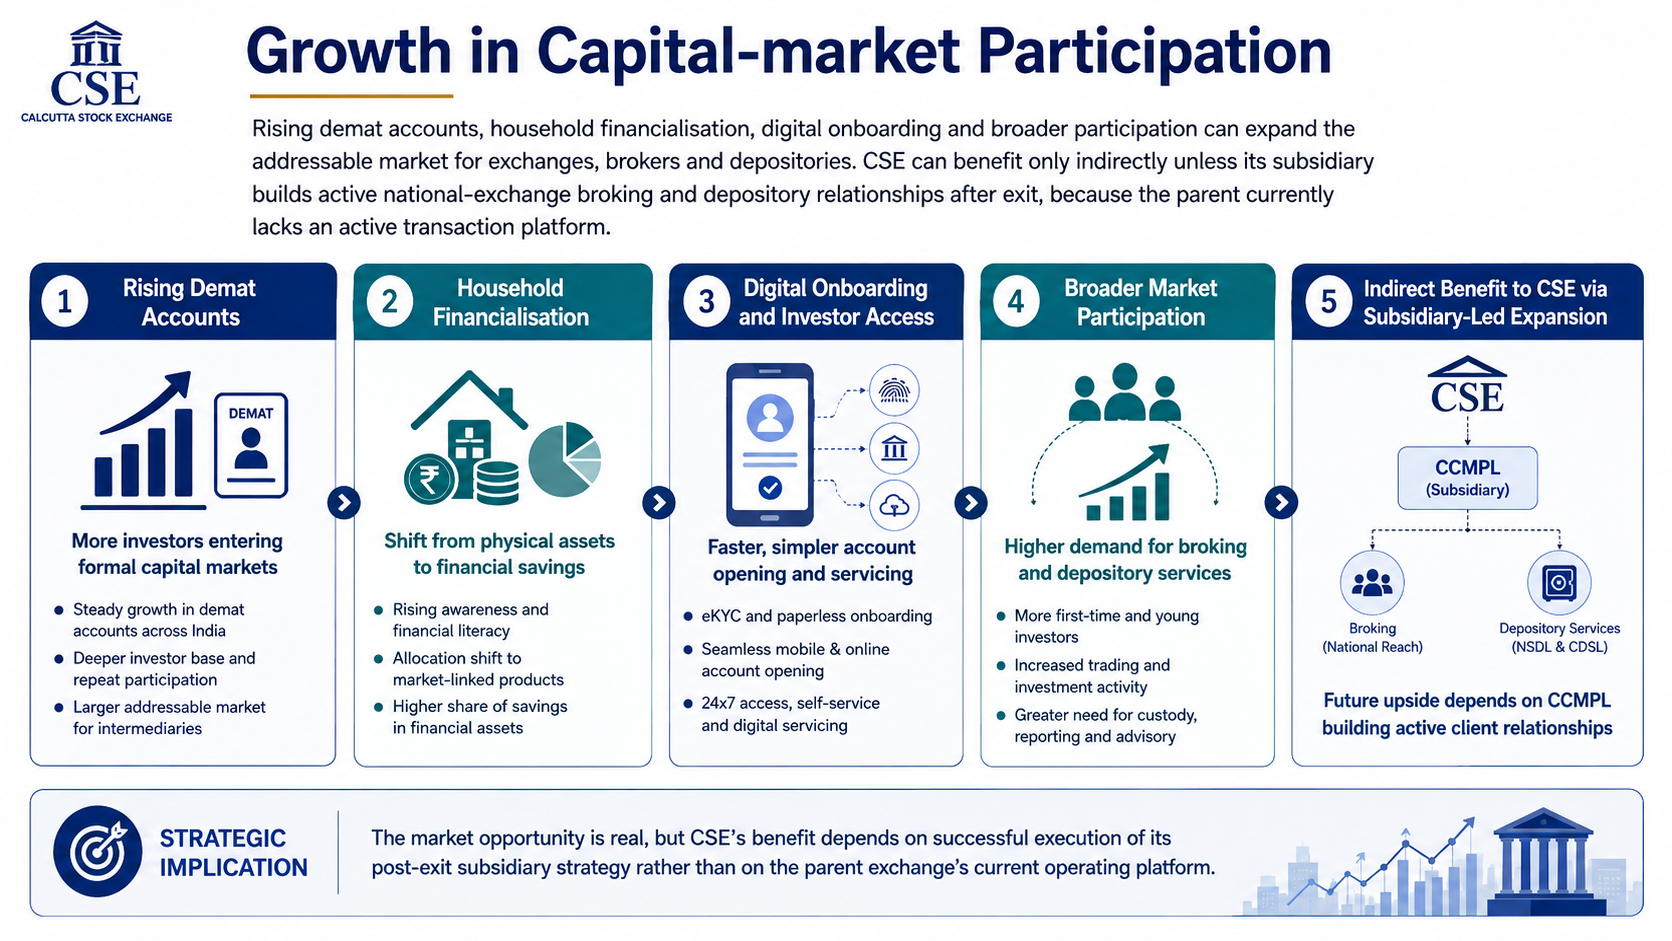
Rising demat accounts, household financialisation, digital onboarding and broader participation can expand the addressable market for exchanges, brokers and depositories
CSE can benefit only indirectly unless its subsidiary builds active national-exchange broking and depository relationships after exit, because the parent currently lacks an active transaction platform
Liquidity Concentration and Network Effects
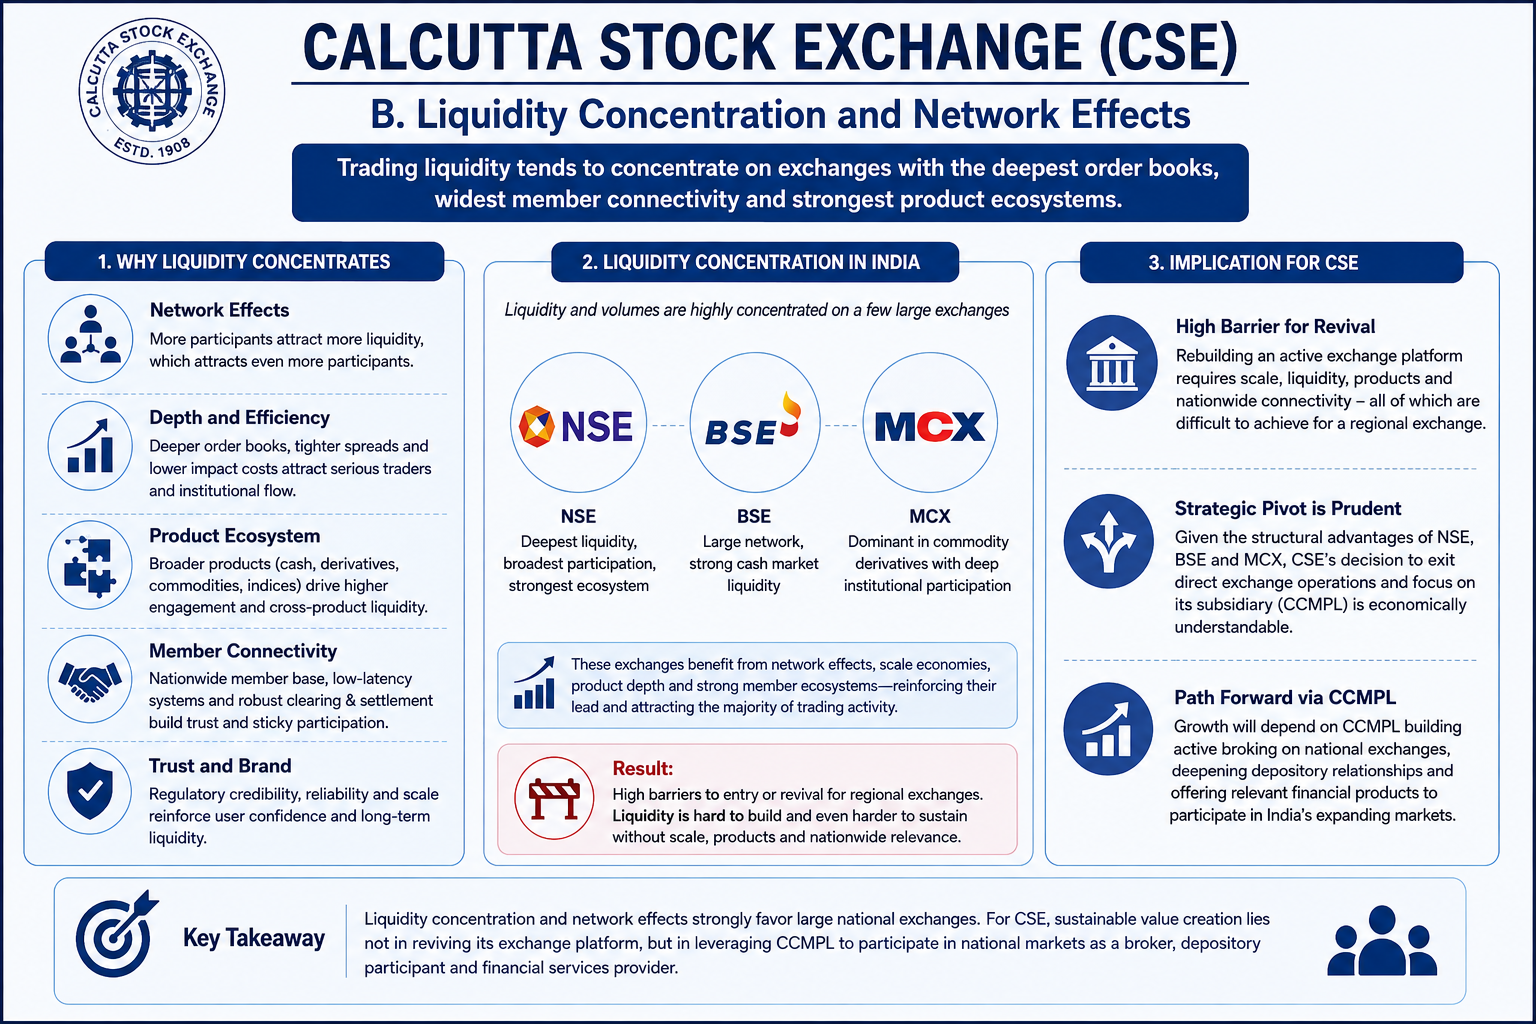
Trading liquidity tends to concentrate on exchanges with the deepest order books, widest member connectivity and strongest product ecosystems
This reinforces the scale advantages of BSE, NSE and MCX and creates a high barrier for a regional exchange seeking revival, making CSE's pivot away from direct exchange operations economically understandable
Technology, Cyber Resilience and Compliance
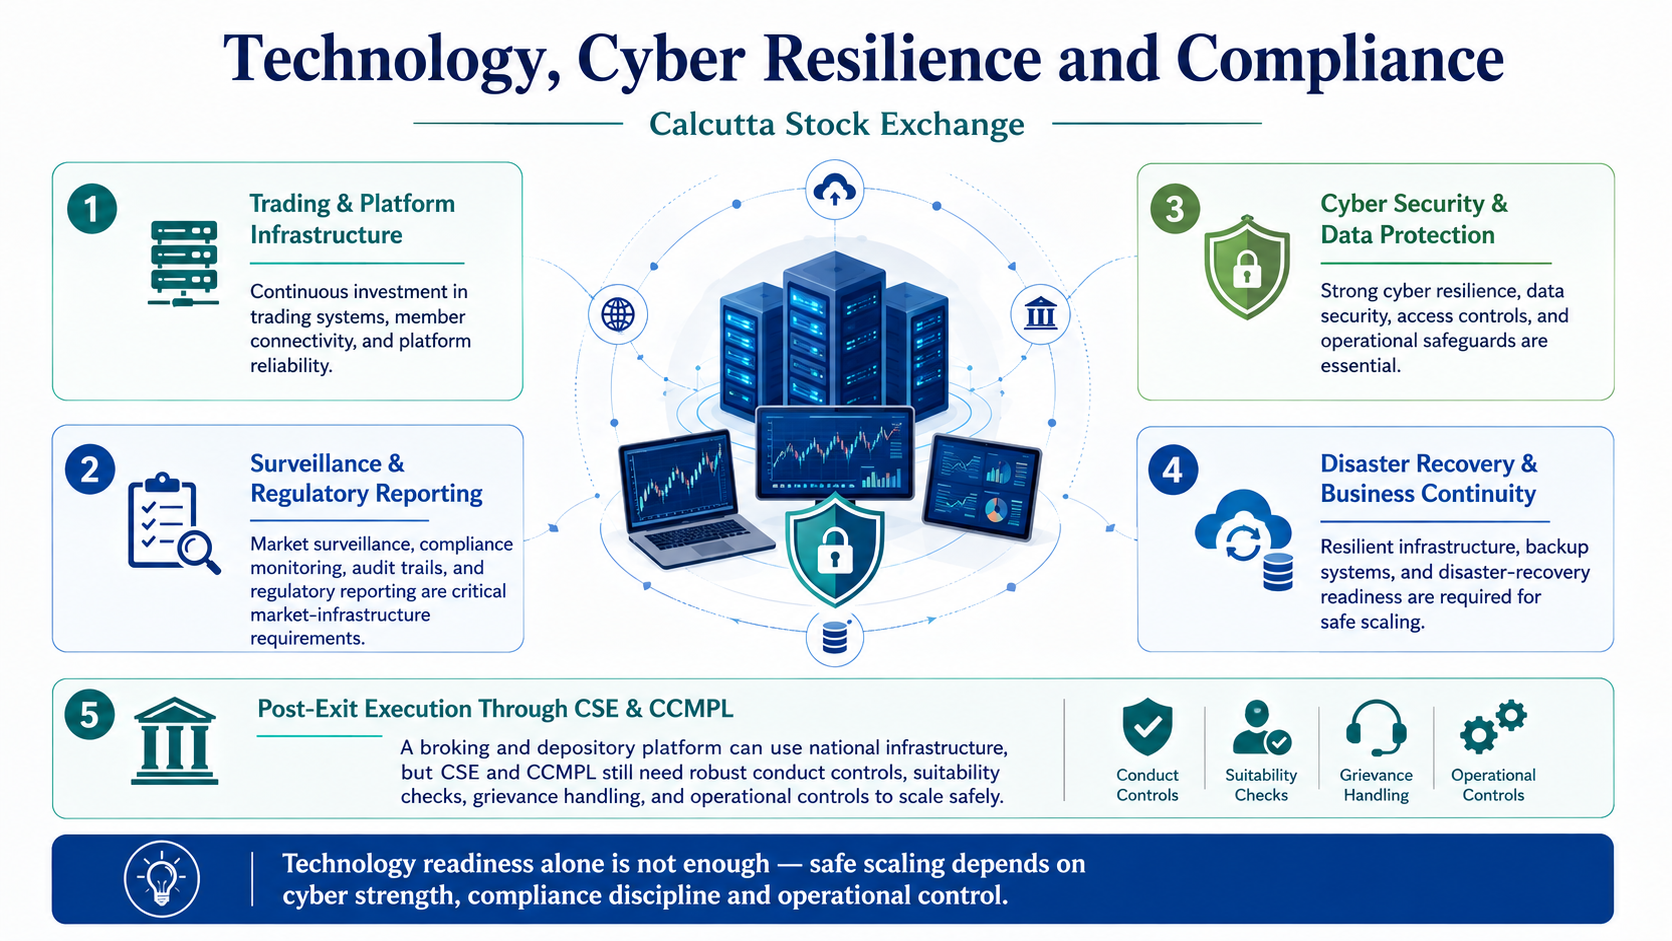
Market infrastructure requires continuous investment in trading systems, surveillance, data security, disaster recovery, connectivity and regulatory reporting
A post-exit broking and depository platform can use national infrastructure, but CSE and CCMPL will still need strong cyber, conduct, suitability, grievance and operational controls to scale safely
Government Policy Support
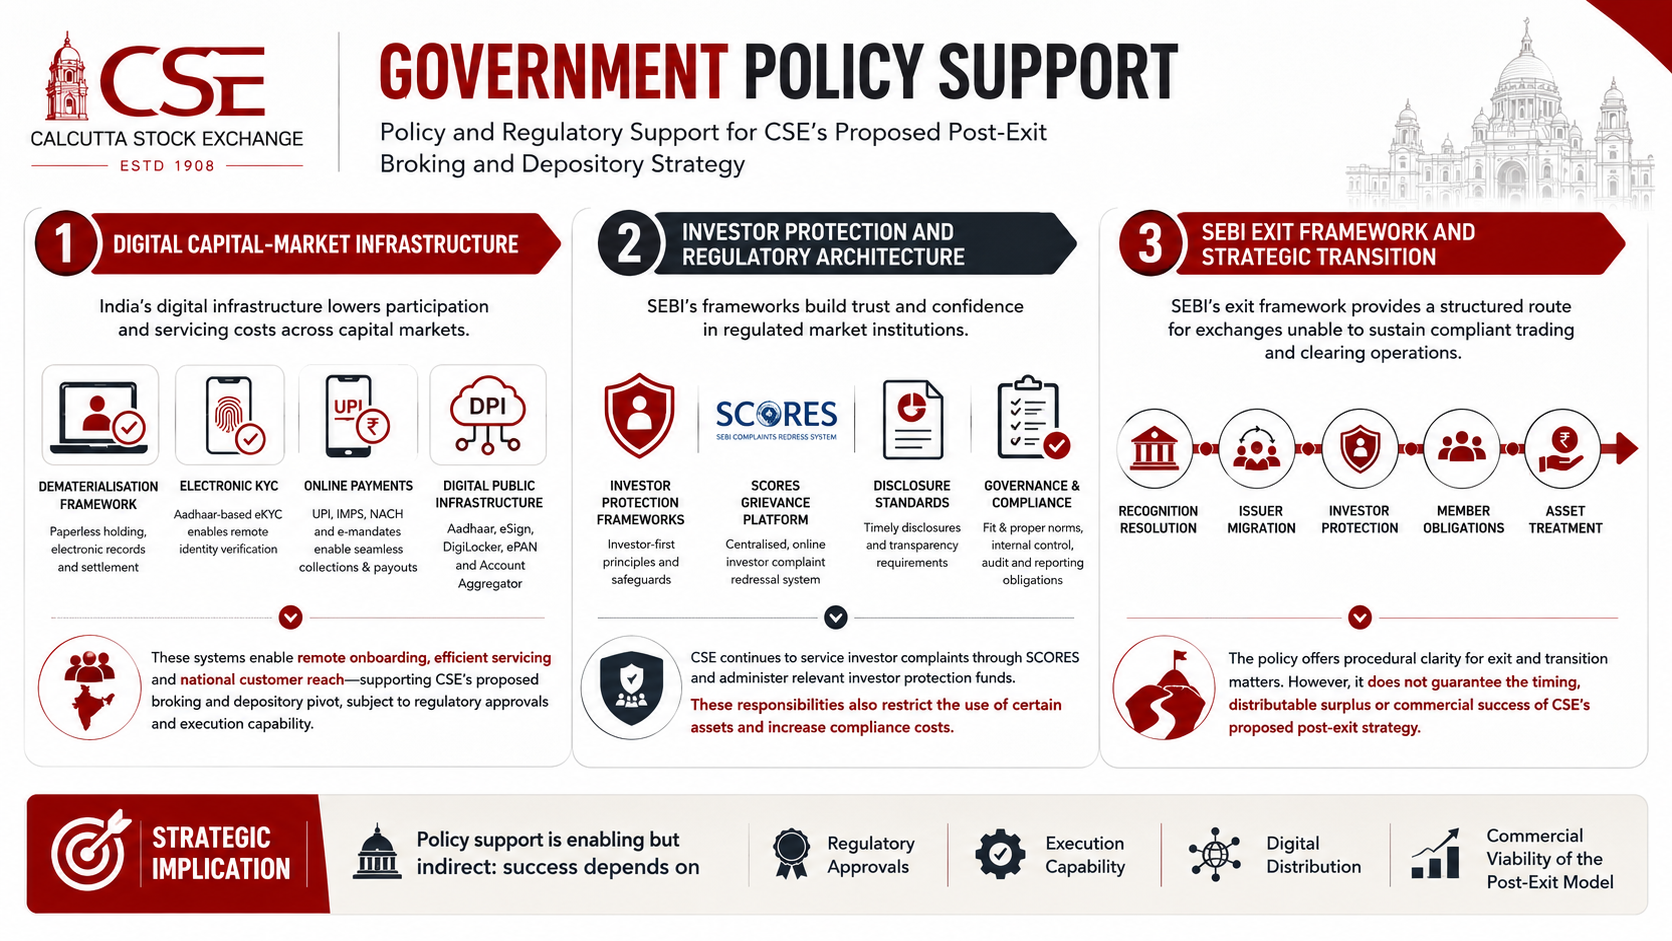
India's dematerialisation framework, electronic KYC, online payments and digital public infrastructure have lowered participation and servicing costs across capital markets
These systems can support CSE's proposed broking and depository pivot by enabling remote onboarding and national customer reach, subject to approvals and execution capability
SEBI's investor-protection frameworks, SCORES grievance platform, disclosure standards and governance requirements support confidence in regulated market institutions
CSE continues to service investor complaints and administer relevant protection funds, but these responsibilities also restrict the use of certain assets and increase compliance costs
SEBI's exit framework provides a route for exchanges that cannot sustain compliant trading and clearing operations to resolve recognition, issuer migration, investor protection, member obligations and asset treatment
The policy offers procedural clarity, but it does not guarantee the timing, distributable surplus or commercial success of CSE's proposed post-exit strategy
- Overview
- Business
- Financial Highlights
- Industry Overview
- Documentation
Get the Preqt App and keep in touch around the clock!
 Monitor your investments in real-time.
- Receive tailored deal suggestions.
- Get real-time updates and alerts.
