


Capgemini Technology Services India Limited
Global Tech LeaderTechnology at Scale
Unlisted Review Rating
Average
DRHP Not FiledTurning Complex Business Challenges into Scalable Digital Solutions
Capgemini Technology Services India Limited is a high-margin, debt-free and cash-generative business with substantial global exposure and an attractive P/E discount to the displayed industry multiple. The main concerns are limited standalone revenue growth, low independent-director representation and exceptionally high dependence on related Capgemini Group entities for revenue.
PARAMETER
WEIGHT
SCORE
KEY FACTORS
Financial Performance
25.0%
4.0/5
The Company has high-quality financial characteristics, including strong margins, positive cash conversion and negligible financial leverage
Show more
Detailed Analysis
Consolidated revenue increased from INR 27,875.4 Cr in FY23 to INR 29,068.2 Cr in FY25, representing a 2-year CAGR of 2.1%. Revenue grew by 4.6% in FY25, from INR 27,786.0 Cr in FY24
EBITDA increased from INR 5,358.1 Cr in FY24 to INR 5,730.8 Cr in FY25, representing growth of 7.0%. EBITDA margin improved from 19.3% to 19.7%
Consolidated PAT increased from INR 3,245.9 Cr in FY24 to INR 3,613.0 Cr in FY25, representing growth of 11.3%. PAT margin improved from 11.7% to 12.4%
The Group reported no external borrowings. Total lease liabilities stood at INR 1,070.4 Cr, against equity of INR 19,831.6 Cr, resulting in a lease-inclusive debt-to-equity ratio of approximately 0.1x
FY25 PAT of INR 3,613.0 Cr, against average FY24–FY25 equity of INR 20,270.9 Cr, resulted in an ROE of approximately 17.8%
Operating cash flow remained positive and increased from INR 3,687.0 Cr in FY24 to INR 3,762.2 Cr in FY25, representing growth of 2.0%
Industry
25.0%
2.0/5
The sector benefits from digital transformation, cloud adoption and enterprise AI spending
Show more
Detailed Analysis
India’s technology industry revenue was estimated at USD 283.0 billion in FY25, representing growth of 5.1%, while technology exports increased by 4.6% to USD 224.0 billion
The Indian technology-services industry has an annual revenue base of USD 283.0 billion, but is growing at approximately 5.1%
The top five participants generated only 19.3% of Indian computer and related-services production value in 2024.
Management
25.0%
3.0/5
The high related-party percentage is structurally linked to the Company’s role as an India delivery entity within the global Capgemini Group
Show more
Detailed Analysis
The Company does not have a conventional founder-led management structure. Ashwin Yardi, the Whole-time Director and CEO during FY25, had approximately 31.0 years of consulting, technology and outsourcing experience and had been associated with Capgemini since 2001
The board comprised 9.0 directors, including 2.0 independent directors, representing independent board participation of approximately 22.2%
Certain whistle-blower investigations, tax disputes and transfer-pricing proceedings remained open at the date of the audit report
Valuation
25.0%
4.0/5
Capgemini Technology Services India appears attractive on the headline earnings multiple
Show more
Detailed Analysis
The Company is valued at a P/E multiple of 18.0x, compared with the IT-services industry P/E of 30.0x, representing a discount of approximately 39.9%
The Company is valued at approximately 11.7x EV/EBITDA. The selected peer median is 11.0x, resulting in a premium of approximately 6.9%
The unlisted share price remained broadly stable at approximately INR 11,000.0 between July 7, 2026 and July 21, 2026, resulting in an observed price range of approximately 0.0%
TOTAL
100%
3.3/5
Weighted Composite Score
Per Share Price
₹10999.0
As of 14 Oct 2026
Lot Size
50.0 Shares
Minimum Investment
₹5,49,95,000.0 / 5,000 shares
Market Cap. (₹ Cr)
Revenue FY’25
P/E Multiple
Face Value
₹ 10.0Lot Size
50.0 sharesSale Type
SecondaryPAT Margin (%)
12.4 %P/E Multiple
18.0xCAGR Growth 3Y
2.1 %ROE (FY’25)
17.8 %ROCE (FY’25)
23.1 %Price to Book Value ratio
3.3xDebt/Equity (FY’25)
0.0xMerchant banker appointed
❌ NoCompany Website
www.capgemini.com/in-enDisclaimer: Unlisted shares are unregulated & illiquid. This is NOT investment advice. Please do your own due diligence before investing.
Minimum Investment
₹5,49,95,000.0 / 5,000 sharesShares Lot 50 X 100
Investment amount
₹5,49,95,000.0
Overview
Business
Services
Business Model
Geographical Presence
Sales Channel
Financial Highlights
Income Statement
Revenue growth with EBITDA and PAT margins
| Financial Metric | FY 2023 | FY 2024 | FY 2025 |
|---|---|---|---|
| Revenue (₹ Cr) | 27,875.4 | 27,786.0 | 29,068.2 |
| Growth (%) | 23.2% | -0.3% | 4.6% |
| EBITDA (₹ Cr) | 5,012.9 | 5,358.1 | 5,730.8 |
| EBITDA Margin (%) | 18.0% | 19.3% | 19.7% |
| PAT (₹ Cr) | 3,174.8 | 3,245.9 | 3,613.0 |
| PAT Margin (%) | 11.4% | 11.7% | 12.4% |
OBSERVATIONS & INSIGHTS
Consolidated revenue from operations increased from ₹27,875.40 Cr in FY23 to ₹29,068.2 Cr in FY25, indicating modest revenue growth over the period
EBITDA increased from ₹5,012.90 Cr in FY23 to ₹5,730.80 Cr in FY25, while EBITDA margin improved from 18.0% to 19.7%
Profit for the year increased from ₹3,174.80 Cr in FY23 to ₹3,613.00 Cr in FY25, supported by stable operating performance and other income
FY25 reported a large dividend payout in cash flow from financing activities, which reduced total equity compared with FY24
Balance Sheet
| Financial Metric | FY 2023 | FY 2024 | FY 2025 |
|---|---|---|---|
| EQUITY & LIABILITIES | ₹ 22,549.5 Cr | ₹ 25,103.8 Cr | ₹ 24,556.5 Cr |
| Net Worth | ₹ 18,053.0 Cr | ₹ 20,710.1 Cr | ₹ 19,831.6 Cr |
| Share Capital | ₹ 59.3 Cr | ₹ 59.3 Cr | ₹ 59.3 Cr |
| Reserves & Surplus | ₹ 17,993.7 Cr | ₹ 20,650.8 Cr | ₹ 19,772.3 Cr |
| Total Liabilities | ₹ 4,496.5 Cr | ₹ 4,393.7 Cr | ₹ 4,724.9 Cr |
| Current Liabilities | ₹ 3,439.9 Cr | ₹ 3,514.5 Cr | ₹ 3,815.3 Cr |
| Borrowings | ₹ 223.5 Cr | ₹ 253.0 Cr | ₹ 281.7 Cr |
| Trade Payables | ₹ 895.2 Cr | ₹ 791.7 Cr | ₹ 950.3 Cr |
| Other Current Liabilities | ₹ 2,321.2 Cr | ₹ 2,469.8 Cr | ₹ 2,583.3 Cr |
| Non-Current Liabilities | ₹ 1,056.6 Cr | ₹ 879.2 Cr | ₹ 909.6 Cr |
| Borrowings | ₹ 514.6 Cr | ₹ 609.4 Cr | ₹ 788.7 Cr |
| Other Non-Current Liabilities | ₹ 542.0 Cr | ₹ 269.8 Cr | ₹ 120.9 Cr |
| ASSETS | ₹ 22,549.5 Cr | ₹ 25,103.8 Cr | ₹ 24,556.4 Cr |
| Current Assets | ₹ 15,330.4 Cr | ₹ 17,451.0 Cr | ₹ 16,702.3 Cr |
| Trade Receivables | ₹ 5,156.4 Cr | ₹ 4,968.7 Cr | ₹ 5,088.3 Cr |
| Inventory | ₹ 0.0 Cr | ₹ 0.0 Cr | ₹ 0.0 Cr |
| Cash & Cash Equivalents | ₹ 921.7 Cr | ₹ 1,773.6 Cr | ₹ 1,804.6 Cr |
| Other Current Assets | ₹ 9,252.3 Cr | ₹ 10,708.7 Cr | ₹ 9,809.4 Cr |
| Non-Current Assets | ₹ 7,219.1 Cr | ₹ 7,652.8 Cr | ₹ 7,854.1 Cr |
| Fixed Assets | ₹ 4,447.8 Cr | ₹ 4,670.4 Cr | ₹ 4,770.4 Cr |
| Other Non-Current Assets | ₹ 2,771.3 Cr | ₹ 2,982.4 Cr | ₹ 3,083.7 Cr |
OBSERVATIONS & INSIGHTS
Total assets increased from ₹22,549.50 Cr in FY23 to ₹24,556.50 Cr in FY25
Net worth increased from ₹18,053.00 Cr in FY23 to ₹19,831.60 Cr in FY25, although FY25 equity declined versus FY24 due to dividend payout
Current investments and cash / bank balances represent a large part of the balance sheet, indicating a strong liquidity position
Trade receivables remained broadly stable around ₹5,000 Cr across FY23-FY25
The Company has no separately disclosed external borrowings or debt securities; lease liabilities are the primary financial liabilities classified as borrowings in this table.
Cash Flow
| Financial Metric | FY 2023 | FY 2024 | FY 2025 |
|---|---|---|---|
CFO (₹ Cr) Cash generated from core business operations. | +3,303.1 Cr | +3,687 Cr | +3,762.2 Cr |
CFI (₹ Cr) Cash used for investments and long-term assets. | -2,572.5 Cr | -2,309 Cr | +1,455.6 Cr |
CFF (₹ Cr) Cash flow related to funding and borrowings. | -496.9 Cr | -572 Cr | -5,184.7 Cr |
Working Capital
| Efficiency Metric | FY 2023 | FY 2024 | FY 2025 |
|---|---|---|---|
Debtor Days Average number of days taken to collect customer payments. | - | - | - |
Creditor Days Average time taken to pay suppliers and vendors. | - | - | - |
Inventory Days Average number of days inventory remains unsold. | - | - | - |
CCC (Cash Conversion Cycle) (Debtor Days + Inventory Days - Creditor Days) | - | - | - |
Financial Ratios
Measures the company’s leverage relative to shareholder equity.
OBSERVATIONS & INSIGHTS
ROE stood at approximately 17.8% in FY25 based on average equity, reflecting strong profitability despite a large equity base
ROCE improved to approximately 23.1% in FY25 using the specified capital employed methodology
Interest coverage is very high because finance cost is minimal and largely lease-related
Current ratio remained above 4.0x across FY23-FY25 due to significant current investments, cash balances and receivables.
Industry Overview
Industry Drivers
Expansion of Technological Capabilities
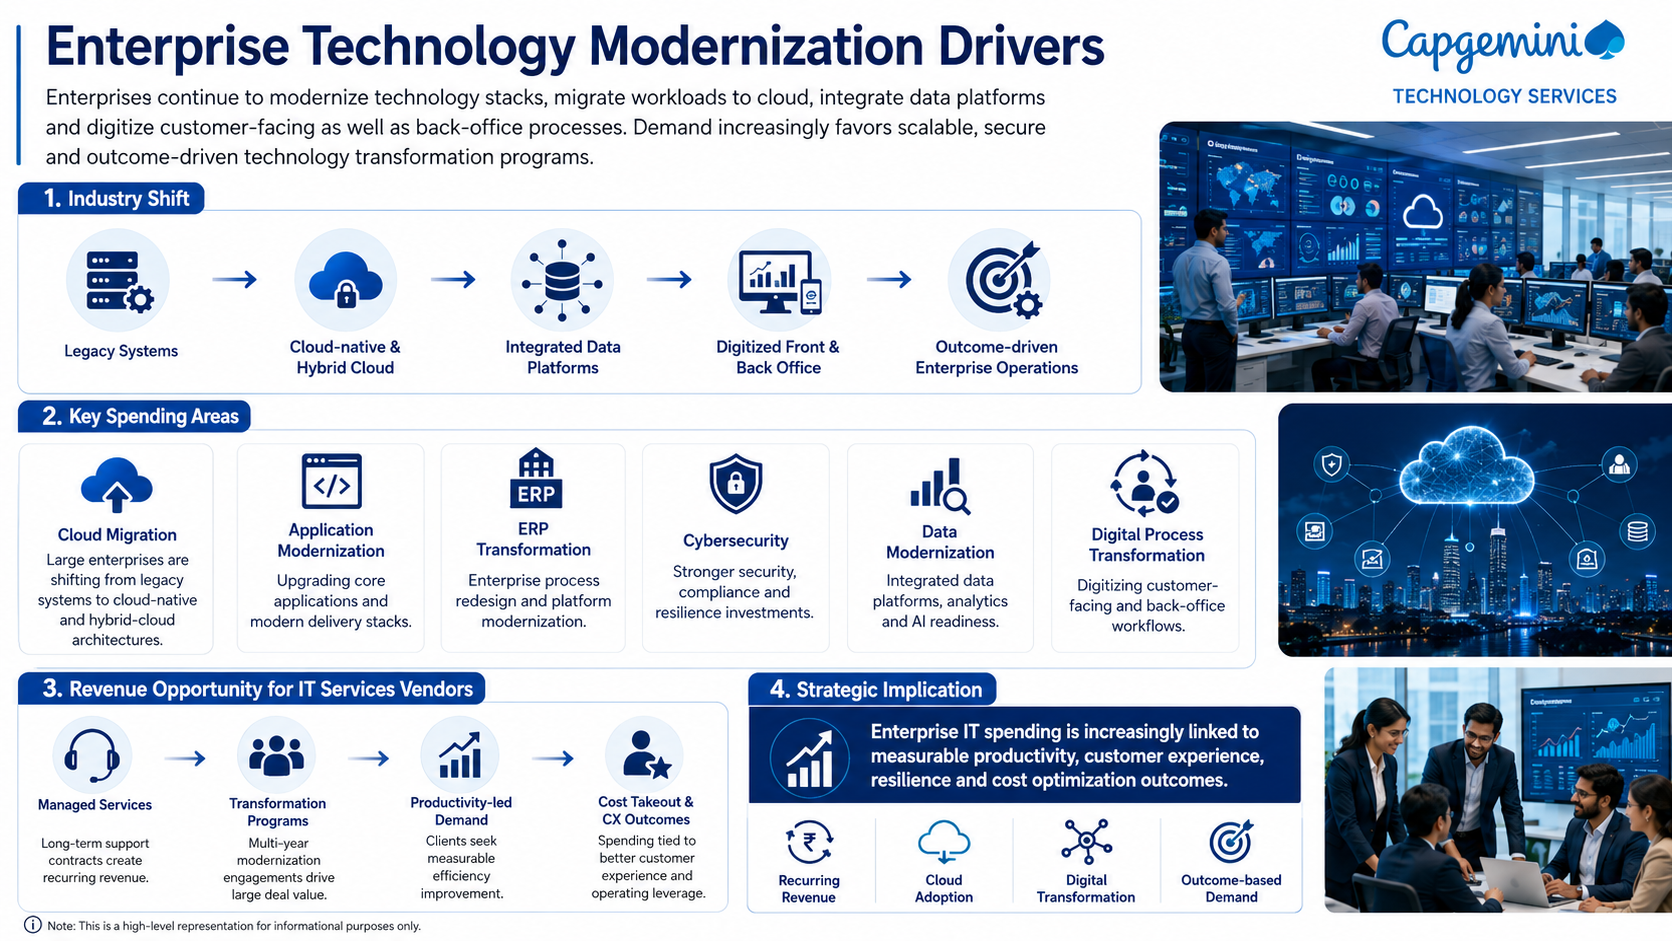
Enterprises continue to modernize technology stacks, migrate workloads to cloud, integrate data platforms and digitize customer-facing as well as back-office processes
Large enterprises are shifting from legacy systems to cloud-native and hybrid-cloud architectures
Application modernization, ERP transformation, cybersecurity and data modernization remain key spending areas
Long-term managed services and transformation programs can create recurring revenue opportunities for large IT services vendors
Demand is increasingly tied to measurable productivity, customer experience and cost takeout outcomes.
Expansion of AI, Data and Automation Capabilities
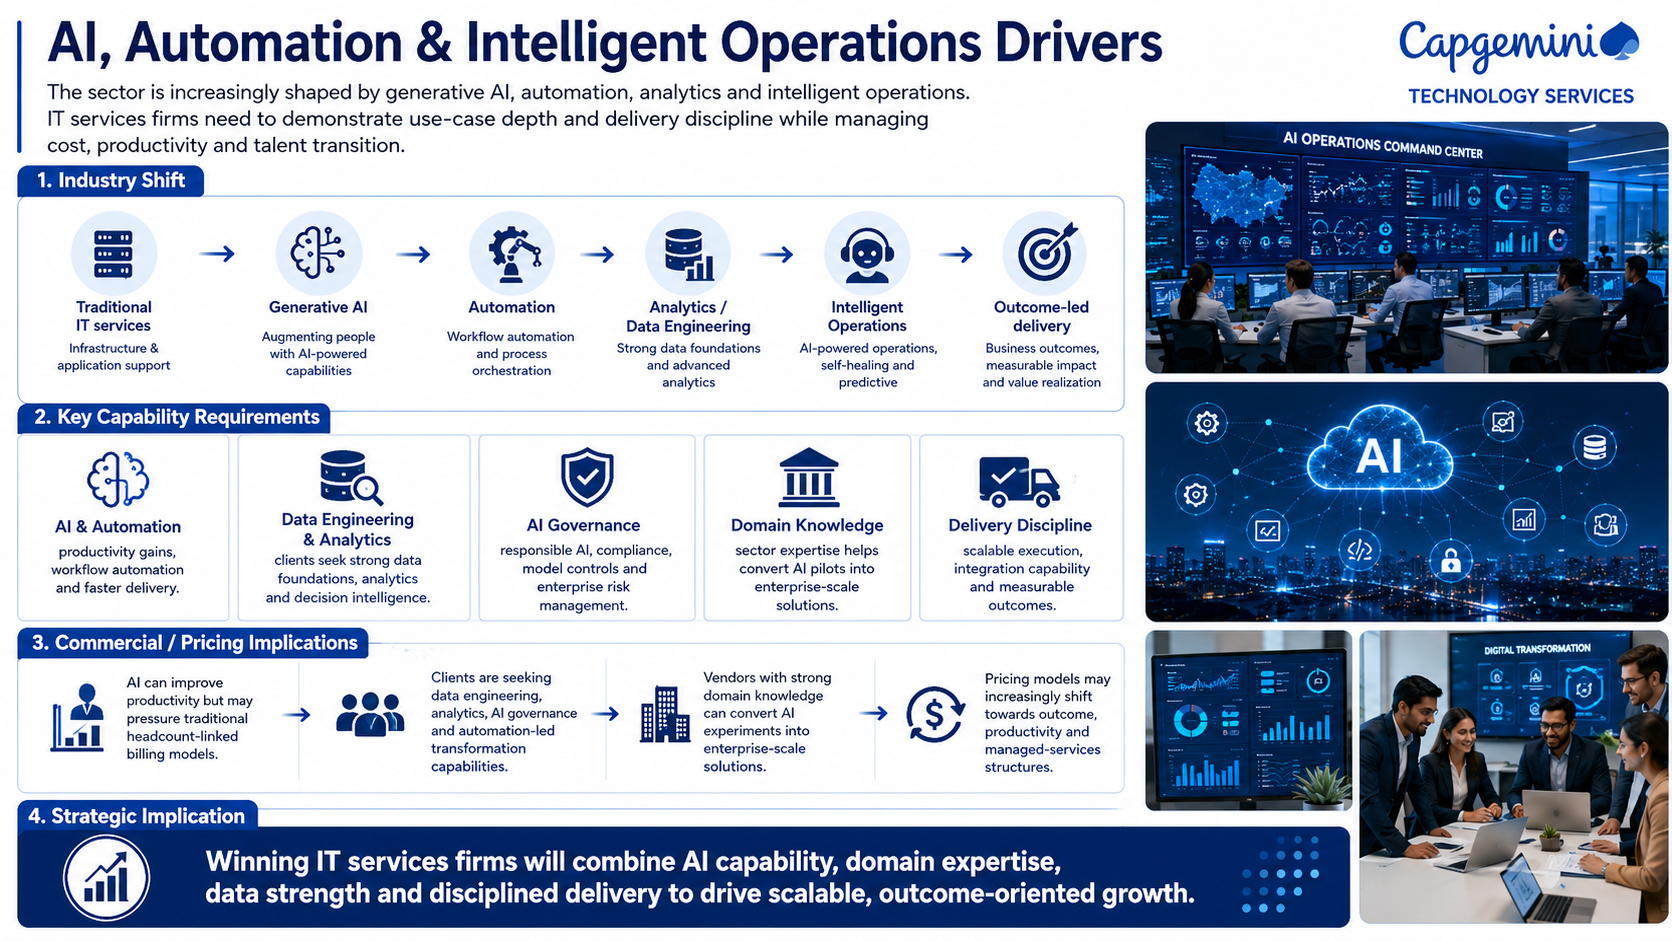
The sector is increasingly shaped by generative AI, automation, analytics and intelligent operations. IT services firms need to demonstrate use-case depth and delivery discipline while managing cost, productivity and talent transition.
AI and automation can improve productivity but may also pressure traditional headcount-linked billing models
Clients are seeking data engineering, analytics, AI governance and automation-led transformation capabilities
Vendors with strong domain knowledge can convert AI experiments into enterprise-scale solutions
Pricing models may increasingly shift towards outcome, productivity and managed-services structures.
Global Delivery & Cost Efficiency
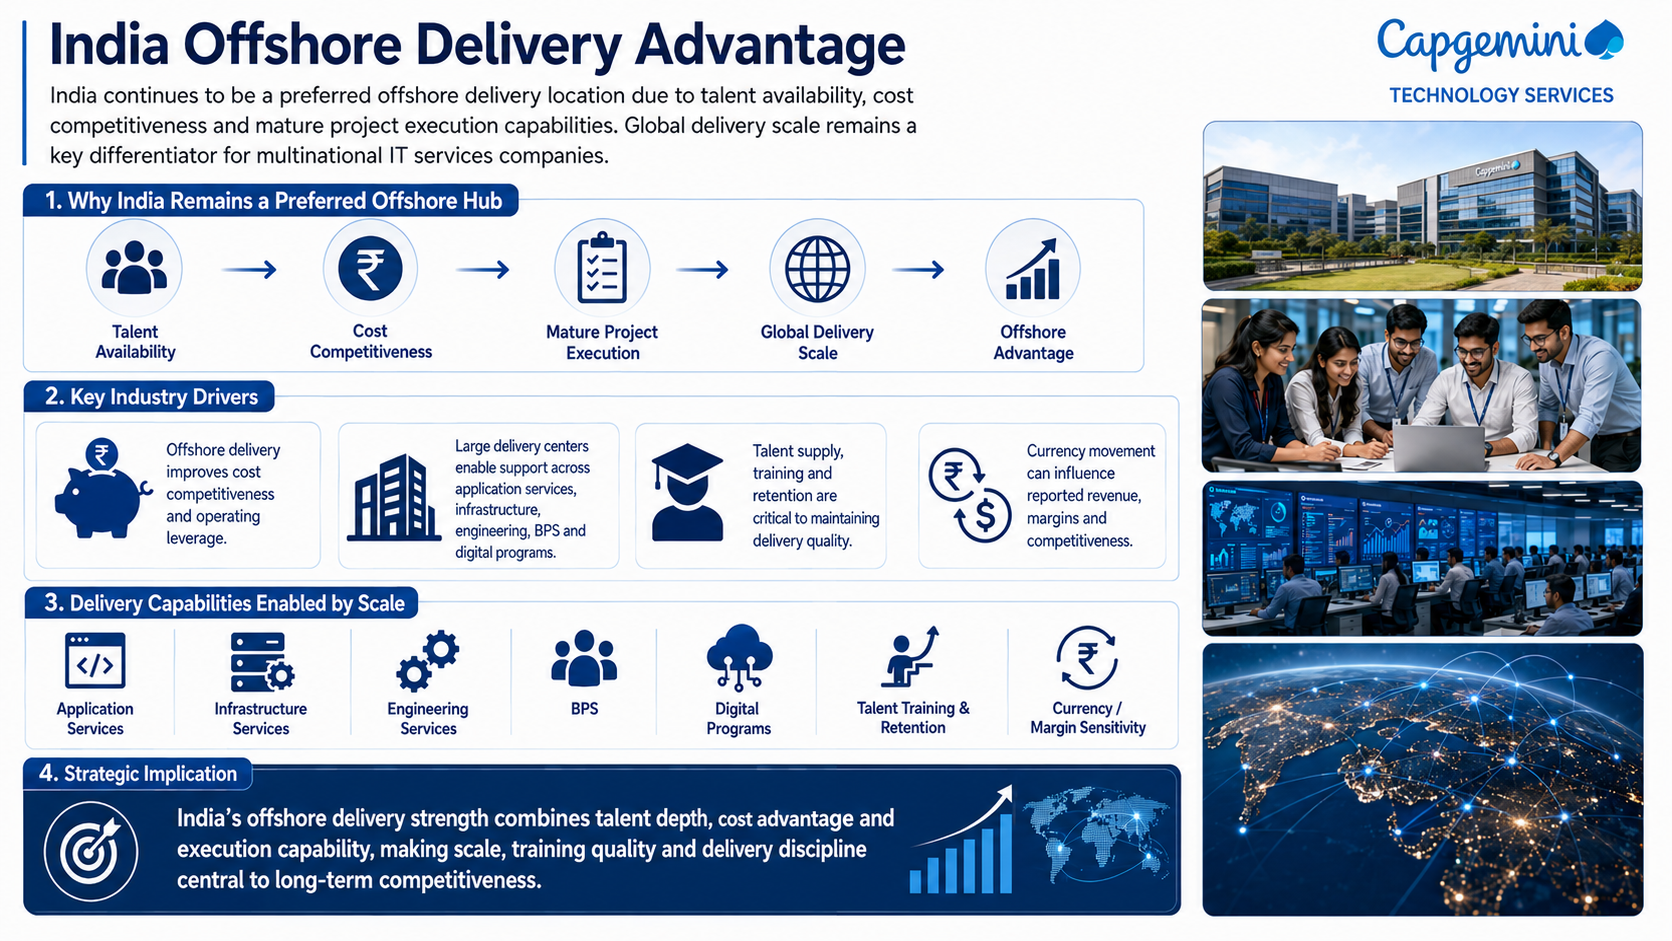
India continues to be a preferred offshore delivery location due to talent availability, cost competitiveness and mature project execution capabilities. Global delivery scale remains a key differentiator for multinational IT services companies.
Offshore delivery improves cost competitiveness and operating leverage
Large delivery centers enable support across application services, infrastructure, engineering, BPS and digital programs
Talent supply, training and retention are critical to maintaining delivery quality
Currency movement can influence reported revenue, margins and competitiveness
Risks in the Industry
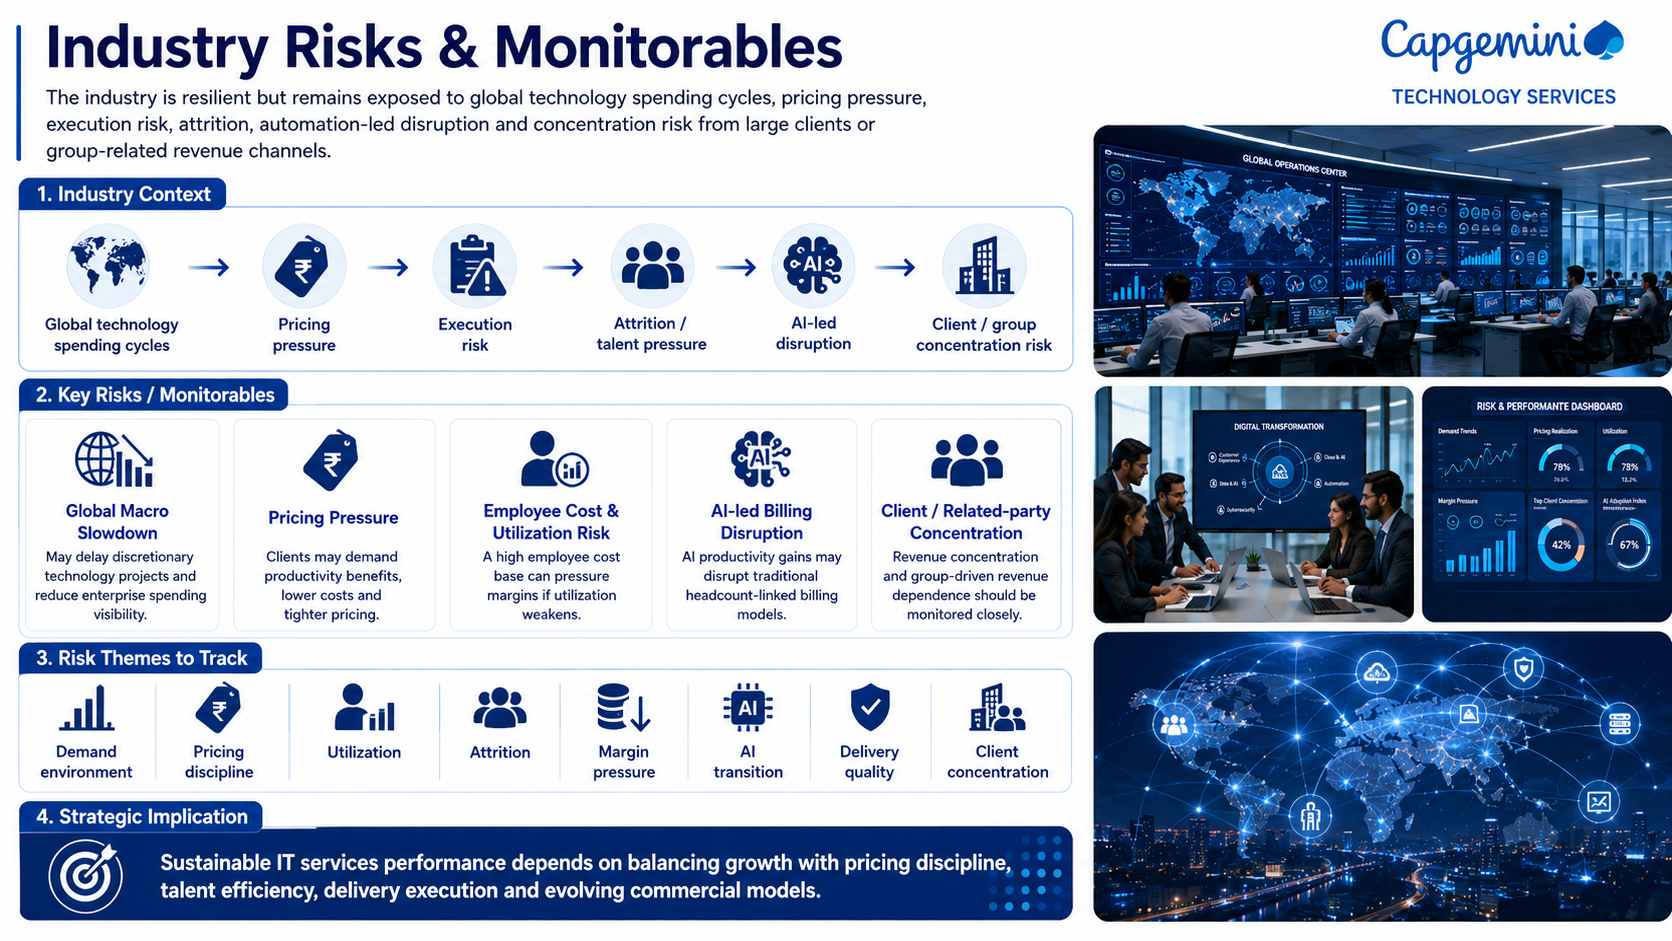
The industry is resilient but remains exposed to global technology spending cycles, pricing pressure, execution risk, attrition, automation-led disruption and concentration risk from large clients or group-related revenue channels
Global macro slowdown can delay discretionary technology projects
Pricing pressure may increase when clients push for productivity benefits and cost savings
High employee cost base can pressure margins if utilization weakens
AI-led productivity may disrupt traditional billing models
Client concentration and related-party dependence should be monitored where revenue is group-driven
Government Policy Support
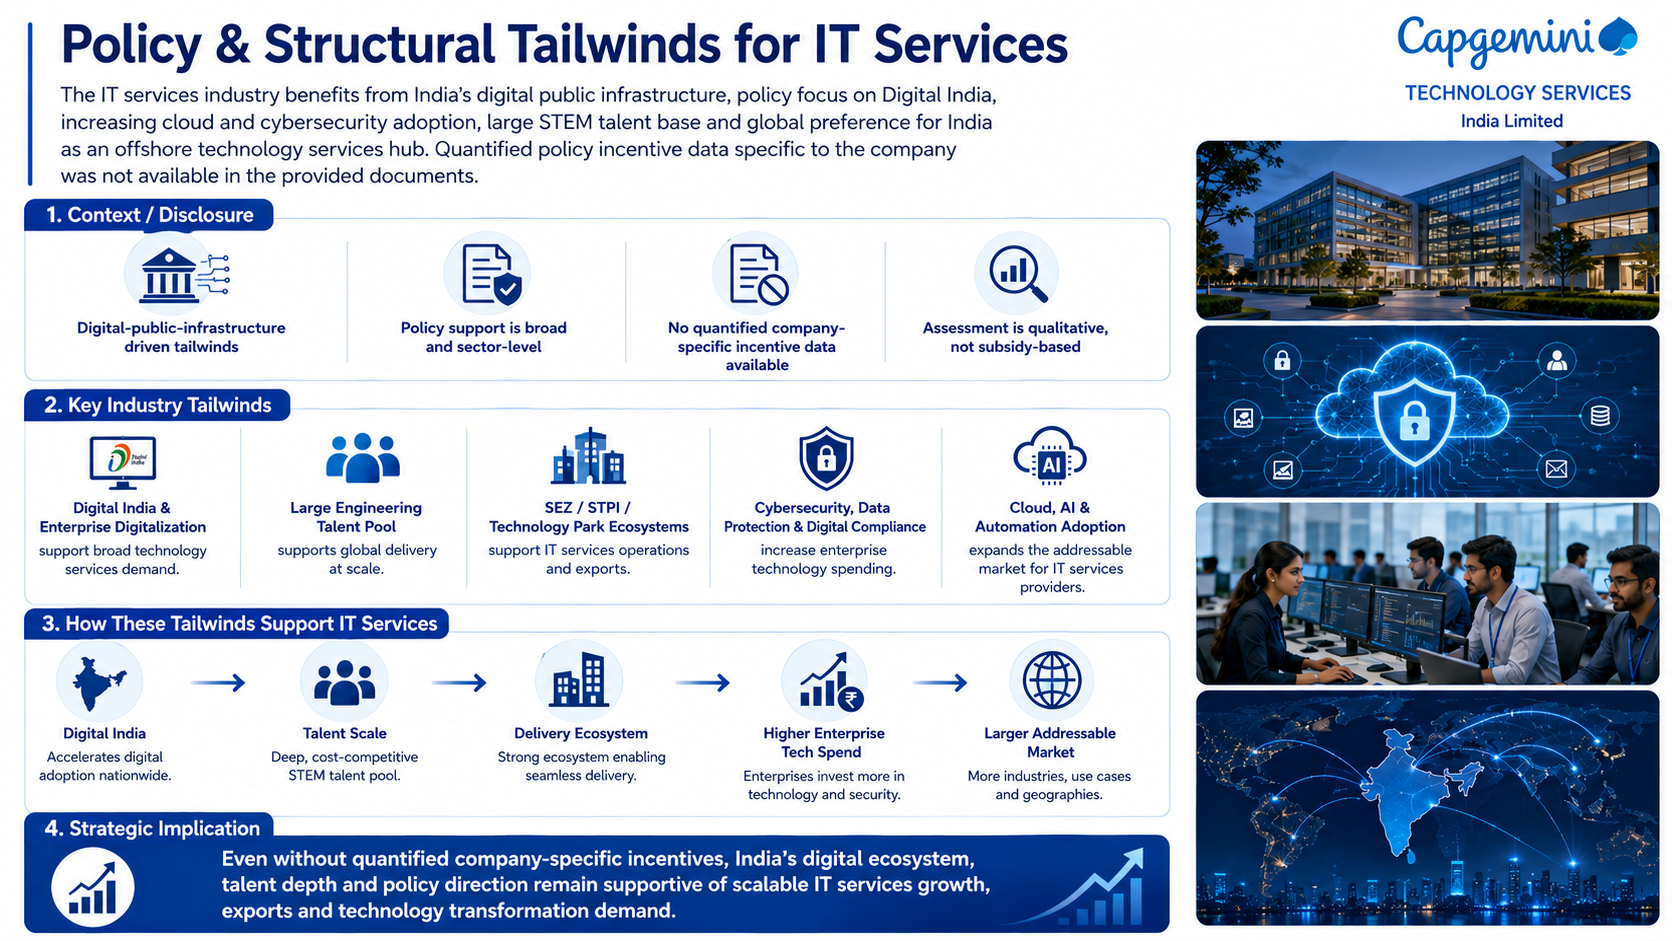
The IT services industry benefits from India’s digital public infrastructure, policy focus on Digital India, increasing cloud and cybersecurity adoption, large STEM talent base and global preference for India as an offshore technology services hub. Quantified policy incentive data specific to the company was not available in the provided documents.
Digital India and enterprise digitalization support broad technology services demand
India’s engineering talent pool supports global delivery at scale
SEZ/STPI and technology-park ecosystems support IT services operations and exports
Cybersecurity, data protection and digital compliance requirements can increase enterprise technology spending. Government and enterprise adoption of cloud, AI and automation can expand the addressable market for IT services providers
- Overview
- Business
- Financial Highlights
- Industry Overview
- Documentation
Get the Preqt App and keep in touch around the clock!
 Monitor your investments in real-time.
- Receive tailored deal suggestions.
- Get real-time updates and alerts.
