


Care Health Insurance Ltd.
Protection for Better Healthovering Health, Securing Lives
IPO Review and Rating
Strong Buy
Based on comprehensive analysisSpeculative
Care Health has delivered excellent premium growth, maintains positive operating cash flow and possesses an established standalone health-insurance franchise. However, the combined ratio has deteriorated to 107%, underwriting moved into loss, PAT declined approximately 92%, ROE is negligible, and solvency headroom remains limited. Valuation is especially demanding at nearly 6x book and over 100x normalized three-year earnings. Reconsideration would be more appropriate after the combined ratio falls below 100%, profitability and ROE recover
PARAMETER
WEIGHT
SCORE
KEY FACTORS
Financial Performance
25.0%
2.5/5
Premium growth remains strong, but underwriting losses, collapsing PAT, weak ROE and limited solvency headroom materially reduce quality
Show more
Detailed Analysis
Gross direct premium increased from INR 6,864.4 crore in FY24 to INR 10,031.3 crore in FY26—a 20.9% CAGR
Combined ratio deteriorated from 95% to 107%, producing an FY26 underwriting loss of ₹151.2 crore
PAT was only INR 12.2 crore, representing approximately 0.1% of gross direct premium
Debt/equity was only 0.04x
FY26 ROE was approximately 0.5%, reflecting negligible earnings on an average net worth near INR 2,499 crore
Industry
25.0%
2.6/5
Structural growth is strong, but intense competition, medical inflation, domestic concentration and stringent regulation constrain industry attractiveness
Show more
Detailed Analysis
India’s health-insurance premiums expanded approximately 15%, while standalone health insurers grew around 19% during FY26
Low insurance penetration, healthcare inflation and increasing awareness
Care’s approximately 7% market share and numerous public, private and standalone insurers indicate intense, fragmented competition
Pricing, products, capital, claims, commissions and solvency are extensively regulated by IRDAI
Operations and premium income are overwhelmingly domestic, providing negligible export-demand diversification.
Management
25.0%
3.5/5
Experienced insurance leadership and low operating RPTs are offset by contingent liabilities and only moderate board independence
Show more
Detailed Analysis
The Company has operated since 2012 and benefits from experienced financial-services and private-equity shareholders
Four of eleven directors were independent, representing 36.4%
Operating RPTs excluding capital transactions were approximately ₹32.4 crore—only around 0.3% of gross premium
Valuation Metrics
25.0%
1.8/5
Extreme earnings and book-value multiples, underwriting losses and volatile unlisted pricing outweigh the apparently reasonable premium multiple
Show more
Detailed Analysis
P/E is 1,333x versus 35x industry; even three-year average earnings imply approximately 101x
Insurer-adjusted price/GWP is approximately 1.59x, a more meaningful and comparatively moderate measure than EV/EBITDA
The supplied 5.98x P/B multiple is expensive considering 0.5% ROE and current underwriting losses
TOTAL
100%
2.6/5
Weighted Composite Score
Per Share Price
₹160.0
As of 14 Oct 2026
Lot Size
100.0 Shares
Minimum Investment
₹16,000.0 / 100 shares
Market Cap. (₹ Cr)
Net Premium FY’26
PAT FY’26
P/E Multiple
Face Value
₹ 10.0Lot Size
100.0 sharesPAT FY’26
₹ 12.2 CrPAT Margin (%)
0.1 %P/E Multiple
1,333.3xCAGR Growth 2Y
21.0 %Price to Book Value ratio
6.0xDebt/Equity (FY’26)
6.0xMerchant banker appointed
❌ NoCompany Website
www.careinsurance.com/health-insuranceDisclaimer: Unlisted shares are unregulated & illiquid. This is NOT investment advice. Please do your own due diligence before investing.
Minimum Investment
₹16,000.0 / 100 sharesShares Lot 100 X 1
Investment amount
₹16,000.0
Overview
Business
Business Model
Geographical Presence
Sales Channel
Financial Highlights
Income Statement
Revenue growth with EBITDA and PAT margins
| Financial Metric | FY 2024 | FY 2025 | FY 2026 |
|---|---|---|---|
| Revenue (₹ Cr) | 5,328.7 | 6,347.0 | 7,255.0 |
| Growth (%) | 35.5% | 19.1% | 14.3% |
| EBITDA (₹ Cr) | 0.0 | - | - |
| EBITDA Margin (%) | 0.0% | - | - |
| PAT (₹ Cr) | 304.9 | 155.2 | 12.2 |
| PAT Margin (%) | 5.7% | 2.4% | 0.2% |
OBSERVATIONS & INSIGHTS
Net earned premium increased at a 16.7% two-year CAGR, but annual growth moderated from 19.1% in FY25 to 14.3% in FY26
The underwriting result deteriorated from a ₹356.0 Cr profit in FY24 to a ₹151.2 Cr loss in FY26 as claims and distribution expenses grew faster than earned premium
PAT declined 96.0% over two years to ₹12.2 Cr, reducing EPS to ₹0.1 and making the supplied P/E an unreliable measure of normalised value
Balance Sheet
| Financial Metric | FY 2024 | FY 2025 | FY 2026 |
|---|---|---|---|
| EQUITY & LIABILITIES | ₹ 12,028.2 Cr | ₹ 15,669.6 Cr | ₹ 21,146.8 Cr |
| Net Worth | ₹ 2,197.7 Cr | ₹ 2,372.2 Cr | ₹ 2,642.4 Cr |
| Share Capital | ₹ 972.0 Cr | ₹ 974.2 Cr | ₹ 995.9 Cr |
| Reserves & Surplus | ₹ 1,225.7 Cr | ₹ 1,398.0 Cr | ₹ 1,646.5 Cr |
| Total Liabilities | ₹ 9,830.5 Cr | ₹ 13,297.4 Cr | ₹ 18,504.4 Cr |
| Current Liabilities | ₹ 4,915.3 Cr | ₹ 6,648.7 Cr | ₹ 9,252.2 Cr |
| Borrowings | ₹ 0.0 Cr | ₹ 0.0 Cr | ₹ 0.0 Cr |
| Provisions | ₹ 2,912.7 Cr | ₹ 3,305.6 Cr | ₹ 3,792.8 Cr |
| Other Current Liabilities | ₹ 2,002.6 Cr | ₹ 3,343.1 Cr | ₹ 5,459.4 Cr |
| Non-Current Liabilities | ₹ 4,915.2 Cr | ₹ 6,648.7 Cr | ₹ 9,252.2 Cr |
| Borrowings | ₹ 0.0 Cr | ₹ 0.0 Cr | ₹ 0.0 Cr |
| Insurance liabilities | ₹ 4,915.2 Cr | ₹ 6,648.7 Cr | ₹ 9,252.2 Cr |
| ASSETS | ₹ 12,029.1 Cr | ₹ 15,668.6 Cr | ₹ 22,146.7 Cr |
| Current Assets | ₹ 396.9 Cr | ₹ 543.6 Cr | ₹ 986.9 Cr |
| Trade Receivables | ₹ 0.0 Cr | ₹ 0.0 Cr | ₹ 0.0 Cr |
| Inventory | ₹ 0.0 Cr | ₹ 0.0 Cr | ₹ 0.0 Cr |
| Cash & Cash Equivalents | ₹ 95.8 Cr | ₹ 193.5 Cr | ₹ 521.9 Cr |
| Advances & Other Assets | ₹ 301.1 Cr | ₹ 350.1 Cr | ₹ 465.0 Cr |
| Non-Current Assets | ₹ 11,632.2 Cr | ₹ 15,125.0 Cr | ₹ 21,159.8 Cr |
| Fixed Assets | ₹ 0.0 Cr | ₹ 0.0 Cr | ₹ 0.0 Cr |
| Investments | ₹ 11,632.2 Cr | ₹ 15,125.0 Cr | ₹ 21,159.8 Cr |
OBSERVATIONS & INSIGHTS
Shareholders’ wealth increased by ₹445.0 Cr between FY24 and FY26, supported by capital issuance and retained earnings despite the FY26 profit decline; the company also introduced ₹100.0 Cr of borrowings in FY26
Insurance liabilities increased faster than shareholders’ wealth as the policy book expanded, increasing the importance of reserving discipline and asset-liability matching
FY26 included ₹100.0 Cr of subordinated borrowing, while policyholder investments increased sharply to ₹8,538.8 Cr and remained the dominant asset pool
Cash Flow
| Financial Metric | FY 2024 | FY 2025 | FY 2026 |
|---|---|---|---|
CFO (₹ Cr) Cash generated from core business operations. | +1,048.5 Cr | +1,377 Cr | +1,902.4 Cr |
CFI (₹ Cr) Cash used for investments and long-term assets. | -1,168.0 Cr | -1,286.4 Cr | -2,001.3 Cr |
CFF (₹ Cr) Cash flow related to funding and borrowings. | +115.7 Cr | +6.2 Cr | +423 Cr |
Industry Overview
Industry Drivers
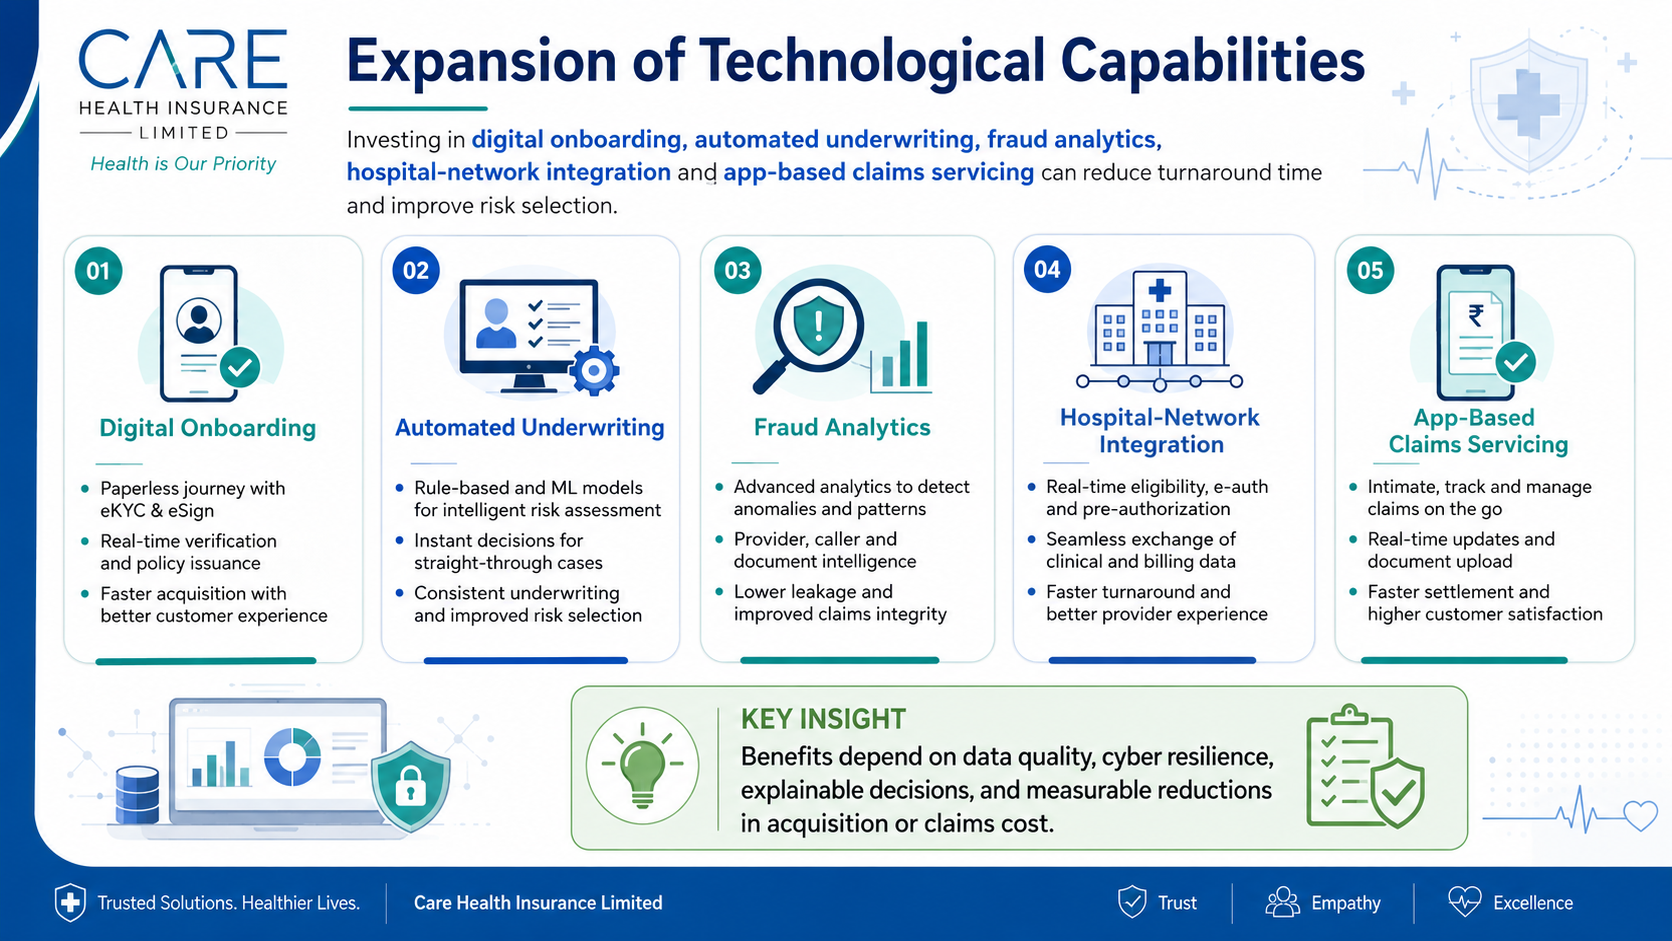
Expansion of Technological Capabilities
Digital onboarding, automated underwriting, fraud analytics, hospital-network integration and app-based claims servicing can reduce turnaround time and improve risk selection
The benefit depends on data quality, cyber resilience, explainable decisions and measurable reductions in acquisition or claims cost
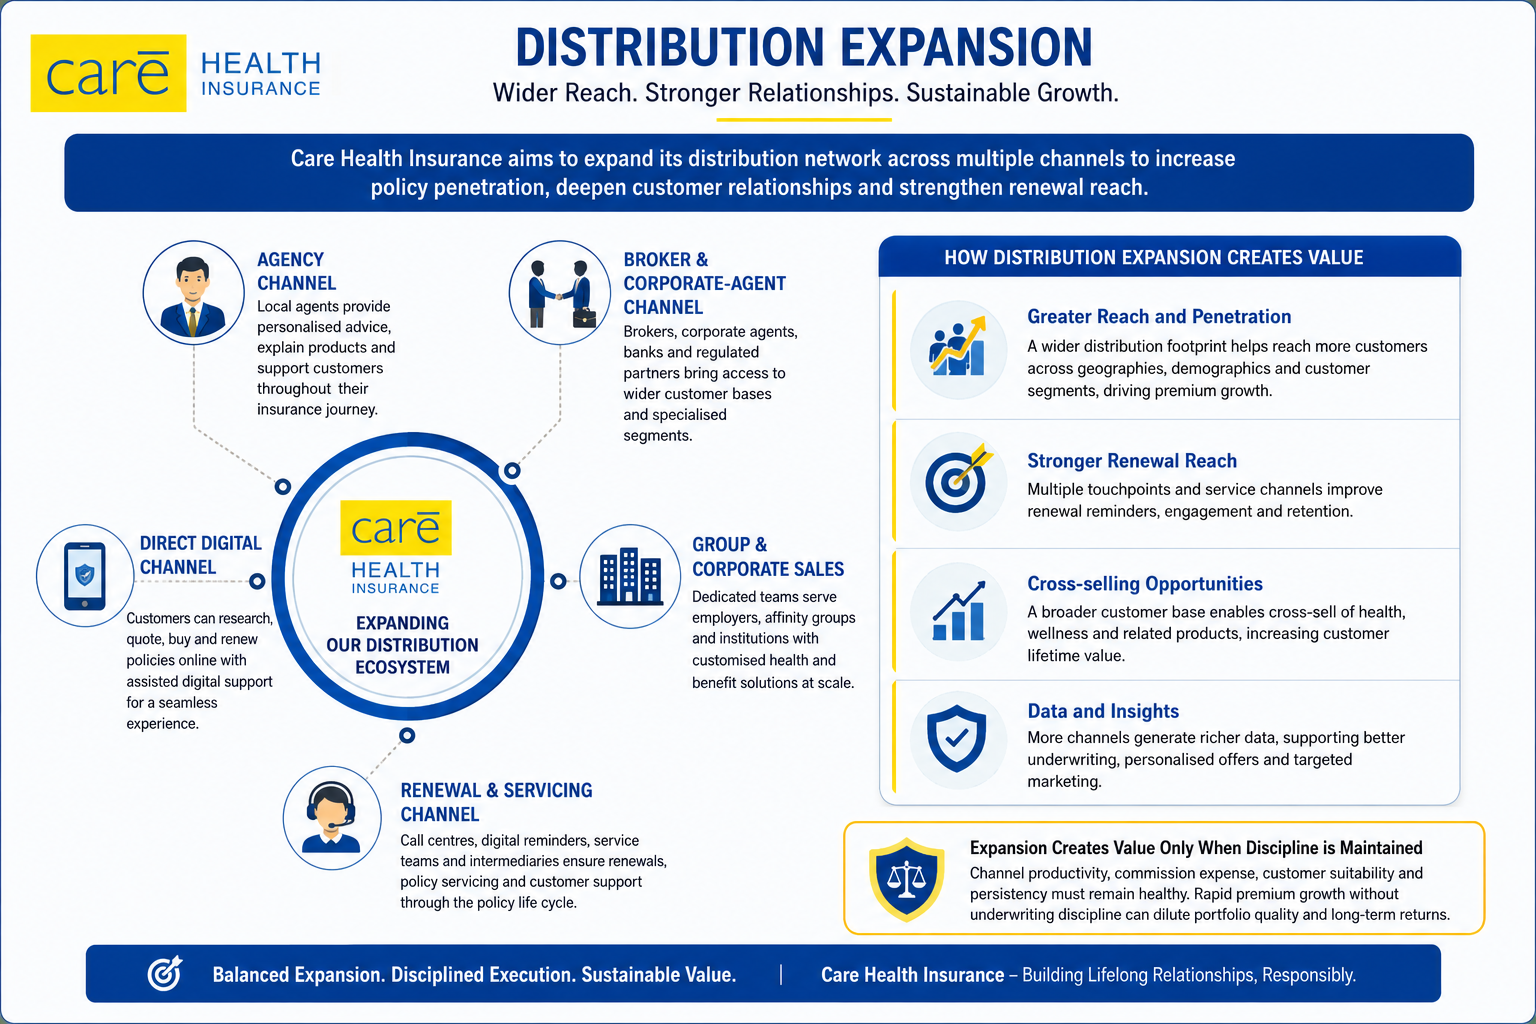
Distribution Expansion
A broader agency, broker, corporate-partner and digital network can increase policy penetration and renewal reach
Expansion creates value only when channel productivity, commission expense, customer suitability and persistency remain healthy, because rapid premium growth can otherwise dilute underwriting quality
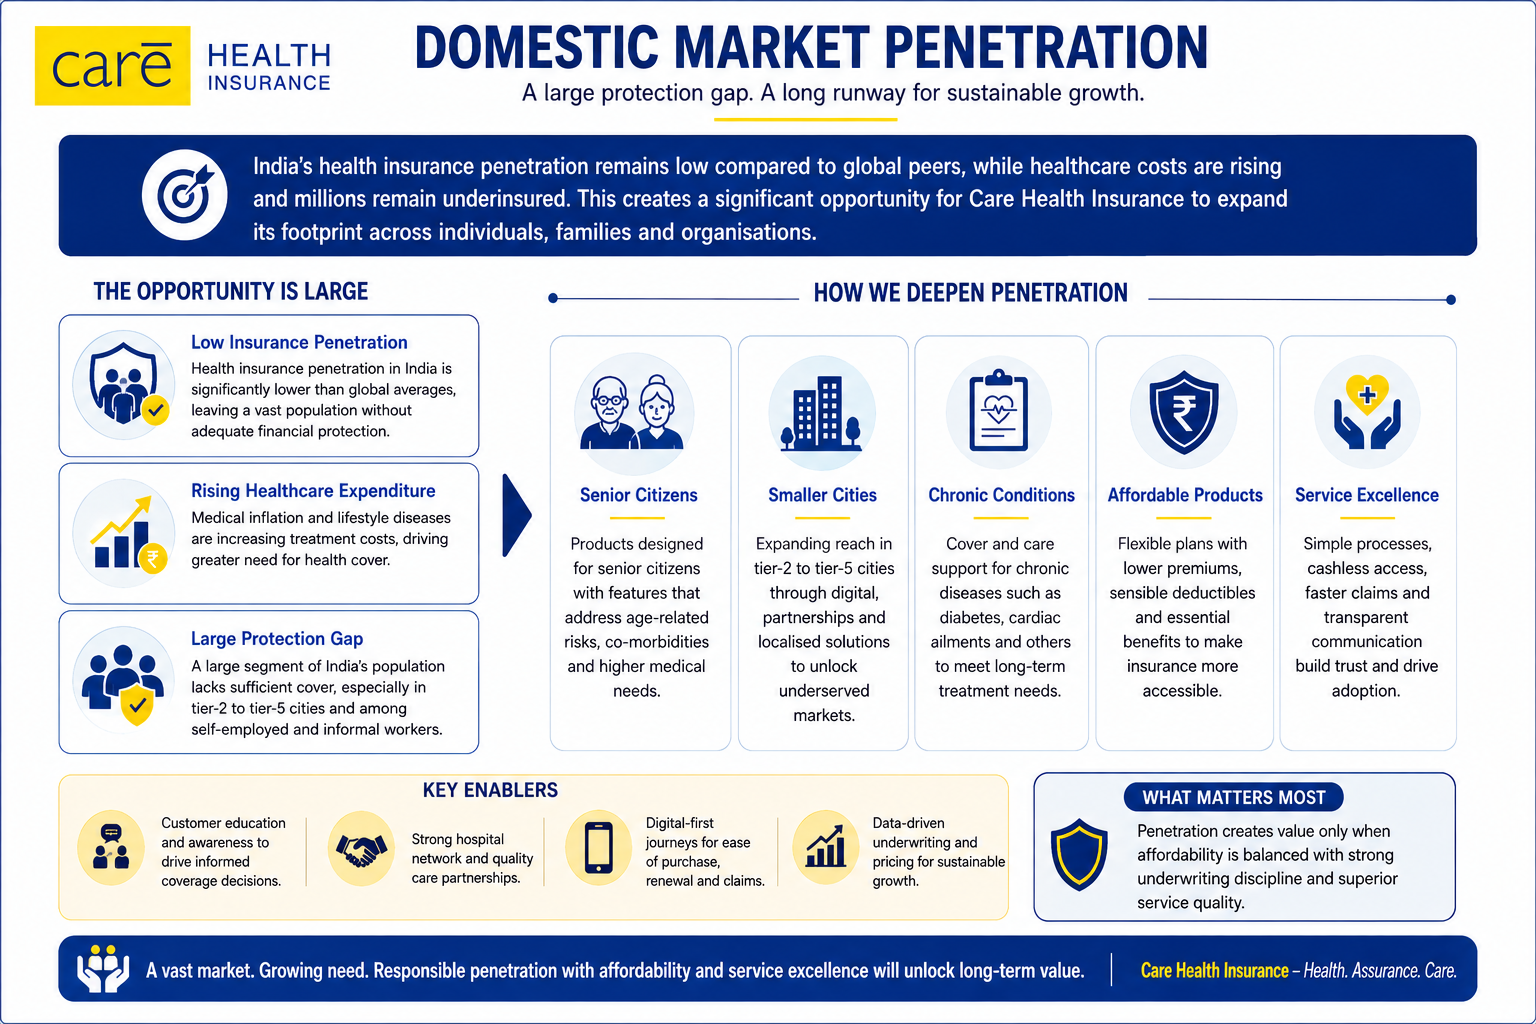
Domestic Market Penetration
Low insurance penetration, rising healthcare expenditure and a large population without adequate cover provide a long runway for retail and group health products
Products tailored for senior citizens, smaller cities, chronic conditions and affordable deductibles can deepen penetration, but affordability and service quality remain critical
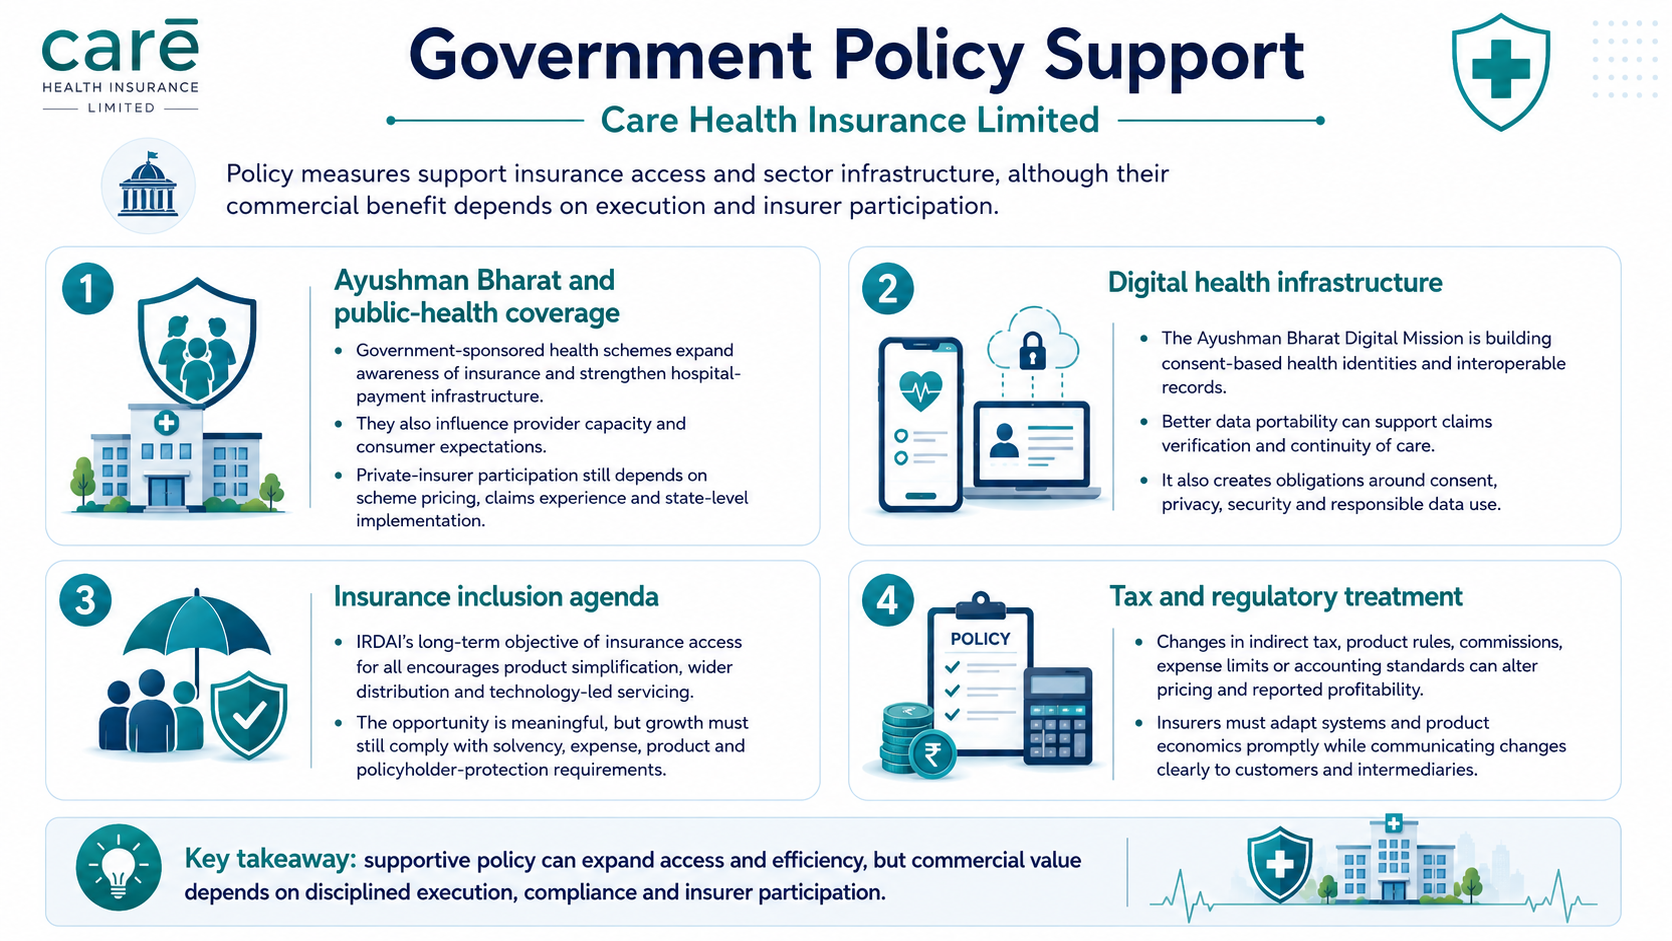
Government Policy Support
Ayushman Bharat and public-health coverage: Government-sponsored health schemes expand awareness of insurance and strengthen hospital-payment infrastructure. They also influence provider capacity and consumer expectations, although private insurer participation depends on scheme pricing, claims experience and state-level implementation
Digital health infrastructure: The Ayushman Bharat Digital Mission is building consent-based health identities and interoperable records. Better data portability can support claims verification and continuity of care, while creating obligations around consent, privacy, security and responsible data use
Insurance inclusion agenda: IRDAI’s long-term objective of insurance access for all encourages product simplification, wider distribution and technology-led servicing. The opportunity is meaningful, but growth must still comply with solvency, expense, product and policyholder-protection requirements
Tax and regulatory treatment: Changes in indirect tax, product rules, commissions, expense limits or accounting standards can alter pricing and reported profitability. Insurers must adapt systems and product economics promptly while communicating changes clearly to customers and intermediaries
- Overview
- Business
- Financial Highlights
- Industry Overview
- Documentation
Get the Preqt App and keep in touch around the clock!
 Monitor your investments in real-time.
- Receive tailored deal suggestions.
- Get real-time updates and alerts.
