

Chennai Super Kings
IPO Review and Rating
Speculative
Overall Recommendation
Revenue increased at a 48.4% FY23-FY25 2-year CAGR, although FY25 revenue declined 3.1% YoY and PAT declined 26.4% to INR 148.3 Cr
FY25 EBITDA margin remained strong at 32.9%, PAT margin at 22.0%, D/E at only 0.02x, ROE at approximately 23.9%, and OCF remained positive at INR 206.3 Cr
The underlying sports economy recorded an 18.6% CAGR, cricket accounts for 89.0% of India's sports economy, and IPL business value reached USD 20.6 Bn in 2026
Management metrics include approximately 50 years of leadership experience, 25.0% Board independence, INR 43.1 Cr of disputed tax demands and RPTs equal to 5.2% of operating revenu
Valuation is the principal constraint, with the Company trading at 65.0x P/E, 42.8x EV/EBITDA, 14.1x P/B and 14.9x P/S; the 42.8x EV/EBITDA represents an approximately 183.4% premium to the selected 15.1x global listed sports-franchise median
PARAMETER
WEIGHT
SCORE
KEY FACTORS
Financial Performance
25.0%
5.0/5
Revenue recorded a 48.4% 2-year CAGR
Show more
Detailed Analysis
Revenue from operations increased from INR 305.9 Cr in FY23 to INR 695.5 Cr in FY24 and INR 673.8 Cr in FY25, representing a 48.4% FY23-FY25 2-year CAGR; FY25 revenue declined 3.1% YoY
FY25 mechanical EBITDA stood at approximately INR 221.9 Cr, translating into a 32.9% EBITDA margin, compared with approximately 41.9% in FY24; EBITDA declined approximately 23.9% YoY
Consolidated PAT stood at INR 148.3 Cr in FY25, compared with INR 201.5 Cr in FY24; PAT margin declined from approximately 29.0% to 22.0%, while PAT declined 26.4% YoY
FY25 borrowings and lease liabilities totalled approximately INR 12.5 Cr against total equity of INR 714.6 Cr, resulting in a D/E ratio of approximately 0.02x
Consolidated operating cash flow remained positive at INR 329.6 Cr in FY24 and INR 206.3 Cr in FY25, although FY25 OCF declined approximately 37.4% YoY
Industry
25.0%
3.1/5
India's sports economy recorded an 18.6% CAGR over 2021-2025, with cricket contributing 89.0% of 2025 revenues
Show more
Detailed Analysis
IPL business value increased 11.4% YoY to USD 20.6 Bn in 2026, marking a second consecutive year of double-digit growth and supporting classification in the Growth stage
Based on 2025 brand values of the 10 IPL franchises, estimated HHI is approximately 1,068, indicating a relatively fragmented competitive structure despite CSK, MI and RCB possessing leading franchise brands
CSK operates under the BCCI-organised IPL franchise structure, while its international expansion also carries league-rights risk
the FY25 report disclosed uncertainty around Texas Super Kings after USA Cricket issued a termination notice to ACE in August 2025
Joburg Super Kings, Super Kings International and Texas Super Kings generated combined FY25 turnover of approximately INR 51.4 Cr, while cricket's global fan base exceeds 2 Bn and the sport returns to the Olympics at LA28
Management
25.0%
3.0/5
Leadership experience exceeds 50 years
Show more
Detailed Analysis
At FY25-end, the Board had approximately 8 Directors, including 2 Independent Directors, Sanjay Shantilal Patel and V. Manickam, resulting in approximately 25.0% independent representation
No promoter-share pledge is disclosed in the reviewed FY25 report, while disputed tax demands stood at approximately INR 43.1 Cr, compared with INR 31.3 Cr in FY24; auditors confirmed pending litigation could affect the Group's financial position
Recurring FY25 RPTs were approximately INR 34.9 Cr, including INR 14.2 Cr services rendered, INR 17.8 Cr interest income and management remuneration, equivalent to approximately 5.2% of FY25 operating revenue
Valuation Metrics
25.0%
2.6/5
The Company is valued at 65.0x P/E, 42.8x EV/EBITDA, 14.1x P/B and 14.9x P/S
Show more
Detailed Analysis
Adjusted enterprise value is approximately INR 9,499.6 Cr against FY25 mechanical EBITDA of INR 221.9 Cr, resulting in 42.8x EV/EBITDA. Selected listed global sports-franchise peers trade at approximately 3.0x-39.8x, with a median of 15.1x
The Company is valued at 14.1x P/B, based on market capitalisation of INR 10,054.8 Cr and FY25 consolidated equity of approximately INR 714.6 Cr
The valuation-derived reference price increased from approximately INR 249.0/share on July 16, 2026 to INR 265.0/share on August 1, 2026, representing an observed range of approximately 6.4%
TOTAL
100%
3.4/5
Weighted Composite Score
Per Share Price
₹255.0
As of 19 Sep 2026
Lot Size
5.0 Shares
Minimum Investment
₹1,27,500.0 / 500 shares
Market Cap. (₹ Cr)
Revenue FY’25
PAT FY’25
P/E Multiple
Face Value
₹ 0.1Lot Size
5.0 sharesSale Type
Primary PAT FY’25
₹ 148.3 CrPAT Margin (%)
22.0 %P/E Multiple
65.0xCAGR Growth 3Y
48.4 %ROE (FY’25)
23.9 %ROCE (FY’25)
29.3 %Price to Book Value ratio
14.1xDebt/Equity (FY’25)
0.0xMerchant banker appointed
❌ NoCompany Website
www.chennaisuperkings.comDisclaimer: Unlisted shares are unregulated & illiquid. This is NOT investment advice. Please do your own due diligence before investing.
Minimum Investment
₹1,27,500.0 / 500 sharesShares Lot 5 X 100
Investment amount
₹1,27,500.0
Overview
Business
Business Model
Geographical Presence
Sales Channel
Financial Highlights
Income Statement
Revenue growth with EBITDA and PAT margins
| Financial Metric | FY 2023 | FY 2024 | FY 2025 |
|---|---|---|---|
| Revenue (₹ Cr) | 305.9 | 695.5 | 673.8 |
| Growth (%) | -10.3% | 127.4% | -3.1% |
| EBITDA (₹ Cr) | 47.5 | 291.5 | 221.9 |
| EBITDA Margin (%) | 15.5% | 41.9% | 32.9% |
| PAT (₹ Cr) | 13.8 | 201.5 | 148.3 |
| PAT Margin (%) | 4.5% | 29.0% | 22.0% |
OBSERVATIONS & INSIGHTS
Consolidated revenue increased from INR 305.9 Cr in FY23 to INR 695.5 Cr in FY24, before moderating by 3.1% to INR 673.8 Cr in FY25.
EBITDA expanded from INR 47.5 Cr in FY23 to INR 291.5 Cr in FY24, then declined to INR 221.9 Cr in FY25; the FY25 EBITDA margin nevertheless remained strong at 32.9%.
PAT fell from INR 201.5 Cr in FY24 to INR 148.3 Cr in FY25, reflecting lower tournament-related income and losses in overseas subsidiaries, while remaining materially above FY23 PAT of INR 13.8 Cr.
Central-rights income represented approximately 73.2% of FY25 revenue from operations, while sponsorship represented approximately 17.3%, indicating meaningful concentration in league and commercial-rights economics.
Balance Sheet
| Financial Metric | FY 2023 | FY 2024 | FY 2025 |
|---|---|---|---|
| EQUITY & LIABILITIES | ₹ 460.7 Cr | ₹ 839.1 Cr | ₹ 1,132.5 Cr |
| Net Worth | ₹ 261.5 Cr | ₹ 528.0 Cr | ₹ 714.6 Cr |
| Share Capital | ₹ 3.1 Cr | ₹ 3.8 Cr | ₹ 3.8 Cr |
| Reserves & Surplus | ₹ 258.4 Cr | ₹ 524.2 Cr | ₹ 710.8 Cr |
| Total Liabilities | ₹ 199.2 Cr | ₹ 311.1 Cr | ₹ 417.9 Cr |
| Current Liabilities | ₹ 194.4 Cr | ₹ 306.5 Cr | ₹ 410.4 Cr |
| Borrowings | ₹ 65.0 Cr | ₹ 0.0 Cr | ₹ 5.1 Cr |
| Trade Payables | ₹ 39.3 Cr | ₹ 8.0 Cr | ₹ 47.7 Cr |
| Other Current Liabilities | ₹ 90.1 Cr | ₹ 298.5 Cr | ₹ 357.6 Cr |
| Non-Current Liabilities | ₹ 4.8 Cr | ₹ 4.6 Cr | ₹ 7.5 Cr |
| Borrowings | ₹ 0.0 Cr | ₹ 0.0 Cr | ₹ 0.0 Cr |
| Other Non-Current Liabilities | ₹ 4.8 Cr | ₹ 4.6 Cr | ₹ 7.5 Cr |
| ASSETS | ₹ 460.7 Cr | ₹ 839.2 Cr | ₹ 1,132.5 Cr |
| Current Assets | ₹ 272.1 Cr | ₹ 571.6 Cr | ₹ 732.4 Cr |
| Trade Receivables | ₹ 6.5 Cr | ₹ 50.2 Cr | ₹ 38.3 Cr |
| Inventory | ₹ 0.0 Cr | ₹ 0.9 Cr | ₹ 1.3 Cr |
| Cash & Cash Equivalents | ₹ 25.5 Cr | ₹ 166.8 Cr | ₹ 336.4 Cr |
| Other Current Assets | ₹ 240.1 Cr | ₹ 353.7 Cr | ₹ 356.4 Cr |
| Non-Current Assets | ₹ 188.6 Cr | ₹ 267.6 Cr | ₹ 400.1 Cr |
| Fixed Assets | ₹ 142.9 Cr | ₹ 207.5 Cr | ₹ 271.9 Cr |
| Other Non-Current Assets | ₹ 45.7 Cr | ₹ 60.1 Cr | ₹ 128.2 Cr |
OBSERVATIONS & INSIGHTS
Total assets increased by 34.9% from INR 839.1 Cr in FY24 to INR 1,132.4 Cr in FY25, driven by higher fixed assets, investments, cash and consolidation of international operations.
Net worth increased from INR 528.0 Cr to INR 714.6 Cr, providing a stronger equity base for global franchise and infrastructure investments.
Cash and bank balances doubled from INR 166.8 Cr in FY24 to INR 336.4 Cr in FY25, strengthening liquidity.
Trade receivables declined by 23.7% to INR 38.3 Cr, while trade payables increased to INR 47.7 Cr.
Other current liabilities increased to INR 357.6 Cr and represented 85.6% of total liabilities; the underlying tournament-related and other obligations require periodic review.
Non-current assets increased to INR 400.1 Cr, including investments, CWIP, goodwill, intangibles and other non-current items associated with expansion.
Cash Flow
| Financial Metric | FY 2023 | FY 2024 | FY 2025 |
|---|---|---|---|
CFO (₹ Cr) Cash generated from core business operations. | +95.0 Cr | +329.6 Cr | +206.3 Cr |
CFI (₹ Cr) Cash used for investments and long-term assets. | -195.1 Cr | -180.8 Cr | -74.6 Cr |
CFF (₹ Cr) Cash flow related to funding and borrowings. | -9.8 Cr | -7.6 Cr | +37.9 Cr |
Working Capital
| Efficiency Metric | FY 2023 | FY 2024 | FY 2025 |
|---|---|---|---|
Debtor Days Average number of days taken to collect customer payments. | - | - | - |
Creditor Days Average time taken to pay suppliers and vendors. | - | - | - |
Inventory Days Average number of days inventory remains unsold. | - | - | - |
CCC (Cash Conversion Cycle) (Debtor Days + Inventory Days - Creditor Days) | - | - | - |
Financial Ratios
Measures the company’s leverage relative to shareholder equity.
OBSERVATIONS & INSIGHTS
ROCE moderated from 53.8% in FY24 to 29.3% in FY25 as the asset base expanded through property, plant and equipment, investments and international franchise consolidation.
ROE decreased from 51.0% in FY24 to 23.9% in FY25, reflecting both lower PAT and a higher average equity base.
Debt/Equity remained 0.0x on a one-decimal basis in FY25, with current borrowings of only INR 5.1 Cr against total equity of INR 714.6 Cr.
Interest coverage improved to 96.9x in FY25 as finance cost reduced to INR 2.2 Cr.
Industry Overview
Industry Drivers
Expansion of Media and Commercial Rights Monetisation
Central rights are the largest revenue stream for the Group. Rising viewership, digital distribution and competitive bidding for premium live-sports rights can support franchise economics, although renewals may introduce volatility.
Key Drivers
Growth in television and digital audiences for live cricket.
Scarcity value of marquee cricket properties.
Long-term league media-rights contracts and central revenue sharing.
Ability to monetise sponsorship inventory across team, player and digital assets.
Brand Strength and Fan Engagement
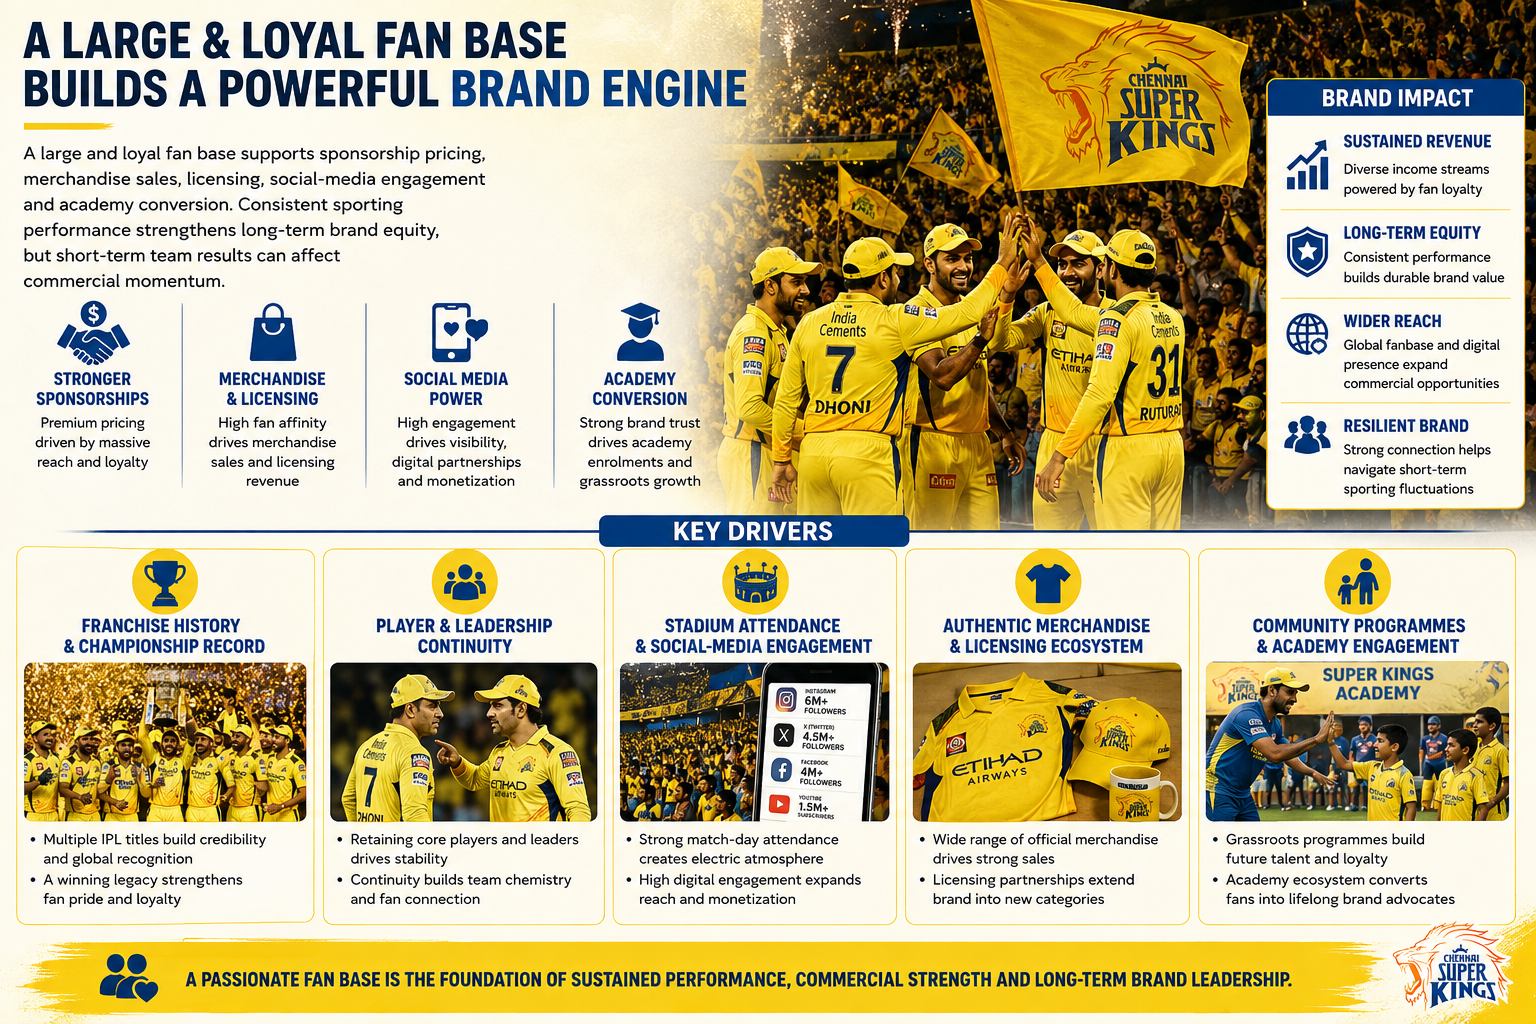
A large and loyal fan base supports sponsorship pricing, merchandise sales, licensing, social-media engagement and academy conversion. Consistent sporting performance strengthens long-term brand equity but short-term team results can affect commercial momentum.
Key Drivers
Franchise history and championship record.
Player and leadership continuity.
Stadium attendance and social-media engagement.
Authentic merchandise and licensing ecosystem.
Community programmes and academy-led grassroots engagement.
Global Franchise Expansion
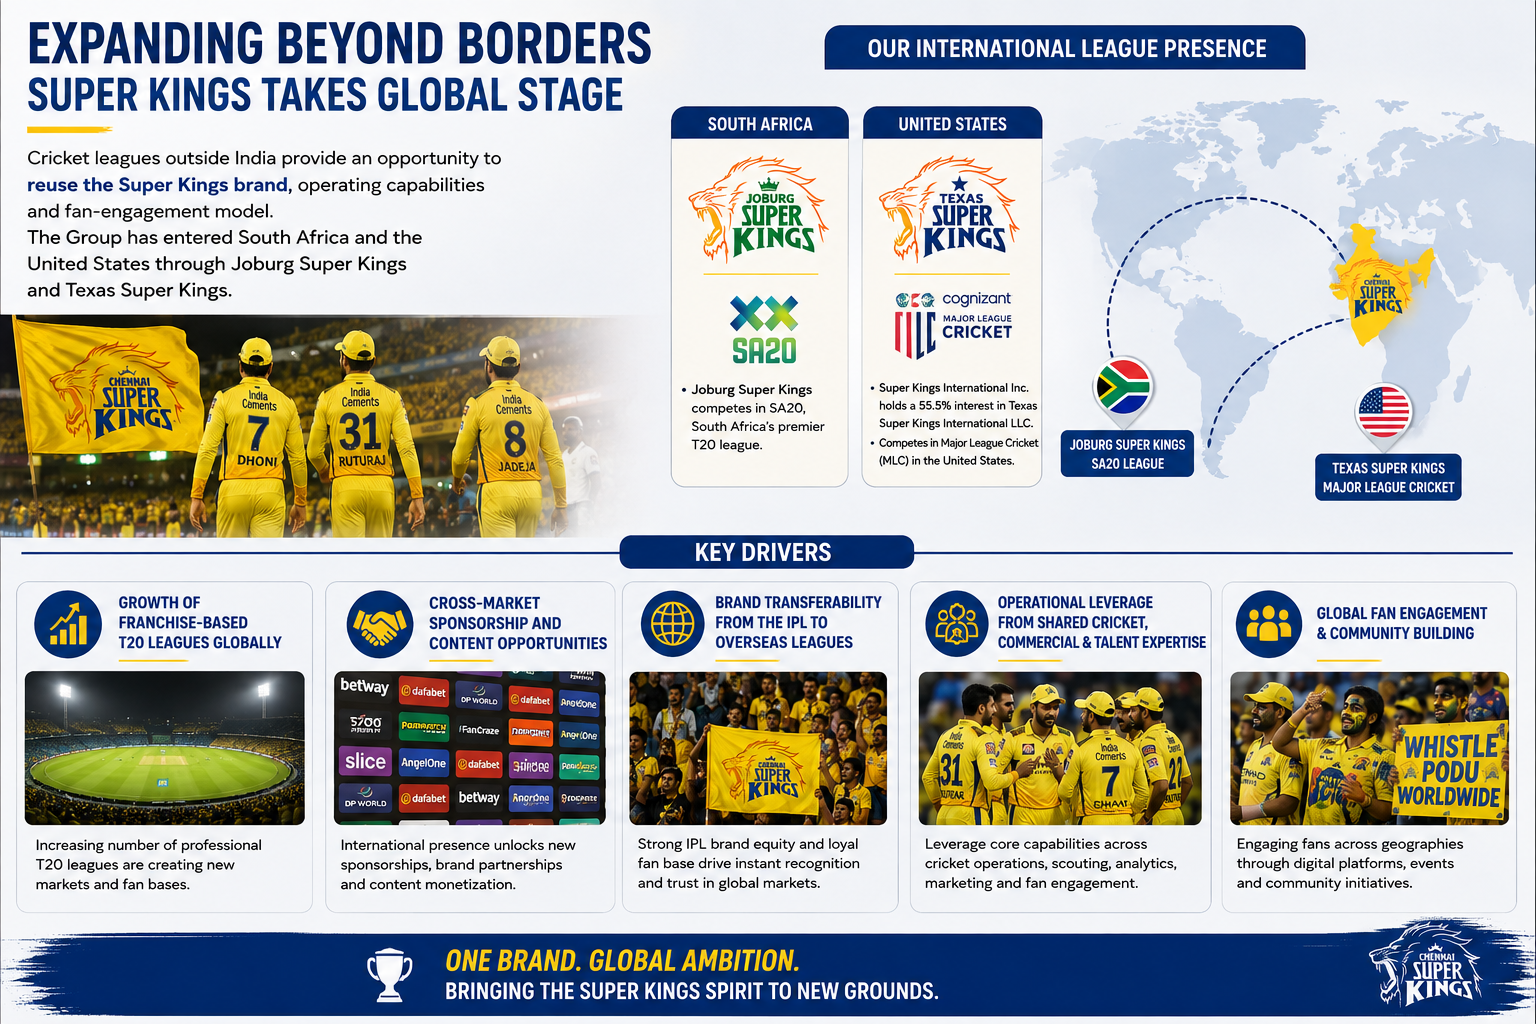
Cricket leagues outside India provide an opportunity to reuse the Super Kings brand, operating capabilities and fan-engagement model. The Group has entered South Africa and the United States through Joburg Super Kings and Texas Super Kings.
Key Drivers
Growth of franchise-based T20 leagues globally.
Cross-market sponsorship and content opportunities.
Brand transferability from the IPL to overseas leagues.
Operational leverage from shared cricket, commercial and talent expertise.
Academy and Sports Infrastructure Monetisation
Academies, high-performance centres and sports infrastructure can create recurring, less tournament-dependent revenue and deepen the talent and fan ecosystem. The Company is also exploring the rental use of selected sports properties and multipurpose facilities.
Key Drivers
Rising demand for structured youth sports training.
Franchise-led trust and parent willingness to pay.
Company-owned and franchise-run academy formats.
Facility utilisation, talent management, licensing and merchandise cross-sell.
Government Policy Support
The Company does not rely on a specifically disclosed government subsidy in the supplied documents. Policy and regulatory support is primarily qualitative and operates through the broader sports, media, digital and infrastructure ecosystem.
Government programmes promoting sports participation and sports infrastructure can expand the addressable market for academies and high-performance centres.
Digital payments, internet penetration and formalisation of media distribution support monetisation of sports audiences and licensed merchandise.
Overseas investment and foreign-exchange regulations enable international franchise investment, subject to compliance with FEMA and local-country rules.
GST, income-tax, broadcasting, advertising, consumer-protection and event regulations influence the cost and compliance structure of franchise operations.
BCCI and league regulations, rather than direct government policy, remain the most important operating framework for the IPL franchise.
- Overview
- Business
- Financial Highlights
- Industry Overview
- Documentation
Get the Preqt App and keep in touch around the clock!
 Monitor your investments in real-time.
- Receive tailored deal suggestions.
- Get real-time updates and alerts.
