


Cochin International Airport Ltd. (CIAL)
Connecting Kerala WorldwideSustainable Aviation Leadership
Unlisted Review Rating
Average
DRHP Not FiledPowering Global Connectivity with Innovation, Efficiency, and Sustainability
CIAL is a high-quality, cash-generative airport asset with strong regional dominance, meaningful international passenger exposure and improving financial leverage. FY25 revenue, PAT and operating cash flow grew by 13.1%, 15.1% and 9.5%, respectively.
PARAMETER
WEIGHT
SCORE
KEY FACTORS
Financial Performance
25.0%
4.0/5
The Company has an attractive financial profile: high margins, strong cash conversion, improving leverage and a return on equity above 20.0%
Show more
Detailed Analysis
Consolidated revenue from operations increased from INR 939.6 Cr in FY23 to INR 1,310.0 Cr in FY25, representing a 2-year CAGR of 18.1%. Revenue grew by 13.1% in FY25, from INR 1,158.4 Cr in FY24
EBITDA increased to approximately INR 880.7 Cr in FY25, calculated using PBT of INR 692.8 Cr, finance costs of INR 42.4 Cr and depreciation of INR 145.4 Cr. The corresponding EBITDA margin was approximately 67.2% of revenue from operations
Consolidated PAT increased from INR 447.8 Cr in FY24 to INR 515.5 Cr in FY25, representing growth of 15.1%. PAT margin improved marginally from 38.7% to 39.4%
Total borrowings declined from INR 585.4 Cr in FY24 to INR 465.1 Cr in FY25. Against total equity of INR 2,665.3 Cr, debt-to-equity improved from 0.2x to 0.2x, based on an unrounded FY25 ratio of 0.17x
Total borrowings declined from INR 585.4 Cr in FY24 to INR 465.1 Cr in FY25. Against total equity of INR 2,665.3 Cr, debt-to-equity improved from 0.2x to 0.2x, based on an unrounded FY25 ratio of 0.17x
Operating cash flow remained positive and increased from INR 592.4 Cr in FY24 to INR 648.6 Cr in FY25, representing growth of 9.5%
Industry
25.0%
3.0/5
The long-term industry outlook is favourable due to rising income, tourism, international connectivity and airport infrastructure investment
Show more
Detailed Analysis
Indian airports handled approximately 412.0 million passengers in FY25, which is projected to increase to 665.0 million by FY31, representing an implied CAGR of approximately 8.3%
India had 164 operational airports in 2025, while passenger traffic continues to grow at a high-single-digit rate
Airport and allied operations are regulated by the Airports Economic Regulatory Authority of India under the Airport Economic Regulatory Act 2008. Aeronautical tariffs, security, environmental approvals and airport operations remain subject to extensive government oversight
Management
25.0%
3.0/5
CIAL benefits from government support, experienced civil-service leadership,CIAL benefits from government support, experienced civil-service leadership, CIAL benefits from government support, experienced civil-service leadership, the main weakness is board independence
Show more
Detailed Analysis
Managing Director S. Suhas IAS had approximately 13.0 years of Indian Administrative Service experience. He was initially appointed to CIAL’s board in June 2021 and was approved for another three-year term effective June 2025
The FY25 board comprised 10.0 directors, of whom 2.0 were identified as independent directors, representing independent participation of 20.0%
Group contingent claims stood at approximately INR 298.1 Cr, including income-tax appeals of INR 145.3 Cr and contractor arbitration claims of INR 67.0 Cr disputed before various courts
Valuation
25.0%
3.0/5
CIAL’s premium valuation partly reflects its regional dominance, strong margins, net-cash position, international passenger exposure and scarcity as an unlisted airport asset
Show more
Detailed Analysis
The Company is valued at a P/E multiple of 42.2x, compared with the airport-industry P/E of 45.0x, representing a discount of 6.2%
CIAL is valued at approximately 23.9x EV/EBITDA. The selected peer median is 11.9x, resulting in a premium of 100.8%
The unlisted share price declined from approximately INR 465.0 in early July 2026 to INR 455.0 by July 13, 2026, before remaining broadly stable through July 27, 2026. The observed price range was approximately 2.2%
TOTAL
100%
3.3/5
Weighted Composite Score
Lot Size
4.0 Shares
Minimum Investment
₹0.0 / 40 shares
Market Cap. (₹ Cr)
Revenue (FY’25)
PAT FY’25 (in Cr)
P/E Multiple
Face Value
₹ 10.0Lot Size
4.0 sharesSale Type
PrimaryPAT FY’25 (in Cr)
₹ 513.2 CrPAT Margin (%)
39.2 %P/E Multiple
43.1xCAGR Growth 3Y
37.6 %ROE (FY’25)
20.5 %ROCE (FY’25)
21.6 %Price to Book Value ratio
8.3xDebt/Equity (FY’25)
0.1xMerchant banker appointed
❌ NoCompany Website
www.cial.aeroDisclaimer: Unlisted shares are unregulated & illiquid. This is NOT investment advice. Please do your own due diligence before investing.
Minimum Investment
₹0.0 / 40 sharesShares Lot 4 X 10
Investment amount
₹0.0
Overview
Business
Business Model
Geographical Presence
Sales Channel
Financial Highlights
Income Statement
Revenue growth with EBITDA and PAT margins
| Financial Metric | FY 2023 | FY 2024 | FY 2025 |
|---|---|---|---|
| Revenue (₹ Cr) | 939.6 | 1,158.4 | 1,309.9 |
| Growth (%) | 87.1% | 23.3% | 13.1% |
| EBITDA (₹ Cr) | 578.2 | 797.6 | 880.6 |
| EBITDA Margin (%) | 61.5% | 68.9% | 67.2% |
| PAT (₹ Cr) | 292.7 | 447.7 | 515.5 |
| PAT Margin (%) | 31.2% | 38.7% | 39.4% |
OBSERVATIONS & INSIGHTS
Revenue increased from ₹939.64 Cr in FY23 to ₹1,309.95 Cr in FY25, supported by recovery in passenger movement, UDF/tariff income and non-aero revenue streams.
EBITDA increased from approximately ₹578.20 Cr in FY23 to ₹880.66 Cr in FY25, reflecting operating leverage in the airport asset model.
PAT increased from ₹292.74 Cr in FY23 to ₹515.54 Cr in FY25 on a consolidated basis.
FY25 passenger movement increased 6.33% and aircraft movement increased 8.36% over FY24.
Balance Sheet
| Financial Metric | FY 2023 | FY 2024 | FY 2025 |
|---|---|---|---|
| EQUITY & LIABILITIES | ₹ 3,430.4 Cr | ₹ 3,573.1 Cr | ₹ 3,841.8 Cr |
| Net Worth | ₹ 2,115.4 Cr | ₹ 2,367.1 Cr | ₹ 2,665.2 Cr |
| Share Capital | ₹ 382.5 Cr | ₹ 478.2 Cr | ₹ 478.2 Cr |
| Reserves & Surplus | ₹ 1,732.9 Cr | ₹ 1,888.9 Cr | ₹ 2,187.0 Cr |
| Total Liabilities | ₹ 1,315.0 Cr | ₹ 1,206.0 Cr | ₹ 1,176.6 Cr |
| Current Liabilities | ₹ 171.9 Cr | ₹ 176.2 Cr | ₹ 188.6 Cr |
| Borrowings | ₹ 113.7 Cr | ₹ 131.7 Cr | ₹ 133.9 Cr |
| Trade Payables | ₹ 58.2 Cr | ₹ 44.5 Cr | ₹ 54.7 Cr |
| Other Current Liabilities | ₹ 0.0 Cr | ₹ 0.0 Cr | ₹ 0.0 Cr |
| Non-Current Liabilities | ₹ 1,143.1 Cr | ₹ 1,029.8 Cr | ₹ 988.0 Cr |
| Borrowings | ₹ 231.7 Cr | ₹ 181.9 Cr | ₹ 241.7 Cr |
| Other Non-Current Liabilities | ₹ 911.4 Cr | ₹ 847.9 Cr | ₹ 746.3 Cr |
| ASSETS | ₹ 3,430.4 Cr | ₹ 3,573.1 Cr | ₹ 3,841.8 Cr |
| Current Assets | ₹ 1,160.9 Cr | ₹ 1,293.1 Cr | ₹ 1,420.9 Cr |
| Trade Receivables | ₹ 100.5 Cr | ₹ 116.5 Cr | ₹ 108.0 Cr |
| Inventory | ₹ 55.3 Cr | ₹ 46.7 Cr | ₹ 65.7 Cr |
| Cash & Cash Equivalents | ₹ 46.0 Cr | ₹ 35.1 Cr | ₹ 81.3 Cr |
| Other Current Assets | ₹ 959.1 Cr | ₹ 1,094.8 Cr | ₹ 1,165.9 Cr |
| Non-Current Assets | ₹ 2,269.5 Cr | ₹ 2,280.0 Cr | ₹ 2,420.9 Cr |
| Fixed Assets | ₹ 2,188.9 Cr | ₹ 2,256.9 Cr | ₹ 2,395.3 Cr |
| Other Non-Current Assets | ₹ 80.6 Cr | ₹ 23.1 Cr | ₹ 25.6 Cr |
OBSERVATIONS & INSIGHTS
Net worth increased from ₹2,115.5 Cr in FY23 to ₹2,665.2 Cr in FY25.
Total borrowings reduced from approximately ₹673.9 Cr in FY23 to ₹465.1 Cr in FY25.
Current assets remain strong due to cash, bank balances and treasury investments.
Fixed assets remain the largest asset block, consistent with an airport infrastructure business.
Trade receivables declined from ₹116.5 Cr in FY24 to ₹108.0 Cr in FY25 despite revenue growth.
Cash Flow
| Financial Metric | FY 2023 | FY 2024 | FY 2025 |
|---|---|---|---|
CFO (₹ Cr) Cash generated from core business operations. | +645.6 Cr | +592.4 Cr | +648.5 Cr |
CFI (₹ Cr) Cash used for investments and long-term assets. | +79.8 Cr | -199.2 Cr | -234.2 Cr |
CFF (₹ Cr) Cash flow related to funding and borrowings. | -94.6 Cr | -393.4 Cr | -368.1 Cr |
Working Capital
| Efficiency Metric | FY 2023 | FY 2024 | FY 2025 |
|---|---|---|---|
Debtor Days Average number of days taken to collect customer payments. | - | - | - |
Creditor Days Average time taken to pay suppliers and vendors. | - | - | - |
Inventory Days Average number of days inventory remains unsold. | - | - | - |
CCC (Cash Conversion Cycle) (Debtor Days + Inventory Days - Creditor Days) | - | - | - |
Financial Ratios
Measures the company’s leverage relative to shareholder equity.
OBSERVATIONS & INSIGHTS
ROCE improved from 14.4% in FY23 to 21.6% in FY25 using the stated methodology.
Debt/equity declined from 0.32x in FY23 to 0.17x in FY25, reflecting deleveraging alongside net worth growth.
Interest coverage improved to 17.3x in FY25, supported by higher earnings and lower finance costs.
Current ratio remained strong at 3.3x in FY25, aided by cash, bank balances and treasury investments.
Industry Overview
Industry Drivers
Passenger Traffic Growth and Connectivity Expansion
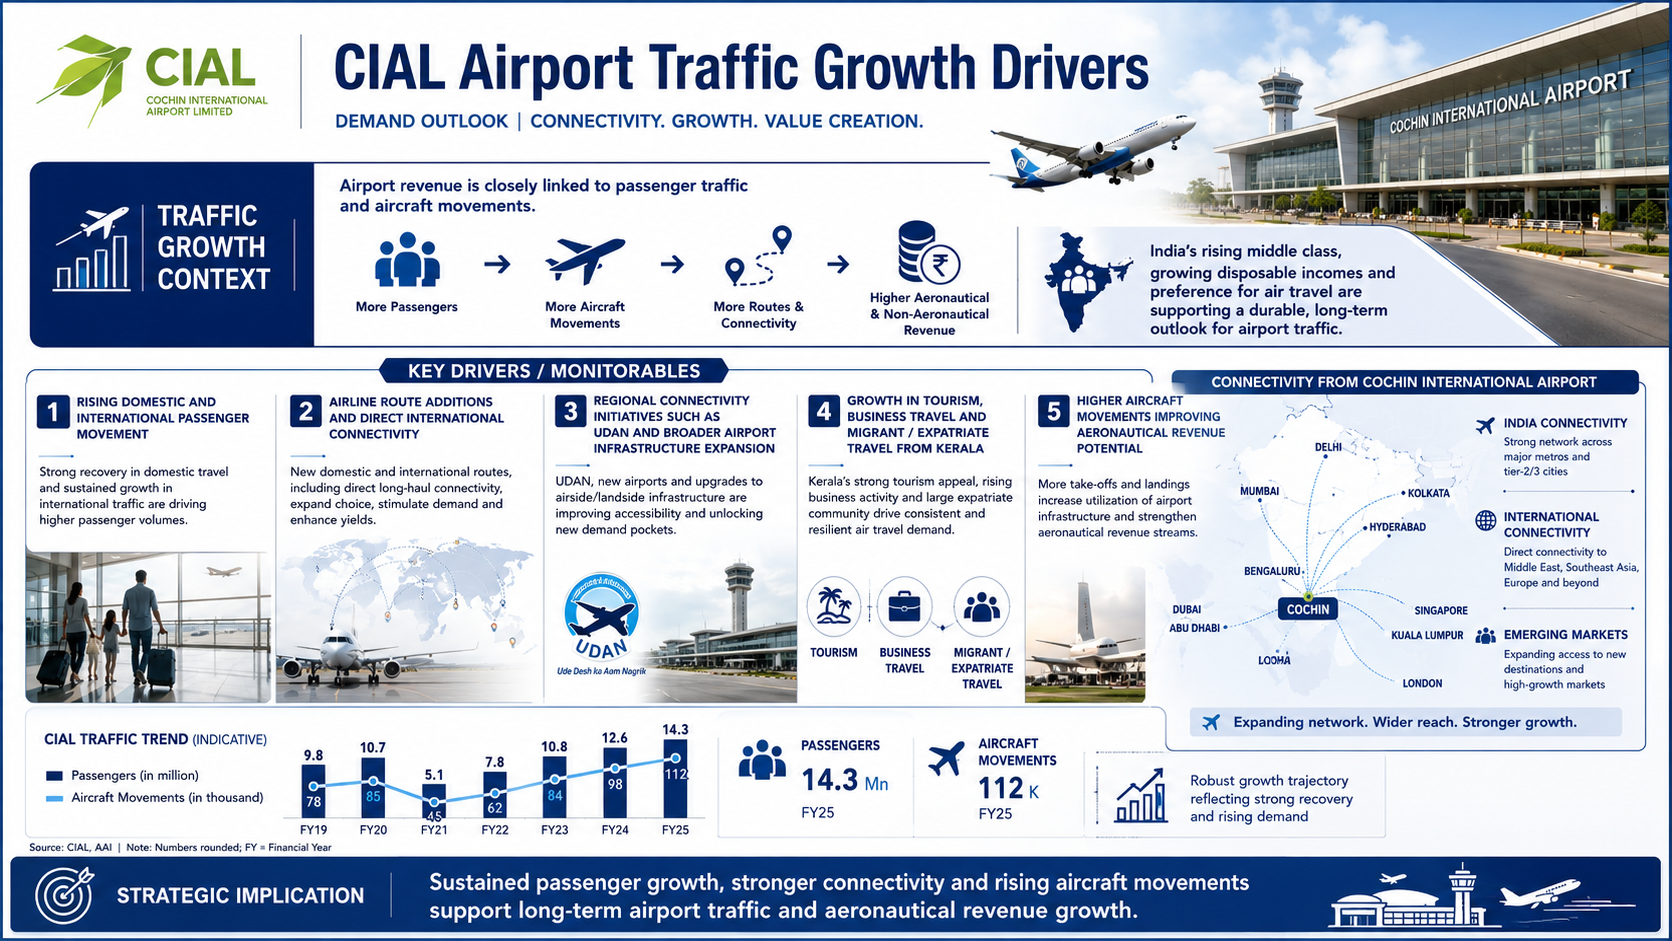
Airport revenue is directly linked to passenger traffic, aircraft movements, airline route additions and the broader recovery in domestic and international air travel. India’s rising middle class, growing disposable incomes and preference for air travel continue to support long-term airport traffic growth.
Key Drivers / Monitorables:
Rising domestic and international passenger movement.
Airline route additions and direct international connectivity.
Regional connectivity initiatives such as UDAN and broader airport infrastructure expansion.
Growth in tourism, business travel and migrant / expatriate travel from Kerala.
Higher aircraft movements improving aeronautical revenue potential.
Non-Aeronautical Monetisation and Commercial Development
Airports are increasingly monetising non-aero sources such as duty-free, retail, food and beverage, parking, hotels, commercial zones, advertising and rental income. These income streams can improve margin stability and reduce dependence on pure aeronautical tariffs.
Key Drivers / Monitorables:
Duty-free and retail monetisation through passenger footfalls.
Commercial zones, hotel / transit accommodation and airport-linked real estate.
Advertising, rentals, concessions and service revenue.
Higher spend per passenger through improved terminal experience.
Subsidiary-led diversification into retail, infrastructure and aviation services.
Cargo, Infrastructure and Operational Efficiency
Cargo, logistics and infrastructure efficiency are important growth levers for airport operators. Better cargo terminals, digital passenger systems, ground handling, terminal expansion and operational efficiency can improve throughput and customer experience.
Key Drivers / Monitorables:
Cargo infrastructure expansion and import / export cargo handling.
Terminal expansion and apron capacity enhancement.
Automation, Digi Yatra, digital check-in and passenger flow improvements.
Ground handling, aviation services and infrastructure subsidiaries.
Operational efficiency and safety systems supporting higher utilisation.
Sustainability, Solar Power and Green Airport Operations
Sustainability has become central to airport infrastructure. Airports are investing in renewable power, energy efficiency, green buildings, water management and lower-emission operations to reduce operating cost and meet stakeholder expectations.
Key Drivers / Monitorables:
Solar power and renewable energy integration.
Green airport recognition and sustainability-linked brand positioning.
Energy cost savings through captive / renewable sources.
Climate-resilient infrastructure and environmentally responsible airport operations.
Growing global preference for airports with stronger ESG credentials.
Risks in the Industry
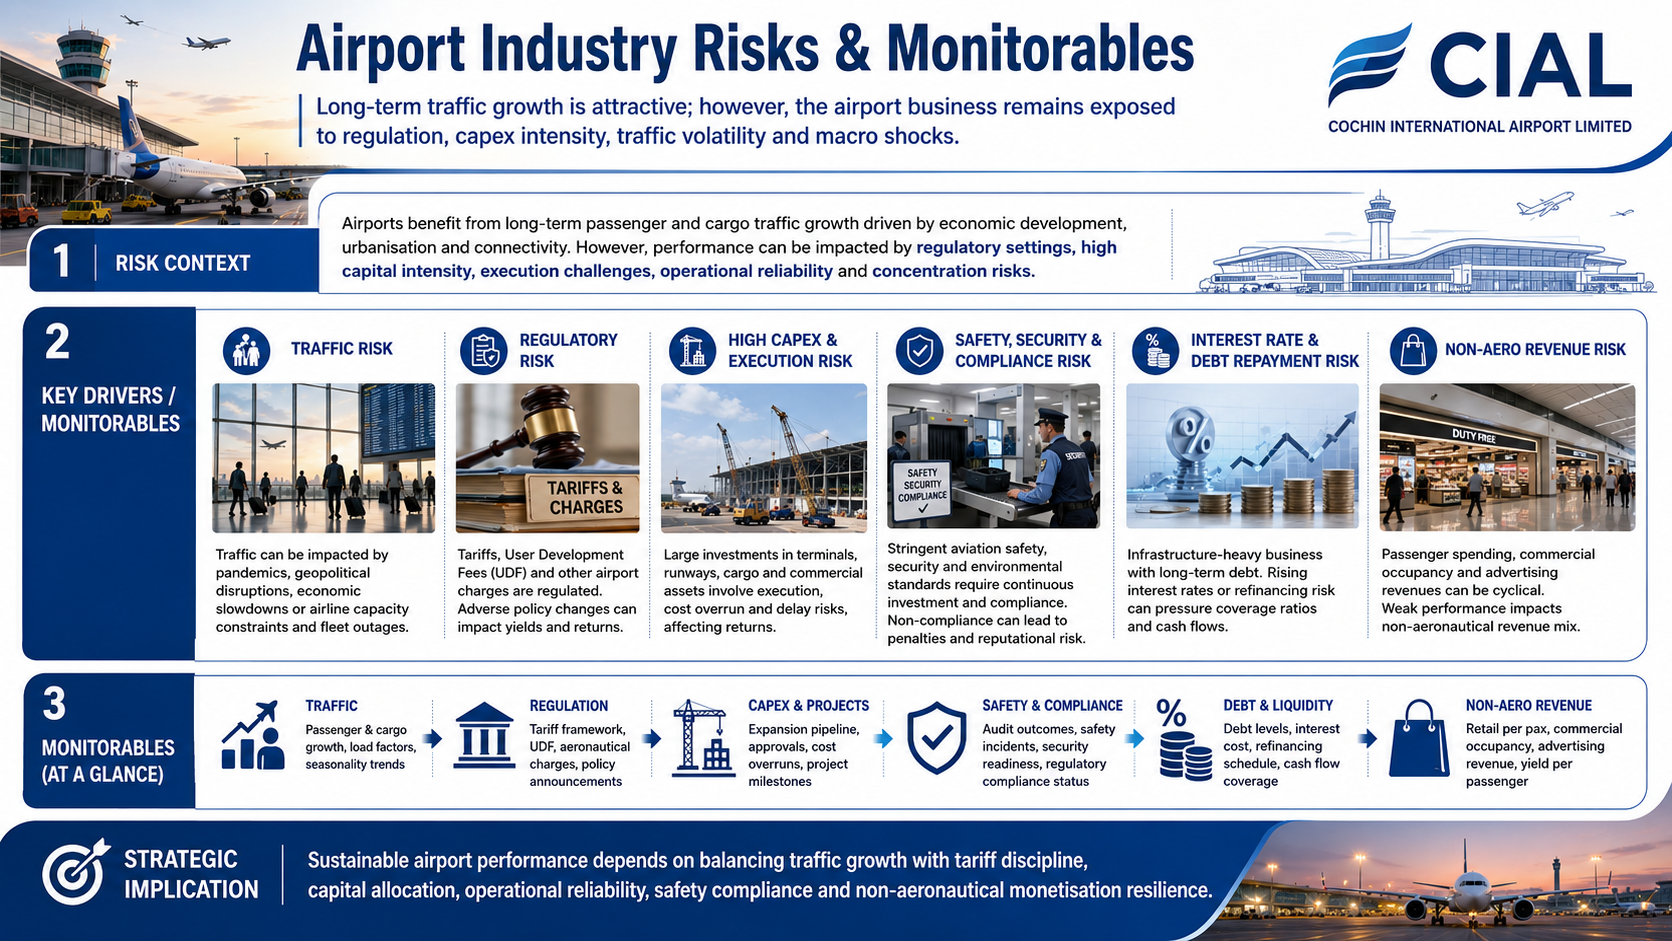
The airport business benefits from long-term traffic growth, but it is exposed to regulation, capex intensity, traffic volatility and macro shocks. Airports must manage tariffs, safety, passenger experience, debt-funded expansion and airline/customer concentration risks.
Key Drivers / Monitorables:
Traffic risk from pandemics, geopolitical disruptions, economic slowdown or airline capacity constraints.
Regulatory risk around tariffs, user development fees and airport charges.
High capex and project execution risk for terminal, cargo and commercial expansions.
Safety, security and compliance risk due to stringent aviation standards.
Interest rate and debt repayment risk for infrastructure-heavy operators.
Non-aero revenue risk if passenger spending or commercial occupancy weakens.
- Overview
- Business
- Financial Highlights
- Industry Overview
- Documentation
Get the Preqt App and keep in touch around the clock!
 Monitor your investments in real-time.
- Receive tailored deal suggestions.
- Get real-time updates and alerts.
