
Dalmia Bharat Refractories Ltd.
Engineering Refractory ExcellenceStrength Beyond Heat
Unlisted Review and Rating
Avoid
DRHP Not FiledOverall Recommendation
Avoid fresh investment at approximately INR 195.0 per share on the available evidence. The investment case rests primarily on realisable asset value and a successful operating turnaround. FY26 revenue growth of 132.2% is encouraging, but operating EBITDA of negative INR 124.5 Cr., net loss of INR 267.0 Cr. and operating cash outflow of INR 197.7 Cr. show that the expanded business has yet to establish economic viability. Finance costs of INR 100.8 Cr. further constrain recovery.
The 50.5% discount to March 2026 book value merits investigation, but does not by itself establish a margin of safety. Investment-value losses, substantial group-related deployment and continuing cash requirements can erode that discount. Subsequent portfolio disposals may improve financial flexibility, but their benefit depends on how proceeds are deployed and whether debt and operating losses decline. The PrEqt score of 2.3/5.0 therefore reflects substantial execution and capital-allocation risk. A stronger case would require an updated, independently reconciled NAV, evidence of lower debt, materially reduced cash burn and a credible route to positive operating EBITDA.
PARAMETER
WEIGHT
SCORE
KEY FACTORS
Financial Performance
25.0%
2.0/5
Revenue growth reflects a substantial tyre-business ramp-up, but profitability and cash generation deteriorated sharply. Negative operating EBITDA, heavy financing costs and investment-value losses weaken the balance sheet’s apparent strength and make sustained recovery essential
Show more
Detailed Analysis
FY26 revenue increased 132.2%, driven substantially by tyre operations. However, changes in business composition reduce the usefulness of historical growth as evidence of established organic performance
Calculated operating EBITDA, excluding other income and exceptional items, was negative INR 124.5 Cr., implying a negative 46.6% margin
Consolidated net loss widened to INR 267.0 Cr., against INR 55.4 Cr. in FY25. Net loss was approximately equal to annual revenue
Borrowings of INR 952.3 Cr. imply D/E of 0.5x. Book leverage appears moderate, but weak cash generation and investment-backed equity limit comfort
FY26 ROE was approximately negative 12.3%, using loss attributable to owners and average equity attributable to owners
Operating cash outflow increased to INR 197.7 Cr., from INR 24.6 Cr. in FY25, reflecting operating losses and working-capital absorption
Industry
25.0%
3.0/5
The operating sectors offer recurring demand and long-term expansion opportunities. However, intense competition, raw-material volatility and execution requirements limit profitability visibility. Industry demand provides an opportunity, while The Company must still demonstrate commercially viable operations
Show more
Detailed Analysis
Steel, cement, infrastructure and replacement-tyre demand support growth opportunities. However, there is no single defensible industry CAGR covering the current business mix
Refractories and tyres serve established industrial and replacement markets. Demand is recurring, although profitability remains cyclical
Strong incumbent tyre brands, refractory suppliers offering integrated solutions and digital travel platforms create substantial competitive pressure
Mining, environmental, product-quality and tyre-related obligations create compliance exposure. Raw-material availability and energy costs add operating risk
Management
25.0%
3.0/5
Group association, experienced leadership and an independent chairman provide institutional support. However, substantial related-party investments, continuing operating losses and complex restructuring require closer scrutiny of capital allocation, minority-shareholder outcomes and the conversion of assets into distributable value
Show more
Detailed Analysis
Dalmia-group association and experienced professional leadership support institutional capability, but the current turnaround has yet to demonstrate successful execution
Three of six directors were independent at March 2026, representing 50.0% of the board, with an independent chairman
The consolidated audit opinion was unmodified. However, investment valuation, legal claims and mining-related obligations remain material assessment areas. Promoter-share pledge status is not assumed to be nil
Significant investments and transactions involve promoter-group entities, creating capital-allocation and minority-shareholder considerations
Valuation Metrics
25.0%
1.0/5
The book-value discount creates potential asset-value interest, but negative earnings and operating EBITDA provide little operating valuation support. An updated net-asset-value calculation, after portfolio changes, liabilities, taxes and expected cash burn, is essential before treating the discount as attractive
Show more
Detailed Analysis
Loss-making earnings provide no support for an earnings-based valuation
Negative operating EBITDA prevents a meaningful positive operating-multiple comparison
The 50.5% discount to reported book value offers potential asset-value support, but depends on investment realisation, liabilities and future cash burn
TOTAL
100%
2.3/5
Weighted Composite Score
Per Share Price
₹200.9
As of 17 Nov 2026
Lot Size
80.0 Shares
Minimum Investment
₹16,072.0 / 80 shares
Market Cap. (₹ Cr)
Revenue FY’26
PAT FY’26
Face Value
₹ 10.0Lot Size
80.0 sharesSale Type
Secondary SalePAT FY’26
₹ -267.0 CrPAT Margin (%)
-99.9 %CAGR Growth 2Y
51.8 %ROE (FY’26)
-12.3 %Debt/Equity (FY’26)
0.5xMerchant banker appointed
❌ NoCompany Website
www.dalmiabharat.comDisclaimer: Unlisted shares are unregulated & illiquid. This is NOT investment advice. Please do your own due diligence before investing.
Minimum Investment
₹16,072.0 / 80 sharesShares Lot 80 X 1
Investment amount
₹16,072.0
Overview
Business
Business Model
Geographical Presence
Sales Channel
Key Risk Factor
Financial Highlights
Income Statement
Revenue growth with EBITDA and PAT margins
| Financial Metric | FY 2024 | FY 2025 | FY 2026 |
|---|---|---|---|
| Revenue (₹ Cr) | 116.0 | 106.3 | 267.4 |
| Growth (%) | 0.0% | -8.3% | 132.2% |
| EBITDA (₹ Cr) | -27.4 | -20.0 | -124.5 |
| EBITDA Margin (%) | -23.6% | -18.8% | -46.6% |
| PAT (₹ Cr) | 47.1 | -36.7 | -267.0 |
| PAT Margin (%) | 40.6% | -34.5% | -99.9% |
OBSERVATIONS & INSIGHTS
Revenue: Manufactured goods rose INR 9.2 Cr (84.3 to 93.5) but traded goods fell INR 19.3 Cr (31.4 to 12.1, down 61.5%), with services and other operating revenue adding INR 0.5 Cr. The underlying operational reason for the traded-goods decline is not disclosed in the available documents. FY25 restated to FY26: INR 115.2 Cr to INR 267.4 Cr, up INR 152.2 Cr (132.2%). Disclosed Cause: the tyre undertaking began commercial production in May 2025 and contributed INR 149.3 Cr against less than INR 0.1 Cr, with Himadri Clean Energy Limited billed INR 147.6 Cr; management states tyre ramp-up was slower than expected. Refractories rose only INR 1.7 Cr (1.5%) to INR 112.9 Cr, as manufactured refractories fell INR 1.9 Cr (2.0%) and traded refractories rose INR 4.6 Cr (35.1%); travel rose INR 1.2 Cr (30.9%)
EBITDA: Operating EBITDA improved from (INR 27.4 Cr) in FY24 to (INR 20.0 Cr) in FY25 original, a gain of INR 7.4 Cr, margin up 4.8 percentage points from (23.6%) to (18.8%). Calculated Explanation: lower revenue (INR 9.7 Cr) was more than offset by lower materials cost (INR 5.8 Cr) and lower other expenses (INR 10.9 Cr). From FY25 restated ((INR 21.8 Cr), margin (18.9%)) to FY26 ((INR 124.5 Cr), margin (46.6%)) EBITDA worsened by INR 102.8 Cr and margin by 27.7 percentage points: revenue added INR 152.2 Cr but materials cost added INR 127.3 Cr, other expenses INR 121.6 Cr and employee cost INR 6.0 Cr. Percentage growth is not shown because the base is negative. Including other income, EBITDA was INR 35.7 Cr, INR 73.1 Cr, INR 74.4 Cr and (INR 67.5 Cr), so FY26 is the first year in which other income did not cover the operating loss
PAT: FY24 to FY25 (original): PAT of INR 47.1 Cr to (INR 36.7 Cr), a fall of INR 83.7 Cr. Calculated Explanation: operating loss before exceptional items widened INR 34.9 Cr (other income up INR 30.0 Cr was more than offset by finance cost up INR 70.5 Cr), the INR 12.1 Cr exceptional gain did not recur, discontinued profit fell INR 46.2 Cr, and tax improved INR 9.5 Cr. FY25 restated to FY26: (INR 55.4 Cr) to (INR 267.0 Cr), a fall of INR 211.6 Cr: operating EBITDA INR 102.8 Cr, other income INR 39.2 Cr, depreciation INR 0.5 Cr, finance cost INR 4.8 Cr, continuing exceptional INR 18.2 Cr, tax INR 1.0 Cr and discontinued results INR 45.2 Cr
Balance Sheet
| Financial Metric | FY 2024 | FY 2025 | FY 2026 |
|---|---|---|---|
| EQUITY & LIABILITIES | ₹ 3,278.8 Cr | ₹ 3,566.8 Cr | ₹ 3,139.2 Cr |
| Net Worth | ₹ 2,611.7 Cr | ₹ 2,524.8 Cr | ₹ 1,814.5 Cr |
| Share Capital | ₹ 44.2 Cr | ₹ 157.9 Cr | ₹ 45.9 Cr |
| Reserves & Surplus | ₹ 2,567.5 Cr | ₹ 2,366.9 Cr | ₹ 1,768.6 Cr |
| Total Liabilities | ₹ 667.1 Cr | ₹ 1,042.0 Cr | ₹ 1,324.7 Cr |
| Current Liabilities | ₹ 75.4 Cr | ₹ 224.2 Cr | ₹ 395.8 Cr |
| Borrowings | ₹ 0.0 Cr | ₹ 0.0 Cr | ₹ 106.1 Cr |
| Trade Payables | ₹ 31.3 Cr | ₹ 31.2 Cr | ₹ 49.0 Cr |
| Other Current Liabilities | ₹ 44.1 Cr | ₹ 193.0 Cr | ₹ 240.7 Cr |
| Non-Current Liabilities | ₹ 591.7 Cr | ₹ 817.8 Cr | ₹ 928.9 Cr |
| Borrowings | ₹ 576.8 Cr | ₹ 767.3 Cr | ₹ 846.2 Cr |
| Other Non-Current Liabilities | ₹ 14.9 Cr | ₹ 50.5 Cr | ₹ 82.7 Cr |
| ASSETS | ₹ 3,278.8 Cr | ₹ 3,566.6 Cr | ₹ 3,139.0 Cr |
| Current Assets | ₹ 559.5 Cr | ₹ 367.0 Cr | ₹ 374.3 Cr |
| Trade Receivables | ₹ 23.5 Cr | ₹ 21.8 Cr | ₹ 32.5 Cr |
| Inventory | ₹ 28.9 Cr | ₹ 49.0 Cr | ₹ 132.9 Cr |
| Cash & Cash Equivalents | ₹ 231.8 Cr | ₹ 93.2 Cr | ₹ 55.5 Cr |
| Other Current Assets | ₹ 275.3 Cr | ₹ 203.0 Cr | ₹ 153.4 Cr |
| Non-Current Assets | ₹ 2,719.3 Cr | ₹ 3,199.6 Cr | ₹ 2,764.7 Cr |
| Fixed Assets | ₹ 389.6 Cr | ₹ 628.4 Cr | ₹ 524.8 Cr |
| Other Non-Current Assets | ₹ 2,329.7 Cr | ₹ 2,571.2 Cr | ₹ 2,239.9 Cr |
OBSERVATIONS & INSIGHTS
Net worth fell from INR 2,524.7 Cr to INR 1,814.5 Cr in FY26, down INR 710.2 Cr or 28.1%. The Company discloses a net loss of INR 266.2 Cr and an other comprehensive loss of INR 438.8 Cr, of which INR 466.4 Cr is fair value loss on equity instruments. By calculation, the RHI Magnesita India holding explains almost all of the fair value loss: the same 2,70,20,000 shares are carried at INR 337.9 each against INR 507.3, a fall of INR 457.9 Cr. The 16,79,937 shares issued under the Scheme only moved INR 113.7 Cr from suspense into share capital and premium, so equity was unaffected
Borrowings rose from INR 576.8 Cr in FY24 to INR 767.3 Cr in FY25 and INR 952.3 Cr in FY26, and current liabilities rose INR 171.6 Cr in FY26 against cash of only INR 55.5 Cr. The current ratio therefore fell from 7.42x to 1.64x to 0.95x. The FY26 increase is disclosed as INR 270.0 Cr of NCDs issued to Himadri, plus INR 100.0 Cr of term loans moving into current maturities. By calculation, the INR 725.8 Cr raised in FY24 funded investment purchases of INR 692.5 Cr, while the FY26 borrowing is covering cash burn, with operating cash flow at an outflow of INR 197.7 Cr
Working capital absorbed cash in FY26. Inventory rose INR 83.9 Cr to INR 132.9 Cr and receivables rose INR 10.7 Cr, while payables grew only INR 17.8 Cr. The Company discloses that tyre production began in May 2025 and cites lower volumes and limited market stocking. By calculation, raw materials alone rose INR 42.9 Cr and finished goods INR 16.6 Cr, and operating working capital moved from 34.5% to 43.6% of revenue. Days ratios improved only because revenue more than doubled, so this was a real cash outflow and not a release of cash
Other current liabilities went from INR 44.1 Cr in FY24 to INR 193.0 Cr in FY25 (restated) and INR 240.7 Cr in FY26. The FY25 jump is disclosed: the Scheme brought in INR 133.3 Cr of provisions for the Salem mining demand, which the Company keeps even though the Madras High Court set the demand aside on 10 September 2025. The FY26 rise of INR 47.7 Cr is calculated to include a INR 19.6 Cr advance received for sale of land, INR 5.2 Cr of higher customer advances, and warranty and other provisions
About 70% of total assets, INR 2,198.8 Cr, are non-current investments, while fixed assets fell INR 103.6 Cr to INR 524.8 Cr. The Company discloses that INR 78.5 Cr of capital work in progress left the books when the tyre venture was deconsolidated. By calculation, INR 1,540.0 Cr of the investments is quoted and INR 425.0 Cr sits in promoter-group debentures. The covenant to repay loans on disposal of pledged shares limits how freely the quoted holdings can be sold, so book value overstates freely usable value
Cash Flow
| Financial Metric | FY 2024 | FY 2025 | FY 2026 |
|---|---|---|---|
CFO (₹ Cr) Cash generated from core business operations. | -322.6 Cr | -5.2 Cr | -197.7 Cr |
CFI (₹ Cr) Cash used for investments and long-term assets. | -175.5 Cr | -266.1 Cr | -82.6 Cr |
CFF (₹ Cr) Cash flow related to funding and borrowings. | +601.7 Cr | +131.2 Cr | +215.3 Cr |
Working Capital
| Efficiency Metric | FY 2023 | FY 2024 | FY 2025 |
|---|---|---|---|
Debtor Days Average number of days taken to collect customer payments. | - | - | - |
Creditor Days Average time taken to pay suppliers and vendors. | - | - | - |
Inventory Days Average number of days inventory remains unsold. | - | - | - |
CCC (Cash Conversion Cycle) (Debtor Days + Inventory Days - Creditor Days) | - | - | - |
Financial Ratios
Measures the company’s leverage relative to shareholder equity.
OBSERVATIONS & INSIGHTS
ROE moved from 1.8% in FY24 to (1.4%) in FY25 original (down 3.2 percentage points) and from (2.1%) in FY25 restated to (12.3%) in FY26 (down 10.2 percentage points). Calculated Explanation: the numerator swung from INR 47.1 Cr profit to an INR 36.1 Cr loss in the first transition and from an INR 54.9 Cr to an INR 266.2 Cr loss in the second, while average owners' equity fell 6.2% (INR 2,681.7 Cr to INR 2,513.9 Cr) and then 17.4% (INR 2,620.8 Cr to INR 2,164.2 Cr). Owners' equity fell INR 710.3 Cr in FY26: total comprehensive loss of INR 705.0 Cr (INR 466.4 Cr of it fair value losses on equity instruments), dividends of INR 4.4 Cr and other movements of INR 0.9 Cr
ROCE was (1.7%) in FY24, (1.4%) in FY25 original, (1.7%) in FY25 restated (closing-balance basis) and (5.3%) in FY26. Calculated Explanation: FY24 to FY25, operating EBIT improved from (INR 51.7 Cr) to (INR 46.1 Cr) while average capital employed rose 6.7% to INR 3,221.3 Cr, so the ratio improved 0.3 percentage points. FY25 restated to FY26, EBIT fell from (INR 57.7 Cr) to (INR 160.9 Cr) while capital employed fell 9.0% to INR 3,042.9 Cr, so the ratio fell 3.6 percentage points; the bases differ (closing versus average)
ROA moved from 1.4% to (1.1%) (original), then from (1.6%) (restated, closing basis) to (8.0%). Calculated Explanation: PAT fell INR 83.7 Cr and then INR 211.6 Cr while average total assets moved only from INR 3,371.1 Cr to INR 3,297.6 Cr and INR 3,566.6 Cr to INR 3,352.9 Cr. Asset turnover rose from 0.03x to 0.08x in FY26 as revenue grew 132.2%, but remains very low because 70.0% of assets are investments that do not generate revenue
Debt / Equity rose from 0.2x to 0.3x (original) to 0.5x. Gross debt rose INR 190.3 Cr (32.9%) in FY25 and INR 185.5 Cr (24.2%) in FY26, to INR 953.4 Cr, mainly the term loans raised in FY24 and the NCDs issued to Himadri (up INR 270.0 Cr in FY26); total equity fell INR 710.2 Cr (28.1%) in FY26
Interest coverage was (3.7x) in FY24, (0.5x) in FY25 original, (0.6x) restated and (1.6x) in FY26. Calculated Explanation: in FY25 the EBIT loss narrowed by INR 5.6 Cr but finance cost rose 6.1 times, and with a negative EBIT a larger denominator pulls the ratio toward zero without any improvement in cover; FY26 worsened because the EBIT loss tripled to INR 160.9 Cr against finance cost of INR 100.8 Cr
The current ratio fell from 7.42x to 4.04x (original) as current assets dropped INR 248.1 Cr, then from 1.64x (restated) to 0.95x as current liabilities rose INR 171.6 Cr. Disclosed Cause: the management report attributes the lower standalone current ratio to higher current maturities of long-term debt (INR 100.0 Cr in FY26)
Industry Overview
Industry Drivers
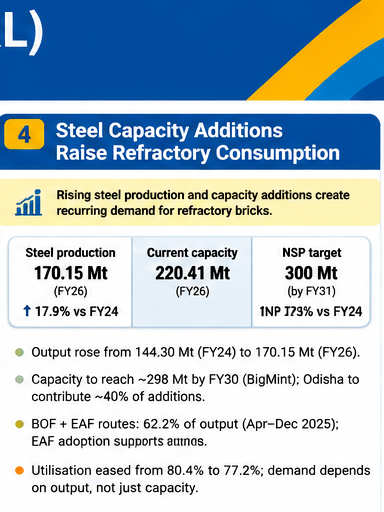
Steel Capacity Additions Raise Refractory Consumption
Refractories line steel-making furnaces, ladles and converters and wear out with every heat, so consumption follows the tonnes of steel produced, adjusted for furnace type. Indian crude steel production rose from 144.30 million tonnes in FY24 to 170.15 million tonnes in FY26, and capacity reached 220.41 million tonnes against the National Steel Policy target of 300 million tonnes by 2030-31. Each new basic-oxygen or electric-arc facility needs initial linings and then regular replacement, so capacity additions create a recurring brick requirement that continues through the furnace life and supports volumes for domestic suppliers
The key drivers are:
Production Growth: Crude steel output rose 17.9% in two years, from 144.30 million tonnes in FY24 to 170.15 million tonnes in FY26. More heats per year raise lining wear and bricks replaced, lifting refractory demand with output
Capacity Pipeline: BigMint projects Indian crude steel capacity of about 298 million tonnes by FY30 from 233 million tonnes in FY26, with Odisha contributing 40% of additions between FY25 and FY30. New eastern capacity creates demand for local suppliers
Furnace Mix: Basic-oxygen and electric-arc routes produced 62.2% of April to December 2025 output (provisional), with induction furnaces at 37.7%. The Company's management ties rising electric-arc adoption to demand for advanced refractory products
Utilisation Check: Utilisation eased from 80.4% to 77.2% while consumption of finished steel grew 7.6% to 163.7 million tonnes in FY26, so near-term brick demand depends on output, not just installed capacity
Replacement Demand Underpins Tyre Volumes
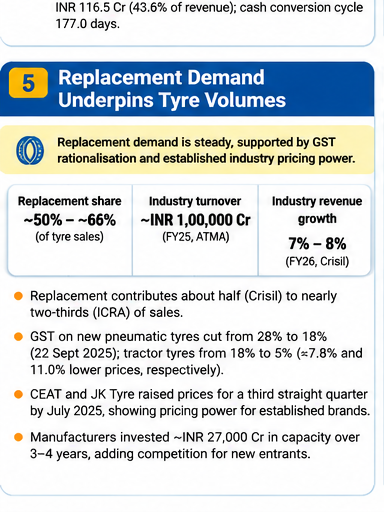
Replacement purchases depend on vehicle age and distance run rather than on new-vehicle launches, so they are steadier than original-equipment demand. Crisil Ratings puts replacement at about half of annual tyre sales and ICRA at nearly two-thirds, depending on the segment weights used. Crisil expected industry revenue to grow 7% to 8% in FY26 on strong replacement demand despite muted original-equipment offtake, and ATMA estimates turnover near INR 1 lakh crore in FY25. A cut in GST on new pneumatic tyres from 28% to 18% in September 2025 lowered the tax-inclusive price paid by buyers
The key drivers are:
Replacement Share: Replacement is about half of sales (Crisil) to nearly two-thirds (ICRA). Because it responds to the ageing vehicle base, it gives established brands recurring volumes that new entrants can win only through dealer access and price
GST Price Effect: From 22 September 2025 GST fell from 28% to 18% on new pneumatic tyres and from 18% to 5% on tractor tyres. At an unchanged pre-tax price (calculated), the consumer price falls 7.8% and 11.0% respectively
Pass-through Evidence: CEAT and JK Tyre raised prices for a third straight quarter by July 2025 to absorb costs while replacement demand held (Business Standard). This shows pricing power for established brands, not for a relaunched brand
Capacity Investment: ATMA reports manufacturers invested about INR 27,000 Cr in greenfield and brownfield capacity over three to four years, which signals expected demand but also adds competing supply for new entrants
Farm and Off-Highway Tyre Exports
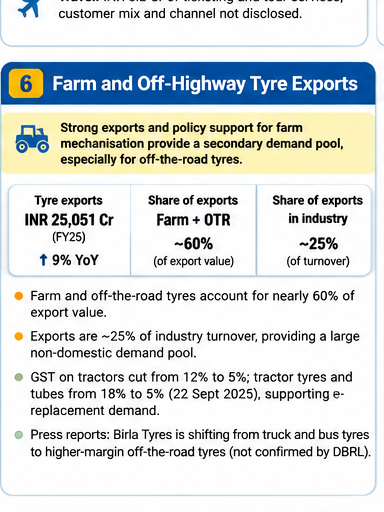
Farm and off-the-road tyres together made up nearly 60% of India's tyre export value, which reached INR 25,051 Cr in FY25, up 9% from INR 23,073 Cr and about a quarter of industry turnover. Exports of this scale give makers of these categories a second demand pool beyond domestic replacement. In September 2025 GST on tractor tyres and tubes was cut from 18% to 5%, lowering the tax cost of farm mechanisation, and GST on tractors fell from 12% to 5%. Press reports say Birla Tyres is moving production from truck and bus tyres towards off-the-road tyres.
The key drivers are:
Export Mix: Farm and off-the-road tyres account for nearly 60% of export value, and exports are about a quarter of the INR 1 lakh crore industry, an unusually high export share for Indian manufacturing
Farm Mechanisation: The 56th GST Council cut tractors from 12% to 5% and tractor tyres and tubes from 18% to 5%, effective 22 September 2025, lowering ownership costs for farmers and supporting replacement tyre demand
Higher-Margin Shift: Himadri's chairman said Birla Tyres is moving from truck and bus tyres to higher-margin off-the-road tyres and targets INR 3,000 Cr of revenue (press, August 2026). DBRL has not disclosed this plan
Industry Risks
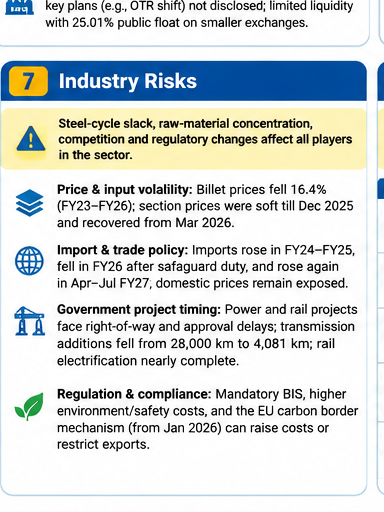
The sector is exposed to steel-cycle slack, concentrated raw materials and shifting customer preferences. India added 40.9 million tonnes of crude steel capacity between FY24 and FY26 while production rose 25.9 million tonnes, leaving utilisation at 77.2%. Magnesite supply is concentrated in China, imports from China set price ceilings, and tyre makers depend on imported natural rubber for about 40% of needs. Tax rulings on minerals add cost uncertainty for miners. The Company's own management discussion lists magnesite, bauxite, graphite, rubber and crude-linked inputs as the main cost risks, together with a customer shift to integrated supply.
The key risks are:
Steel Cycle and Utilisation: Capacity grew from 179.51 to 220.41 million tonnes between FY24 and FY26 against production growth of 25.85 million tonnes, and utilisation fell 3.2 percentage points. Slack reduces furnace relines and gives steel buyers bargaining power over refractory prices
Raw Material Concentration: Magnesite, bauxite and graphite prices and availability affect margins, and magnesite is concentrated in China. The management discussion also notes customers increasingly prefer single-supplier integrated refractory management, which disadvantages narrow product portfolios
Tyre Input Costs and Competition: About 40% of the industry's natural rubber is imported, and 60% of rubber used in India is natural rubber, so crude and rubber price swings affect margins. Established brands with large dealer networks compete on price and availability
Mineral Tax Regulation: On 25 July 2024 the Supreme Court held that royalty is not a tax and that states may levy taxes on minerals from 1 April 2005, with payments in 12 instalments from 1 April 2026, adding cost uncertainty for mining operations
Government Policy Support
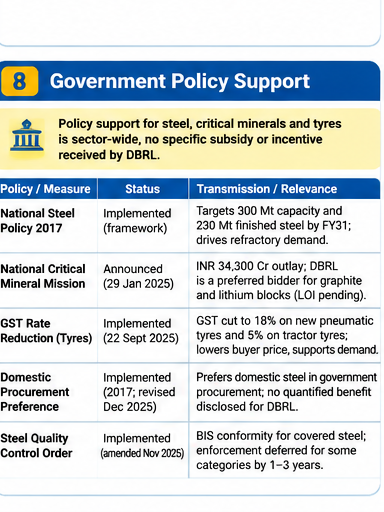
Policy support relevant to the Company comes from steel capacity targets that drive refractory demand, critical-mineral auctions in which it has been named a preferred bidder, and indirect tax changes that affect tyre prices. These are sector-wide measures, and DBRL has not disclosed receiving any subsidy, incentive or concession under them. Where it participates, as in the graphite and lithium block auction, any benefit is contingent on a letter of intent that is still pending. Each item below states the authority, date, status and transmission mechanism, and separates announced targets from implemented measures, so that sector-wide support is not read as a benefit actually received by the Company.
The key drivers are:
National Steel Policy 2017: Issued by the Ministry of Steel in 2017, it targets 300 million tonnes of capacity, 255 million tonnes of production and 160 kg per capita consumption by 2030-31. It is a framework, not a subsidy, acting through refractory demand
National Critical Mineral Mission: Approved 29 January 2025 with an INR 34,300 Cr outlay to 2030-31 (INR 16,300 Cr government). 56 blocks were auctioned by June 2026. DBRL is preferred bidder for graphite and lithium blocks, awaiting a letter of intent; no benefit received
GST Rate Reduction on Tyres: Effective 22 September 2025 after the 56th GST Council meeting, GST on new pneumatic tyres fell from 28% to 18% and on tractor tyres from 18% to 5%. Buyers gain through lower prices; DBRL receives no direct benefit
- Overview
- Business
- Financial Highlights
- Industry Overview
- Documentation
Get the Preqt App and keep in touch around the clock!
 Monitor your investments in real-time.
- Receive tailored deal suggestions.
- Get real-time updates and alerts.