
EAAA India Alternatives
Capital Beyond ConventionInvesting Beyond Traditional Markets
IPO Summary (PrEqT)
EAAA India Alternatives Limited is a multi-strategy alternative asset manager focused on private credit and real assets, with FY26 fee-paying AUM of INR 44,710.4 Cr against total AUM of INR 72,706.3 Cr. FY26 management and advisory fees rose 20.8% to INR 579.1 Cr as fee-paying AUM expanded 32.1%, while variable additional return increased 52.3% to INR 290.5 Cr as more funds qualified under their performance waterfalls. Profit increased to INR 265.2 Cr, although PAT margin on total income declined to 27.5% because employee, fund-raising and finance costs increased. Operating cash flow recovered to INR 235.2 Cr, supported by realisations of variable additional return, following negative flows in FY24 and FY25. At INR 1,665, EAAA has an implied market capitalisation of INR 10,765.1 Cr and a valuation of approximately 40.6x FY26 absolute PAT, which is not inexpensive relative to the heterogeneous public asset-management peer group. The Company's fee-paying AUM franchise and institutional reach seems favourable, however the investment decision requires discipline on performance-linked revenue quality, capital calls, co-investment valuations and the OFS-only structure.
IPO Review Rating
Buy
MainboardInvesting Across Alternatives with Scale, Discipline, and Expertise
EAAA India Alternatives represents a high-quality alternatives asset-management platform, supported by strong revenue growth, expanding EBITDA, approximately INR 44,710.4 Cr FPAUM in FY26, healthy 26.0% RoNW and a leading competitive position in India's rapidly expanding alternatives industry. The company has over 17 years of operating history, significant exposure to private credit and real assets, a diversified domestic and overseas institutional client base, experienced management and a strong BRLM syndicate.
The main concerns are the valuation and IPO structure. At INR 1,665, EAAA is valued at approximately 41.3x FY26 earnings, 35.2x EV/EBITDA and 9.4x June-26 book value. P/E is only marginally above the RHP peer average, but EV/EBITDA and P/B are demanding. The entire INR 1,200.0 Cr IPO is an OFS, while PAT margins have moderated
PARAMETER
WEIGHT
SCORE
KEY FACTORS
Financial Performance
40.0%
5.0/5
EAAA demonstrates strong revenue, EBITDA and PAT growth, healthy return ratios and declining leverage. The key financial concerns are modest PAT-margin compression, a relatively high cost-to-income ratio and inconsistent operating cash generation during FY24 and FY25.
Show more
Detailed Analysis
Revenue from operations increased from INR 492.6 Cr in FY24 to INR 670.3 Cr in FY25 and INR 869.5 Cr in FY26, representing a strong FY24-FY26 CAGR of approximately 32.9%
EBITDA increased from INR 162.9 Cr in FY24 to INR 228.4 Cr in FY25 and INR 313.4 Cr in FY26. EBITDA margin on revenue improved from approximately 33.1% to 36.0%
PAT increased from INR 175.2 Cr in FY24 to INR 229.8 Cr in FY25 and INR 265.2 Cr in FY26. However, PAT margin declined from 30.0% to 27.5% during the same period
Debt/Equity improved consistently from 0.6x in FY24 to 0.5x in FY25 and 0.4x in FY26
ROE remained strong but moderated from 27.3% in FY24 to 27.1% in FY25 and 26.0% in FY26. The level remains healthy despite the slight downward trend
The top 10 clients accounted for 26.2% of FPAUM as of June 2026, comprising family offices, insurers and pension funds across multiple geographies. Concentration is therefore relatively manageable
Industry
15.0%
3.0/5
EAAA operates in one of India's fastest-growing financial-services segments, supported by increasing institutional and HNI allocation to alternatives. Its scale, multi-strategy platform and international LP relationships provide a strong competitive position, although regulation remains significant.
Show more
Detailed Analysis
India's alternatives industry is expected to increase from USD 151.9 Bn in 2025 to approximately USD 267.1 Bn by 2030, implying an estimated 12.0% to 14.0% CAGR
Alternatives remain relatively underpenetrated in India compared with mature markets. Rising HNI wealth, institutional allocations, financialisation and demand for private credit and real assets provide a long structural growth runway
EAAA is identified by CareEdge as one of India's leading alternatives managers and the largest Indian player by AUM in the comparison set, with approximately USD 10.1 Bn AUM
Alternative asset management is heavily dependent on SEBI regulations, taxation rules, foreign-investment regulations and fund-specific compliance. Group entities have also historically been subject to regulatory scrutiny, warranting a deduction
Approximately 41.5% of FY26 AUM came from clients outside India, providing meaningful international LP diversification across pension funds, insurers, institutions and family offices
Management
15.0%
4.0/5
EAAA benefits from experienced leadership, strong Edelweiss sponsorship, 62.5% Board independence and substantial continuing promoter ownership. Governance comfort is partly offset by group-level related-party dependence, regulatory exposure and the fact that the IPO is entirely an OFS.
Show more
Detailed Analysis
EAAA benefits from Edelweiss' long financial-services history and experienced leadership. Rashesh Shah founded Edelweiss, while CEO Amit Agarwal has managed EAAA since 2017 and leads investment, fundraising and growth strategy
Five of the company's eight Directors are Independent Directors, representing 62.5% Board independence, including two women Independent Directors. This provides strong formal governance oversight
Promoter shares are not pledged. However, EAAA itself faces one criminal proceeding, five tax proceedings and one regulatory proceeding with quantifiable exposure of approximately INR 45.1 Cr
EAAA has multiple transactions with Edelweiss Group entities relating to funding, advisory services, insurance, premises, investments and operating arrangements. Most are disclosed and individually manageable, but the broader group dependence remains meaningful
The IPO is entirely an OFS, but ESIPL's stake falls only from 89.6% to approximately 78.4%, while total promoter and promoter-group ownership remains approximately 83.9% post offer
Valuation
20.0%
3.0/5
EAAA's valuation is reasonable on P/E relative to the broader peer set but expensive on EV/EBITDA and P/B. Strong RoNW partly supports the premium, but the 100.0% OFS and zero GMP reduce valuation comfort.
Show more
Detailed Analysis
At INR 1,665, EAAA trades at approximately 40.6x FY26 diluted earnings, versus the RHP peer average of 39.9x. The approximately 3.4% premium is not excessive, but provides limited valuation discount
EAAA trades at approximately 35.2x FY26 EV/EBITDA. Directionally, 360 ONE WAM traded at around 18.1x FY26 EV/EBITDA, meaning EAAA is being offered at nearly a 94% premium on this metric
The cap price represents approximately 9.4x June-26 NAV of INR 176.67/share. Because the IPO is 100.0% OFS, there is no fresh equity infusion to improve post-issue book value
FY26 RoNW of 26.0% is healthy and broadly competitive with several listed asset-management and wealth-management peers, although below the strongest AMC businesses
The IPO is 100.0% OFS
Merchant Banker Track Record
10.0%
4.0/5
Strong merchant banker quality. The syndicate is substantially above average for execution and institutional placement, although the historical aftermarket record is not uniformly strong across all four BRLMs.
Show more
Detailed Analysis
The syndicate has a strong overall aftermarket record. Based on completed 30-day observations, Axis Capital was around 75.0% positive, Jefferies 81.8%, Motilal Oswal 70.7%, and Nuvama 51.7%
The BRLMs have handled multiple institutionally driven Mainboard IPOs, but a consistent comparable three-year subscription dataset was not available across all four bankers. Hence this component should remain pending rather than assumed
Axis, Jefferies and Motilal Oswal have relatively strong records of issues sustaining prices above offer levels. Nuvama's performance is more mixed, reducing the aggregate score slightly
The combination of Axis Capital, Jefferies, Motilal Oswal and Nuvama provides very strong domestic institutional, HNI and international investor distribution capability, particularly relevant for an alternatives asset-management IPO
TOTAL
100%
4.0/5
Weighted Composite Score
Issue Price
₹1585.0 to ₹1665.0
As of 24 Oct 2026
GMP
₹0.0
As of 24 Oct 2026
Estimated Gain / Loss
0.0%
Lot Size
9.0 Shares
Grey Market Premium (GMPs) are shared for knowledge purpose only. PrEqt doesn’t promote or execute the trades.
| Issue Size (in Cr) | |
|---|---|
| Overall | ₹1,200.0 Cr |
| Fresh Issue | ₹0.0 Cr |
| Offer for Sale | ₹1,200.0 Cr |
Minimum Investment
₹14,985.0 / 9 shares

Merchant Banker
Axis Capital Ltd., Jefferies India, Motilal Oswal Investment Advisors, Nuvama Wealth Management
Axis Capital Ltd.
Jefferies India
Motilal Oswal Investment Advisors
Nuvama Wealth Management
IPO Document
Offer Start Date
Offer End Date
Valuation
Revenue (FY'26)
PAT (FY'26)
Issue Size (in Cr)
Face Value
₹ 5.0Lot Size
9.0 sharesSale Type
OFS onlyPAT (FY'26)
₹ 265.2 CrPAT Margin (FY'26)
27.5 %P/E Multiple
40.6xEBITDA (FY'26)
₹ 407.6 CrCAGR Growth 2Y
32.9 %ROE (FY'26)
25.1 %Price to Book Value
9.4xDebt/Equity
0.4xCompany Website
www.eaaa.inExplore new deals
Overview
Fund Allocation
Total: ₹0 CrSource:Company DRHP
Timeline
IPO Open Date
To Be Announced
IPO Close Date
To Be Announced
Tentative Allotment
To Be Announced
Initiation of Refunds
To Be Announced
Credit of Shares to Demat
To Be Announced
Tentative Listing Date
To Be Announced
Business
Business Model
Geographical Presence
Sales Channel
Key Risk Factors
Financial Highlights
Income Statement
Revenue growth with EBITDA and PAT margins
| Financial Metric | FY 2024 | FY 2025 | FY 2026 |
|---|---|---|---|
| Revenue (₹ Cr) | 584.3 | 786.5 | 963.8 |
| Growth (%) | - | 34.6% | 22.5% |
| EBITDA (₹ Cr) | 254.5 | 344.7 | 407.6 |
| EBITDA Margin (%) | 51.7% | 51.4% | 46.9% |
| PAT (₹ Cr) | 175.2 | 229.8 | 265.2 |
| PAT Margin (%) | 30.0% | 29.2% | 27.5% |
OBSERVATIONS & INSIGHTS
Revenue Expanded 34.6% in FY25 and 22.5% in FY26, with the second year slower because FY26 other income declined even as operating revenues rose. Total income combines management fees, performance-related returns and GP investment outcomes. Management and advisory fees Rose from INR 398.0 Cr to INR 479.5 Cr and INR 579.1 Cr as FPAUM expanded from INR 30,398.0 Cr to INR 44,710.4 Cr. FY26 fees grew 20.8%, slower than 32.1% FPAUM growth, illustrating differing fee bases and vintages. Variable additional return Increased 101.7% in FY25 and 52.3% in FY26 because additional eligible funds passed performance thresholds for waterfall recognition. This was the principal growth driver beyond fixed fee income, but carries more NAV and exit timing sensitivity
EBITDA margin on revenue declined from 51.7% in FY24 to 51.4% in FY25 and 46.9% in FY26, as personnel-related and fund-raising costs rose faster than underlying revenue and the performance-fee share expanded
The RHP-defined PAT margin contracted from 30.0% in FY24 to 29.2% in FY25 and 27.5% in FY26 because employee, fund-raising and financing expenses grew alongside fee and waterfall revenues, with a FY26 exceptional labour-code expense and higher tax charge
Balance Sheet
| Financial Metric | FY 2024 | FY 2025 | FY 2026 |
|---|---|---|---|
| Net Worth | ₹ 729.5 Cr | ₹ 966.5 Cr | ₹ 1,075.5 Cr |
| Total Assets | ₹ 1,769.7 Cr | ₹ 2,085.1 Cr | ₹ 2,170.3 Cr |
| Total Borrowing | ₹ 444.8 Cr | ₹ 507.5 Cr | ₹ 441.0 Cr |
| Reserves & Surplus | ₹ 480.6 Cr | ₹ 934.3 Cr | ₹ 1,043.4 Cr |
OBSERVATIONS & INSIGHTS
Total assets increased from INR 1,769.7 Cr in FY24 to INR 2,085.1 Cr in FY25 and INR 2,170.3 Cr in FY26, reflecting expansion in investment, fee receivable and noncurrent asset positions. FY26 growth slowed to 4.1%
Net Worth expanded from INR 729.5 Cr in FY24 to INR 966.5 Cr in FY25 and INR 1,075.5 Cr in FY26 through retained profits and equity changes, offset in part by the FY26 dividend of INR 205.7 Cr.
Borrowings rose from INR 444.8 Cr in FY24 to INR 507.5 Cr in FY25 to support fund-related investment and liquidity needs, then fell to INR 441.0 Cr in FY26 as borrowing and debt-security balances were reduced
Cash Flow
| Financial Metric | FY 2024 | FY 2025 | FY 2026 |
|---|---|---|---|
CFO (₹ Cr) Cash generated from core business operations. | -13.3 Cr | -120.2 Cr | +235.2 Cr |
CFI (₹ Cr) Cash used for investments and long-term assets. | -152.6 Cr | +87.8 Cr | +111.7 Cr |
CFF (₹ Cr) Cash flow related to funding and borrowings. | +178 Cr | +7.6 Cr | -344.1 Cr |
Financial Ratios
Measures the company’s leverage relative to shareholder equity.
OBSERVATIONS & INSIGHTS
ROE declined from 27.3% in FY24 to 27.1% in FY25 and 26.0% in FY26, as the equity base expanded faster than profit on a return-on-average-equity basis
Debt to Equity improved from 0.6x to 0.4x as reported equity increased to INR 1,075.5 Cr while financial borrowings decreased in FY26 to INR 441.0 Cr.
Interest Coverage Ratio was about 6.8x, 6.8x and 7.1x
Current Ratio improved from 1.4x in FY24 to 1.7x in FY25 and 1.7x in FY26 due to the expansion of current asset balances relative to current liabilities
Return on Assets FY25 was 11.9% and FY26 12.5%, as FY26 PAT increased faster than average balance sheet assets
Industry Overview
Industry Drivers
Growth in Private Credit and Real-Asset Strategies
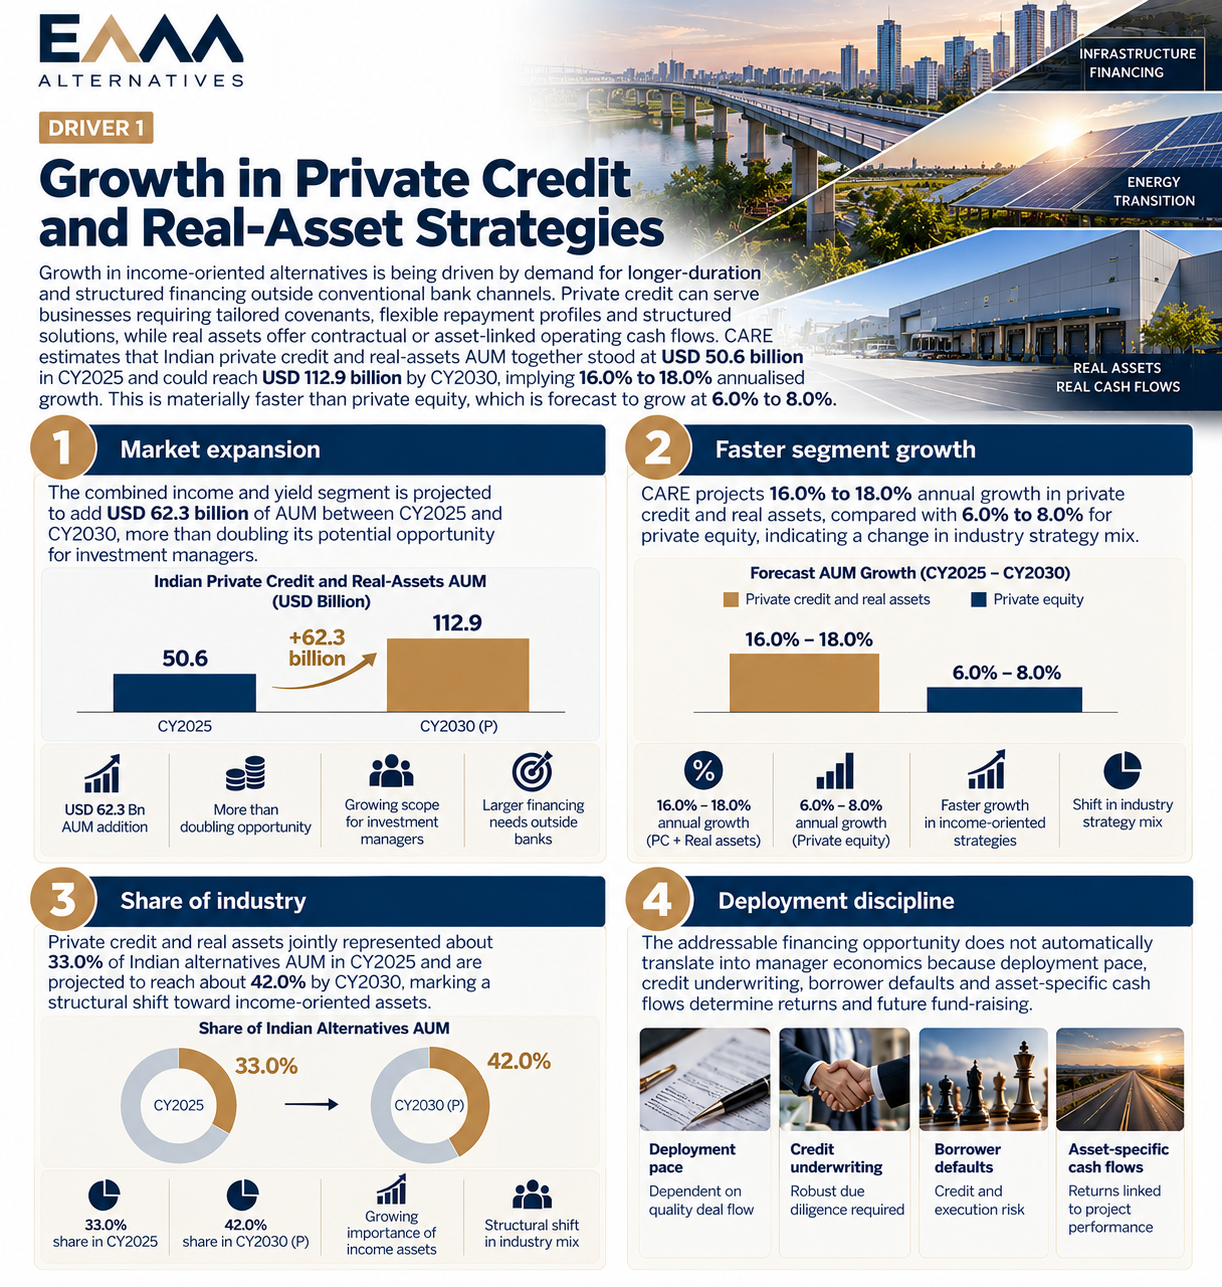
Growth in income-oriented alternatives is being driven by demand for longer-duration and structured financing outside conventional bank channels. Private credit can serve businesses requiring tailored covenants, flexible repayment profiles and structured solutions, while real assets offer contractual or asset-linked operating cash flows. CARE estimates that Indian private credit and real-assets AUM together stood at USD 50.6 billion in CY2025 and could reach USD 112.9 billion by CY2030, implying 16.0% to 18.0% annualised growth. This is materially faster than private equity, which is forecast to grow at 6.0% to 8.0%.
The key drivers are:
Market expansion: The combined income and yield segment is projected to add USD 62.3 billion of AUM between CY2025 and CY2030, more than doubling its potential opportunity for investment managers
Faster segment growth: CARE projects 16.0% to 18.0% annual growth in private credit and real assets, compared with 6.0% to 8.0% for private equity, indicating a change in industry strategy mix
Share of industry: Private credit and real assets jointly represented about 33.0% of Indian alternatives AUM in CY2025 and are projected to reach about 42.0% by CY2030, marking a structural shift toward income-oriented assets
Deployment discipline: The addressable financing opportunity does not automatically translate into manager economics because deployment pace, credit underwriting, borrower defaults and asset-specific cash flows determine returns and future fund-raising
Reallocation of Domestic Institutional Capital
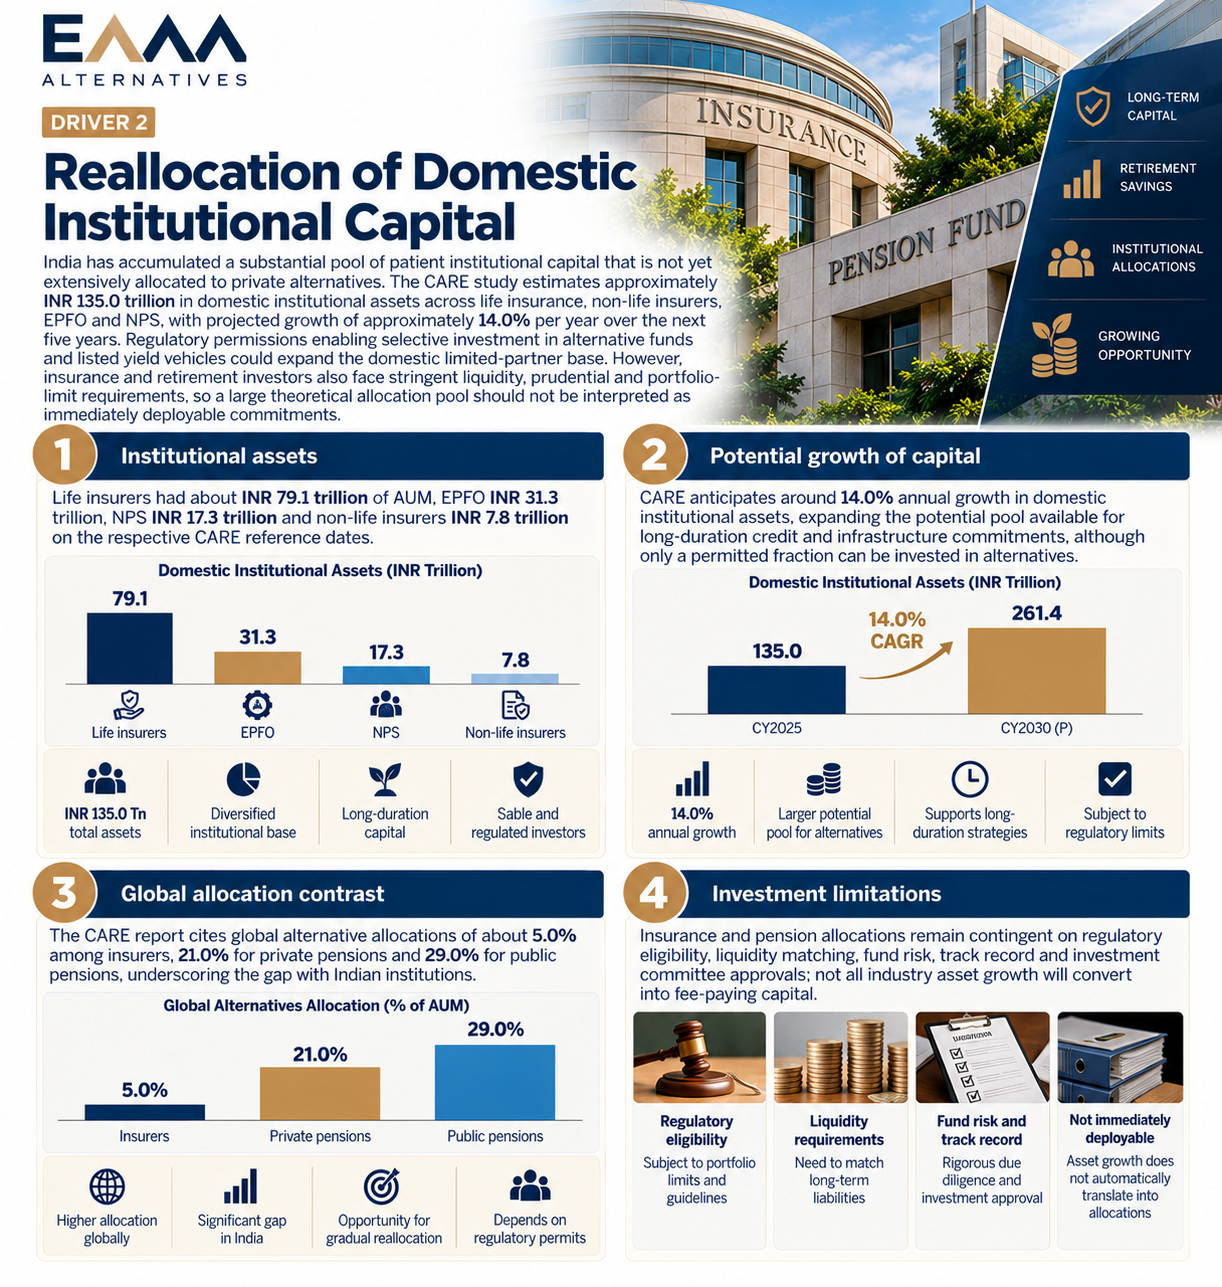
India has accumulated a substantial pool of patient institutional capital that is not yet extensively allocated to private alternatives. The CARE study estimates approximately INR 135.0 trillion in domestic institutional assets across life insurance, non-life insurers, EPFO and NPS, with projected growth of approximately 14.0% per year over the next five years. Regulatory permissions enabling selective investment in alternative funds and listed yield vehicles could expand the domestic limited-partner base. However, insurance and retirement investors also face stringent liquidity, prudential and portfolio-limit requirements, so a large theoretical allocation pool should not be interpreted as immediately deployable commitments.
The key drivers are:
Institutional assets: Life insurers had about INR 79.1 trillion of AUM, EPFO INR 31.3 trillion, NPS INR 17.3 trillion and non-life insurers INR 7.8 trillion on the respective CARE reference dates
Potential growth of capital: CARE anticipates around 14.0% annual growth in domestic institutional assets, expanding the potential pool available for long-duration credit and infrastructure commitments, although only a permitted fraction can be invested in alternatives
Global allocation contrast: The CARE report cites global alternative allocations of about 5.0% among insurers, 21.0% for private pensions and 29.0% for public pensions, underscoring the gap with Indian institutions
Investment limitations: Insurance and pension allocations remain contingent on regulatory eligibility, liquidity matching, fund risk, track record and investment committee approvals; not all industry asset growth will convert into fee-paying capital
Financialisation and International Investor Interest
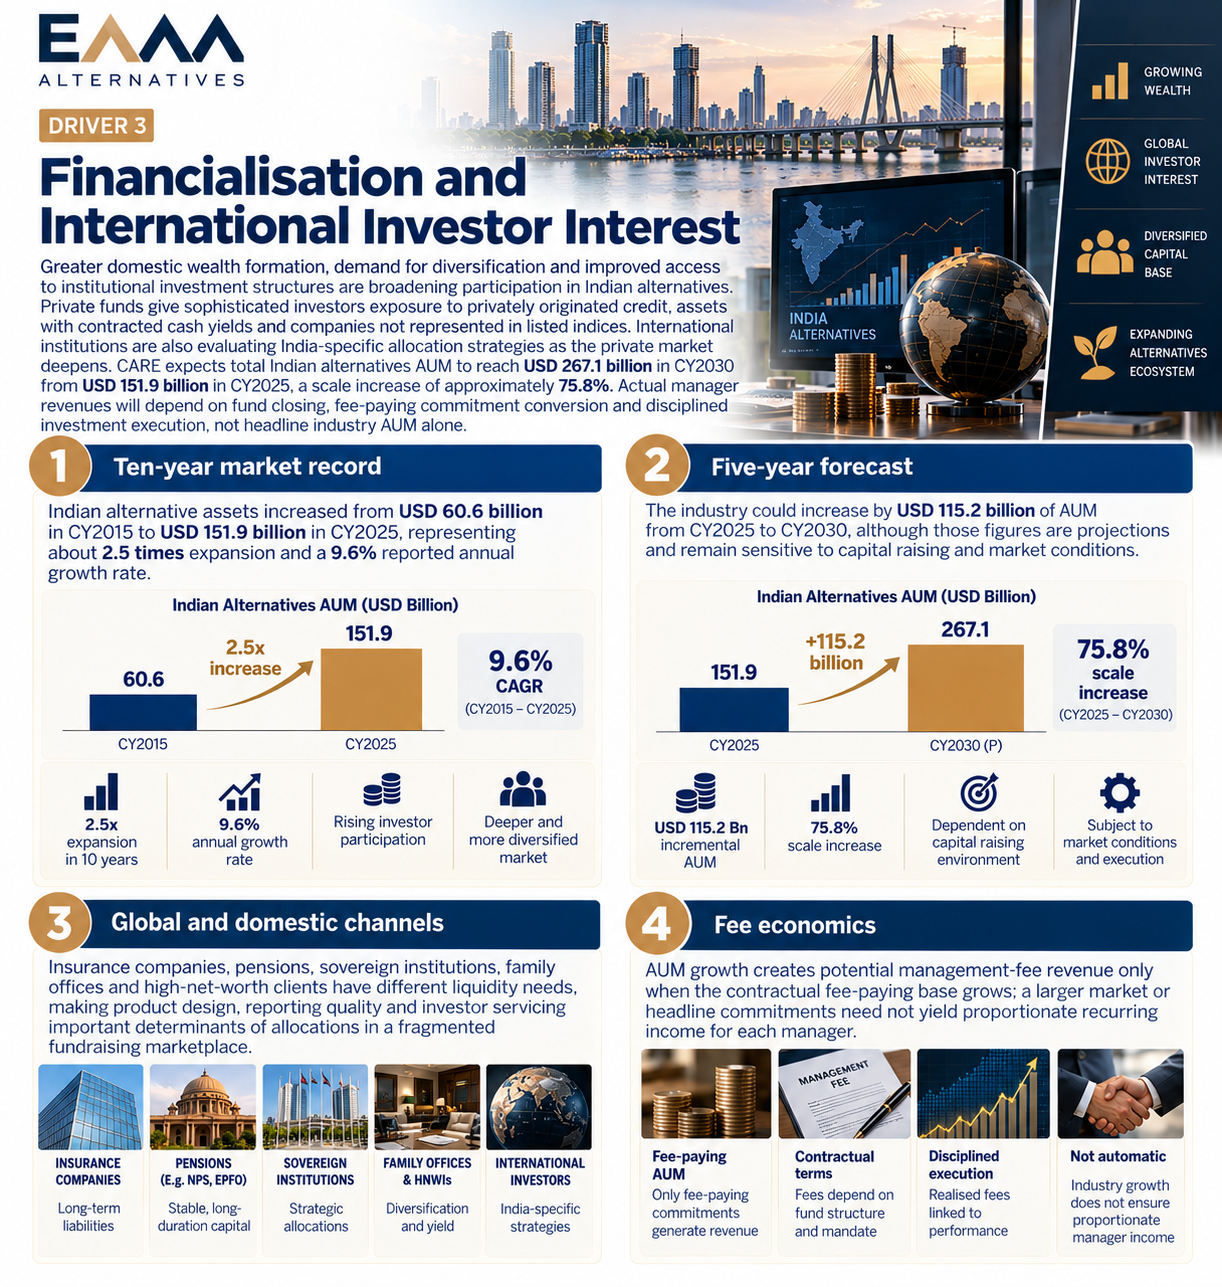
Greater domestic wealth formation, demand for diversification and improved access to institutional investment structures are broadening participation in Indian alternatives. Private funds give sophisticated investors exposure to privately originated credit, assets with contracted cash yields and companies not represented in listed indices. International institutions are also evaluating India-specific allocation strategies as the private market deepens. CARE expects total Indian alternatives AUM to reach USD 267.1 billion in CY2030 from USD 151.9 billion in CY2025, a scale increase of approximately 75.8%. Actual manager revenues will depend on fund closing, fee-paying commitment conversion and disciplined investment execution, not headline industry AUM alone.
The key drivers are:
Ten-year market record: Indian alternative assets increased from USD 60.6 billion in CY2015 to USD 151.9 billion in CY2025, representing about 2.5 times expansion and a 9.6% reported annual growth rate
Five-year forecast: The industry could increase by USD 115.2 billion of AUM from CY2025 to CY2030, although those figures are projections and remain sensitive to capital raising and market conditions
Global and domestic channels: Insurance companies, pensions, sovereign institutions, family offices and high-net-worth clients have different liquidity needs, making product design, reporting quality and investor servicing important determinants of allocations in a fragmented fundraising marketplace
Fee economics: AUM growth creates potential management-fee revenue only when the contractual fee-paying base grows; a larger market or headline commitments need not yield proportionate recurring income for each manager
Risks in the Industry
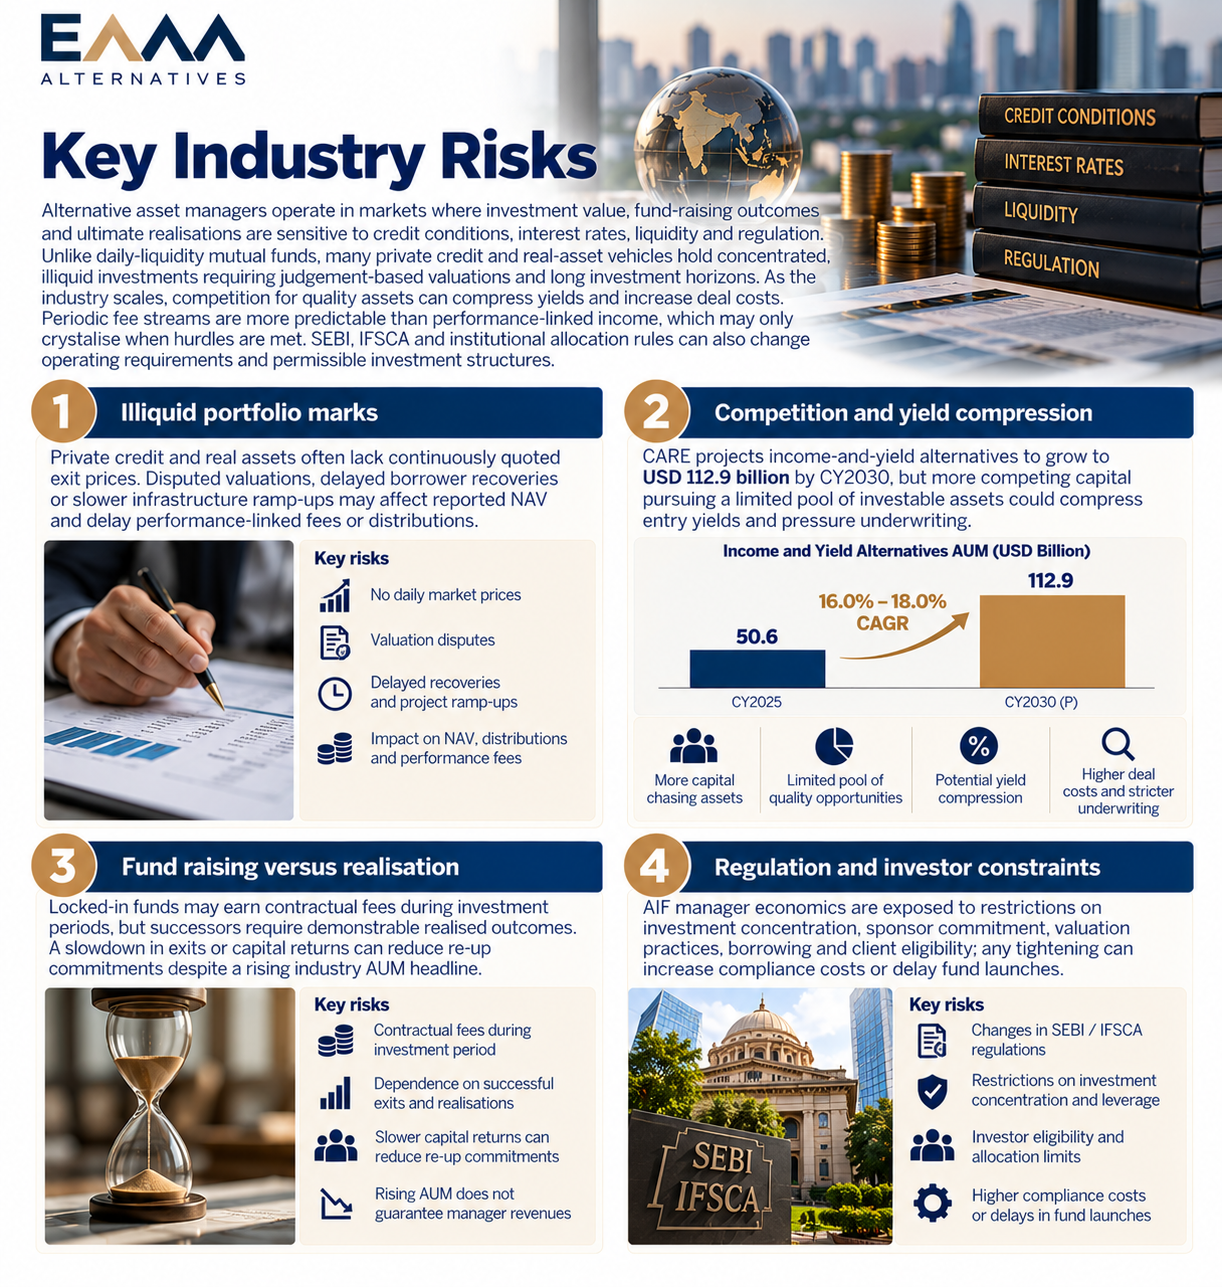
Alternative asset managers operate in markets where investment value, fund-raising outcomes and ultimate realisations are sensitive to credit conditions, interest rates, liquidity and regulation. Unlike daily-liquidity mutual funds, many private credit and real-asset vehicles hold concentrated, illiquid investments requiring judgement-based valuations and long investment horizons. As the industry scales, competition for quality assets can compress yields and increase deal costs. Periodic fee streams are more predictable than performance-linked income, which may only crystallise when hurdles are met. SEBI, IFSCA and institutional allocation rules can also change operating requirements and permissible investment structures.
The key risks are:
Illiquid portfolio marks: Private credit and real assets often lack continuously quoted exit prices. Disputed valuations, delayed borrower recoveries or slower infrastructure ramp-ups may affect reported NAV and delay performance-linked fees or distributions
Competition and yield compression: CARE projects income-and-yield alternatives to grow to USD 112.9 billion by CY2030, but more competing capital pursuing a limited pool of investable assets could compress entry yields and pressure underwriting
Fund raising versus realisation: Locked-in funds may earn contractual fees during investment periods, but successors require demonstrable realised outcomes. A slowdown in exits or capital returns can reduce re-up commitments despite a rising industry AUM headline
Regulation and investor constraints: AIF manager economics are exposed to restrictions on investment concentration, sponsor commitment, valuation practices, borrowing and client eligibility; any tightening can increase compliance costs or delay fund launches
Government Policy Support
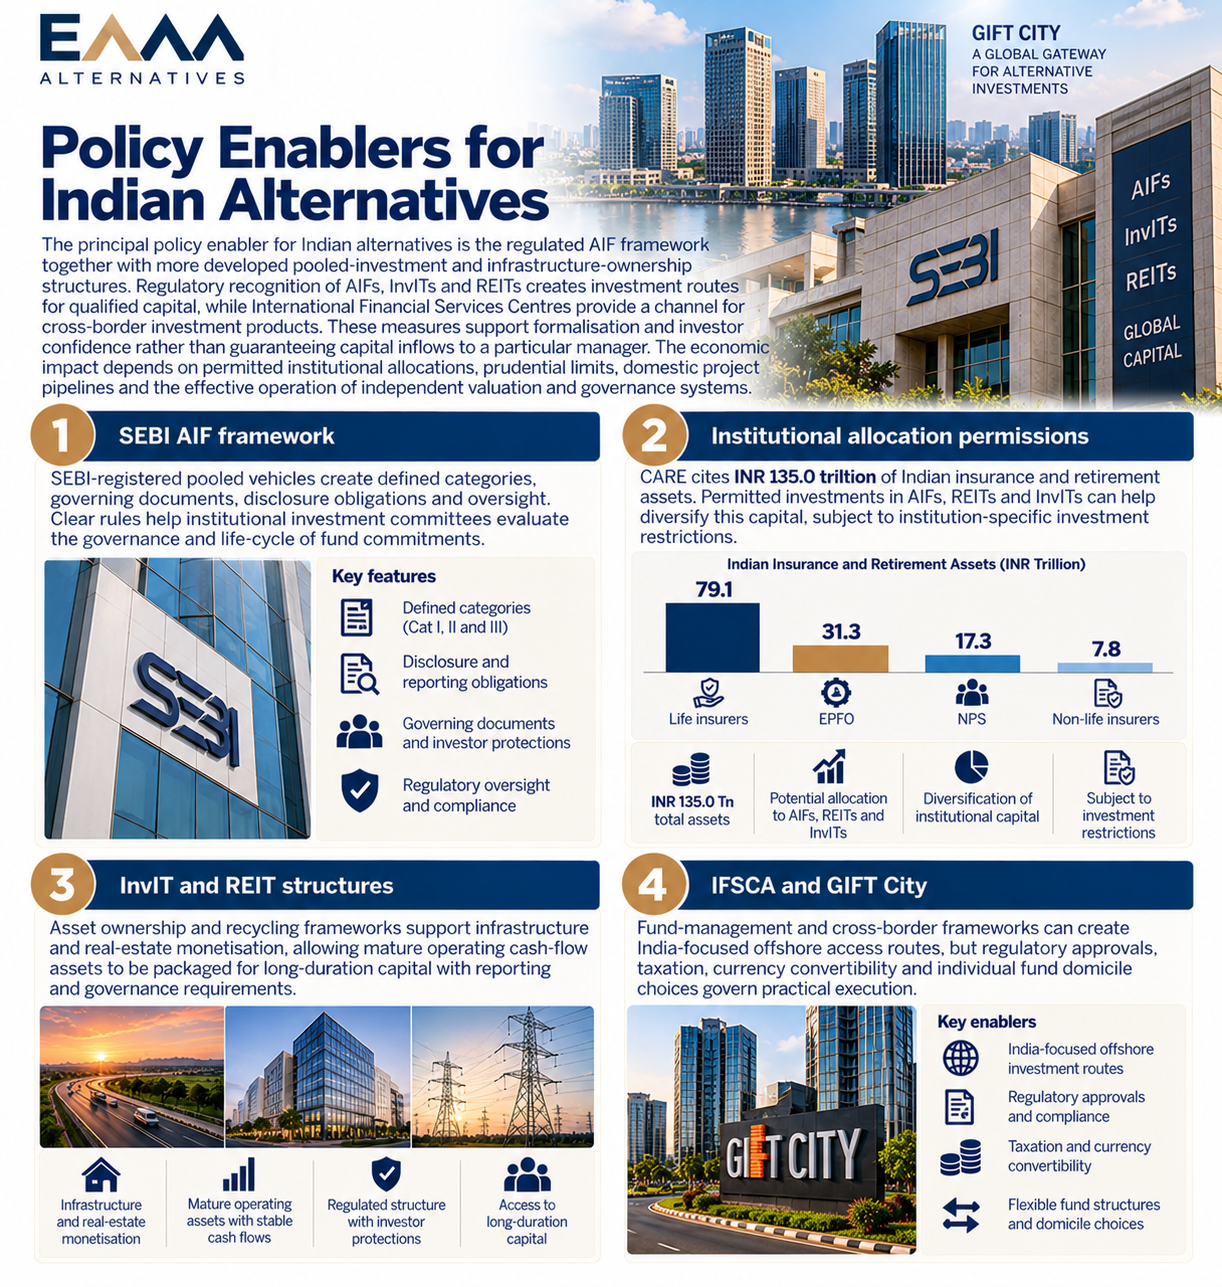
The principal policy enabler for Indian alternatives is the regulated AIF framework together with more developed pooled-investment and infrastructure-ownership structures. Regulatory recognition of AIFs, InvITs and REITs creates investment routes for qualified capital, while International Financial Services Centres provide a channel for cross-border investment products. These measures support formalisation and investor confidence rather than guaranteeing capital inflows to a particular manager. The economic impact depends on permitted institutional allocations, prudential limits, domestic project pipelines and the effective operation of independent valuation and governance systems.
The key policies are:
SEBI AIF framework: SEBI-registered pooled vehicles create defined categories, governing documents, disclosure obligations and oversight. Clear rules help institutional investment committees evaluate the governance and life-cycle of fund commitments.
Institutional allocation permissions: CARE cites INR 135.0 Tn of Indian insurance and retirement assets. Permitted investments in AIFs, REITs and InvITs can help diversify this capital, subject to institution-specific investment restrictions.
InvIT and REIT structures: Asset ownership and recycling frameworks support infrastructure and real-estate monetisation, allowing mature operating cash-flow assets to be packaged for long-duration capital with reporting and governance requirements.
IFSCA and GIFT City: Fund-management and cross-border frameworks can create India-focused offshore access routes, but regulatory approvals, taxation, currency convertibility and individual fund domicile choices govern practical execution
Fundraise/Future Plans
Shareholding
Pre-issue shareholding
Promoter Holding 0.0%
Post-Issue Shareholding
Promoter Holding 0.0%
Category
Pre-Issue%Post-Issue%
Promoters
Edelweiss Securities and Investments Pvt Ltd
89.5%78.4%
Edelweiss Rural & Corporate Services Ltd | promoter group
5.0%5.0%
Edelweiss Investment Adviser Ltd | promoter group
0.5%0.5%
Total Promoter Holding
95.0%83.9%
Additional Shareholders
Other Shareholders
5.0%16.1%
Total Additional Holding
5.0%16.1%
Total Shareholding
100.0%100.0%
Existing Investor
- Overview
- Business
- Financial Highlights
- Industry Overview
- Fundraise/Future Plans
- Documentation
Get the Preqt App and keep in touch around the clock!
 Monitor your investments in real-time.
- Receive tailored deal suggestions.
- Get real-time updates and alerts.