


Elofic Industries Limited
Filtration That PerformsEngineering Cleaner Performance
Unlisted Review Rating
Apply
DRHP Not FiledPowering Cleaner Mobility Through Innovation in Filtration Technology
Elofic Industries appears to be a financially strong and attractively valued automotive and industrial-filtration company. FY25 delivered exceptional growth in revenue, EBITDA and PAT, while exports reached nearly half of consolidated revenue. The Company also has a net-cash balance sheet, strong distribution reach, established OEM relationships and growing exposure to alternative-powertrain filtration.
PARAMETER
WEIGHT
SCORE
KEY FACTORS
Financial Performance
25.0%
4.0/5
Elofic delivered a strong FY25 performance, with revenue, mechanical EBITDA and PAT increasing by approximately 27.9%, 52.6% and 60.6%, respectively
Show more
Detailed Analysis
Consolidated revenue from operations increased by 27.9%, from INR 351.8 Cr in FY24 to INR 450.1 Cr in FY25, indicating a significant acceleration in the latest year
EBITDA was approximately INR 123.2 Cr in FY'25, resulting in a margin of approximately 27.4%
Consolidated PAT increased by 60.6%, from INR 48.1 Cr in FY24 to INR 77.3 Cr in FY25. PAT margin improved from 13.7% to 17.2%
The audited consolidated balance sheet shows no conventional year-end borrowings and only INR 3.9 Cr of lease liabilities, against equity of INR 332.8 Cr. Cash, deposits and current investments materially exceed these liabilities
ROE is approximately 26.2%
Operating cash flow remained positive in both years, at INR 47.7 Cr in FY24 and INR 46.3 Cr in FY25. Cash generation remained healthy, although FY25 cash conversion was affected by a INR 27.9 Cr increase in trade receivables and higher inventory deployment
Industry
25.0%
3.0/5
Elofic operates in an established but technically evolving filtration industry. The domestic market benefits from vehicle production, an installed vehicle base requiring replacement filters and stricter product-performance standards
Show more
Detailed Analysis
The automotive and industrial-filtration market CAGR at 6.0%–8.0%. Demand is supported by vehicle production, replacement cycles, tightening filtration requirements and industrial applications, but the core market is not a high-growth emerging sector
The industry has established products, suppliers and distribution structures, but continues to evolve through EV, hydrogen, CNG, emission-control and cabin-air filtration applications
Product quality, emissions standards, OEM certifications and automotive-safety requirements create compliance obligations, but the Company is not directly dependent on administered tariffs or a single regulatory licence. Elofic maintains IATF 16949 compliance and an NABL-certified laboratory
0.0%
0.0/5
Show more
Detailed Analysis
The Company is led by Mohan Bir Sahni as Chairman and Managing Director and Kanwal Deep Sahni as Vice Chairman and Joint Managing Director, supported by an established professional and technical team
The FY25 board comprised six directors, including two independent directors, Sangeeta Bajaj and Subodh Kumar Jain. Independent representation was therefore approximately 33.3%. The audit committee was chaired by an independent director and included two independent members out of three
Valuation
25.0%
5.0/5
Show more
Detailed Analysis
The Company is valued at a P/E multiple of 10.1x, compared with the automotive-components industry P/E of 45.0x, representing a discount of approximately 77.6%
Elofic is valued at approximately 5.4x EV/EBITDA. The selected peer median is 14.2x, resulting in a discount of approximately 62.2%
The unlisted share price remained broadly unchanged at approximately INR 3,099.0 between July 7, 2026 and July 21, 2026. The displayed chart therefore indicates an observed price range of approximately 0.0%
TOTAL
100%
4.0/5
Weighted Composite Score
Per Share Price
₹3099.0
As of 14 Oct 2026
Market Cap. (₹ Cr)
Revenue (FY’25)
PAT FY’25 (in Cr)
P/E Multiple
Face Value
₹ 10.0Sale Type
SecondaryPAT FY’25 (in Cr)
₹ 74.3 CrPAT Margin (%)
16.9 %P/E Multiple
13.0xCAGR Growth 3Y
12.5 %ROE (FY’25)
24.6 %ROCE (FY’25)
31.4 %Price to Book Value ratio
2.0xDebt/Equity (FY’25)
0.0xMerchant banker appointed
❌ NoCompany Website
www.elofic.comDisclaimer: Unlisted shares are unregulated & illiquid. This is NOT investment advice. Please do your own due diligence before investing.
Overview
Business
Products
Business Model
Geographical Presence
Sales Channel
Financial Highlights
Income Statement
Revenue growth with EBITDA and PAT margins
| Financial Metric | FY 2023 | FY 2024 | FY 2025 |
|---|---|---|---|
| Revenue (₹ Cr) | 343.9 | 340.7 | 439.1 |
| Growth (%) | 71.0% | -1.8% | 28.9% |
| EBITDA (₹ Cr) | 55.7 | 67.9 | 106.5 |
| EBITDA Margin (%) | 16.0% | 19.9% | 24.2% |
| PAT (₹ Cr) | 39.7 | 47.5 | 74.3 |
| PAT Margin (%) | 11.4% | 13.9% | 16.9% |
OBSERVATIONS & INSIGHTS
FY'25 revenue grew sharply by approximately 28.9% after a modest decline in FY24, indicating a strong recovery and scale-up in the latest year
EBITDA margin expanded from 16.0% in FY23 to 24.2% in FY25, showing operating leverage and improved cost absorption
PAT increased from ₹39.66 Cr in FY23 to ₹74.28 Cr in FY25, while PAT margin improved from 11.4% to 16.9%
Export sales were a key growth driver in FY25, with exports rising by around 60% over FY24
Balance Sheet
| Financial Metric | FY 2023 | FY 2024 | FY 2025 |
|---|---|---|---|
| EQUITY & LIABILITIES | ₹ 264.0 Cr | ₹ 312.8 Cr | ₹ 380.8 Cr |
| Net Worth | ₹ 224.2 Cr | ₹ 271.0 Cr | ₹ 332.3 Cr |
| Share Capital | ₹ 2.5 Cr | ₹ 2.5 Cr | ₹ 2.5 Cr |
| Reserves & Surplus | ₹ 221.7 Cr | ₹ 268.5 Cr | ₹ 329.8 Cr |
| Total Liabilities | ₹ 39.8 Cr | ₹ 41.8 Cr | ₹ 48.5 Cr |
| Current Liabilities | ₹ 39.5 Cr | ₹ 41.2 Cr | ₹ 47.9 Cr |
| Borrowings | ₹ 0.0 Cr | ₹ 0.0 Cr | ₹ 0.0 Cr |
| Trade Payables | ₹ 31.3 Cr | ₹ 32.4 Cr | ₹ 39.6 Cr |
| Other Current Liabilities | ₹ 8.2 Cr | ₹ 8.8 Cr | ₹ 8.3 Cr |
| Non-Current Liabilities | ₹ 0.3 Cr | ₹ 0.6 Cr | ₹ 0.6 Cr |
| Borrowings | ₹ 0.0 Cr | ₹ 0.0 Cr | ₹ 0.0 Cr |
| Other Non-Current Liabilities | ₹ 0.3 Cr | ₹ 0.6 Cr | ₹ 0.6 Cr |
| ASSETS | ₹ 264.0 Cr | ₹ 312.7 Cr | ₹ 383.6 Cr |
| Current Assets | ₹ 176.7 Cr | ₹ 224.8 Cr | ₹ 292.2 Cr |
| Trade Receivables | ₹ 59.3 Cr | ₹ 71.4 Cr | ₹ 95.0 Cr |
| Inventory | ₹ 44.0 Cr | ₹ 50.3 Cr | ₹ 57.6 Cr |
| Cash & Cash Equivalents | ₹ 52.2 Cr | ₹ 88.3 Cr | ₹ 114.8 Cr |
| Other Current Assets | ₹ 21.2 Cr | ₹ 14.8 Cr | ₹ 24.8 Cr |
| Non-Current Assets | ₹ 87.3 Cr | ₹ 87.9 Cr | ₹ 91.4 Cr |
| Fixed Assets | ₹ 56.6 Cr | ₹ 69.6 Cr | ₹ 70.3 Cr |
| Other Non-Current Assets | ₹ 30.7 Cr | ₹ 18.3 Cr | ₹ 21.1 Cr |
OBSERVATIONS & INSIGHTS
Strong liquidity position: Cash and bank balance increased from ₹52.17 Cr in FY23 to ₹114.85 Cr in FY25
Debt-free balance sheet: No short-term or long-term borrowings are present across FY23-FY25
Healthy net worth growth: Net worth increased from ₹224.21 Cr in FY23 to ₹332.33 Cr in FY25
Receivables increased: Trade receivables increased from ₹59.34 Cr in FY23 to ₹95.00 Cr in FY25, broadly in line with revenue growth but still a monitorable
Inventory increased: Inventory increased from ₹43.97 Cr in FY23 to ₹57.60 Cr in FY25, while inventory days stayed within a controlled range
Asset base expanded: Total assets increased from ₹264.01 Cr in FY23 to ₹383.56 Cr in FY'25
Capital structure is conservative: Equity forms the majority of the balance sheet and borrowings are nil
Cash Flow
| Financial Metric | FY 2023 | FY 2024 | FY 2025 |
|---|---|---|---|
CFO (₹ Cr) Cash generated from core business operations. | +41.4 Cr | +44.8 Cr | +47.3 Cr |
CFI (₹ Cr) Cash used for investments and long-term assets. | -37.0 Cr | -44.6 Cr | -45.2 Cr |
CFF (₹ Cr) Cash flow related to funding and borrowings. | -1.2 Cr | -1.6 Cr | -2.8 Cr |
Working Capital
| Efficiency Metric | FY 2023 | FY 2024 | FY 2025 |
|---|---|---|---|
Debtor Days Average number of days taken to collect customer payments. | - | - | - |
Creditor Days Average time taken to pay suppliers and vendors. | - | - | - |
Inventory Days Average number of days inventory remains unsold. | - | - | - |
CCC (Cash Conversion Cycle) (Debtor Days + Inventory Days - Creditor Days) | - | - | - |
Financial Ratios
Measures the company’s leverage relative to shareholder equity.
OBSERVATIONS & INSIGHTS
ROCE improved to 31.4% in FY25 using the user-specified methodology, indicating strong operating return on capital employed
ROE improved to approximately 24.6% in FY25, reflecting high profitability despite a strong and growing net worth base
Debt/equity is 0.0x, as the data shared shows no short-term or long-term borrowings
Current ratio improved to around 6.1x in FY25, supported by cash, bank balances and receivables
Interest coverage is very high because finance cost is negligible, which reduces financial risk
Industry Overview
Industry Drivers
Expansion of Technological Capabilities
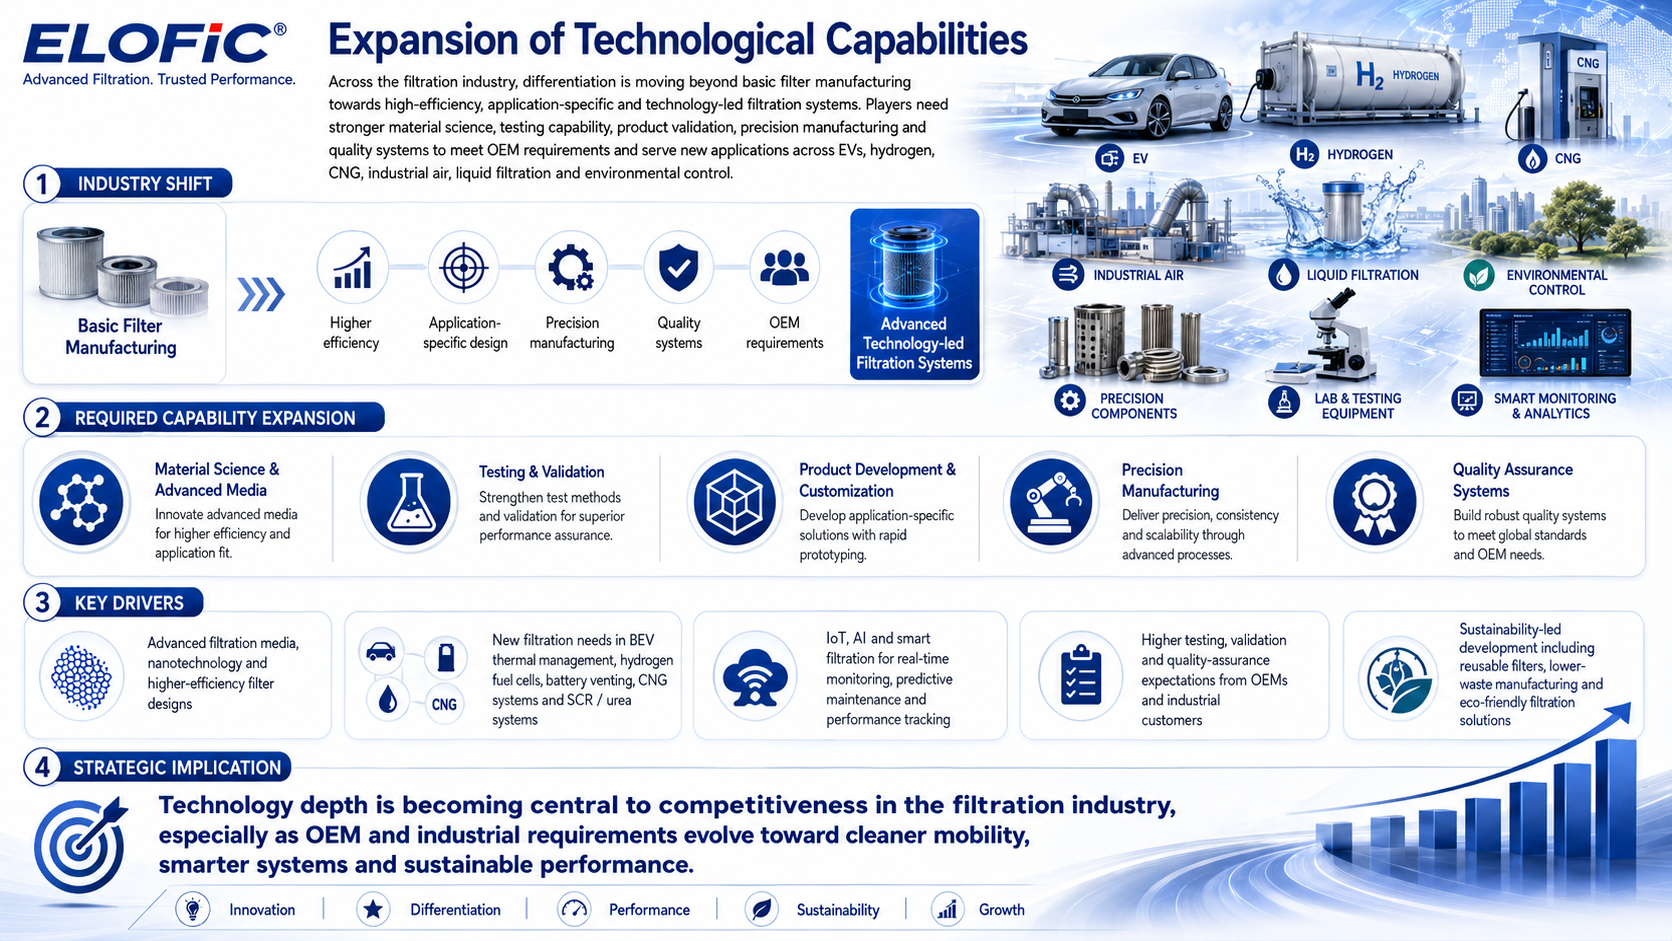
Across the filtration industry, differentiation is moving beyond basic filter manufacturing towards high-efficiency, application-specific and technology-led filtration systems. Players need stronger material science, testing capability, product validation, precision manufacturing and quality systems to meet OEM requirements and serve new applications across EVs, hydrogen, CNG, industrial air, liquid filtration and environmental control.
Key Drivers:
Shift towards advanced filtration media, nanotechnology and higher-efficiency filter designs
New filtration requirements for BEV thermal management, hydrogen fuel cells, battery venting, CNG systems and SCR/urea systems
Use of IoT, AI and smart filtration systems for real-time monitoring, predictive maintenance and performance tracking
Higher testing, validation and quality-assurance expectations from OEMs and industrial customers
Sustainability-led product development, including reusable filters, lower-waste manufacturing and eco-friendly filtration solutions
Capacity Expansion
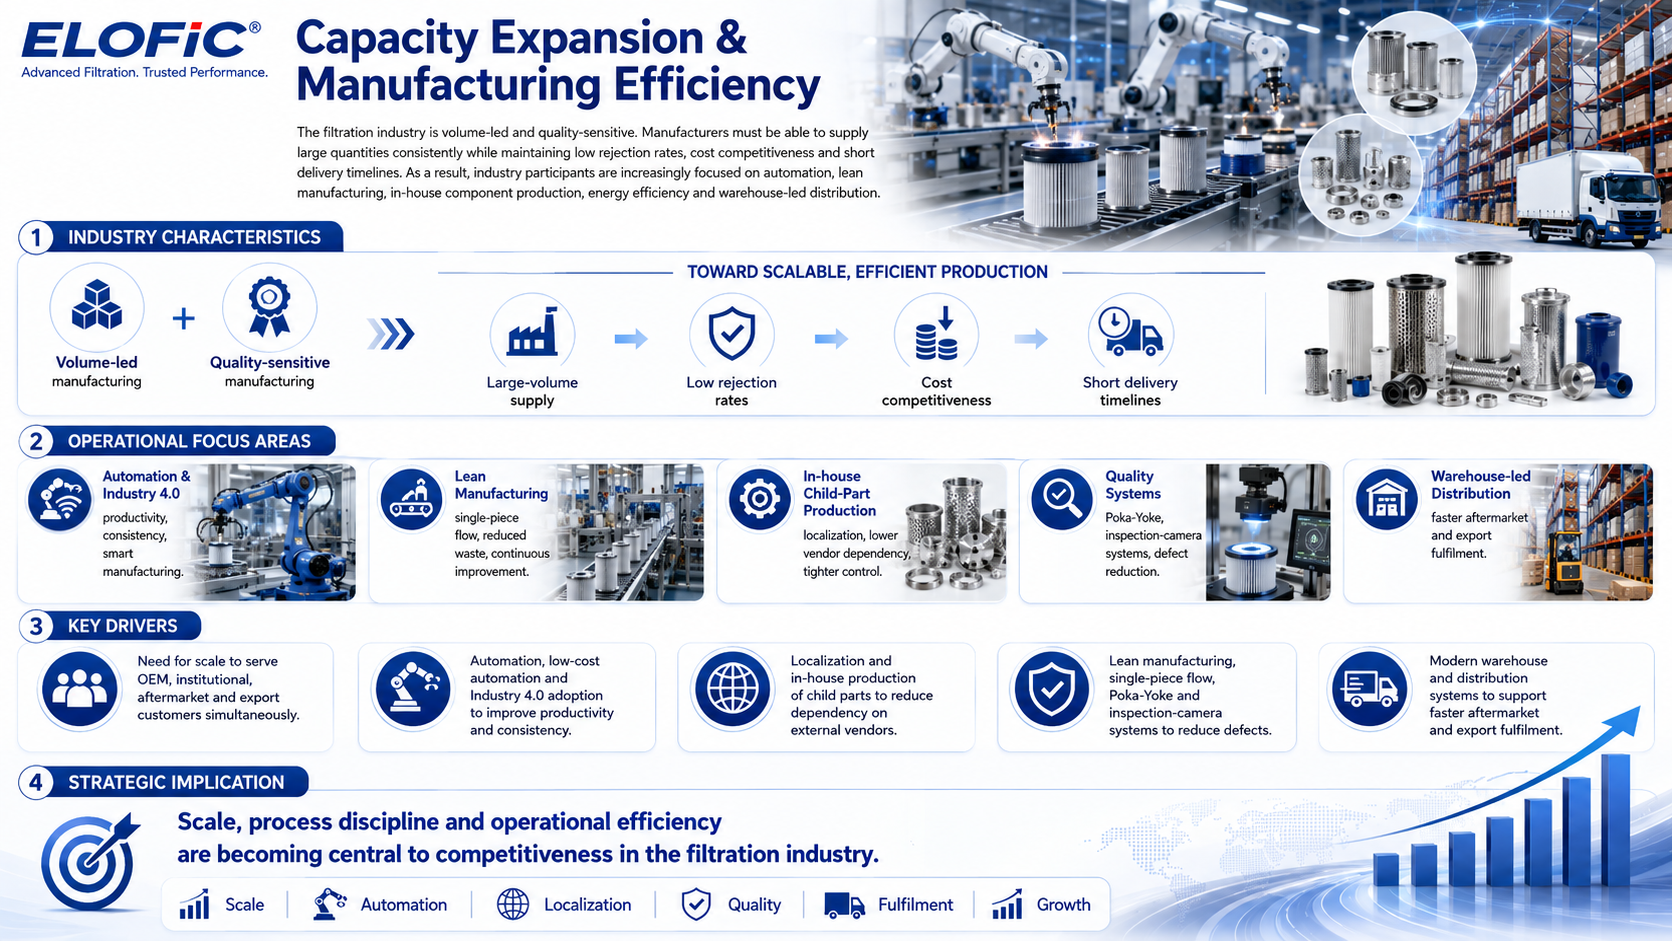
The filtration industry is volume-led and quality-sensitive. Manufacturers must be able to supply large quantities consistently while maintaining low rejection rates, cost competitiveness and short delivery timelines. Therefore, industry participants are increasingly focused on automation, lean manufacturing, in-house component production, energy efficiency and warehouse-led distribution.
Key Drivers:
Need for scale to serve OEM, institutional, aftermarket and export customers simultaneously
Automation, low-cost automation and Industry 4.0 adoption to improve productivity and consistency
Localization and in-house production of child parts to reduce dependency on external vendors
Lean manufacturing, single-piece flow, Poka-Yoke and inspection-camera systems to reduce defects
Modern warehouse and distribution systems to support faster aftermarket and export fulfilment
Global Market Penetration
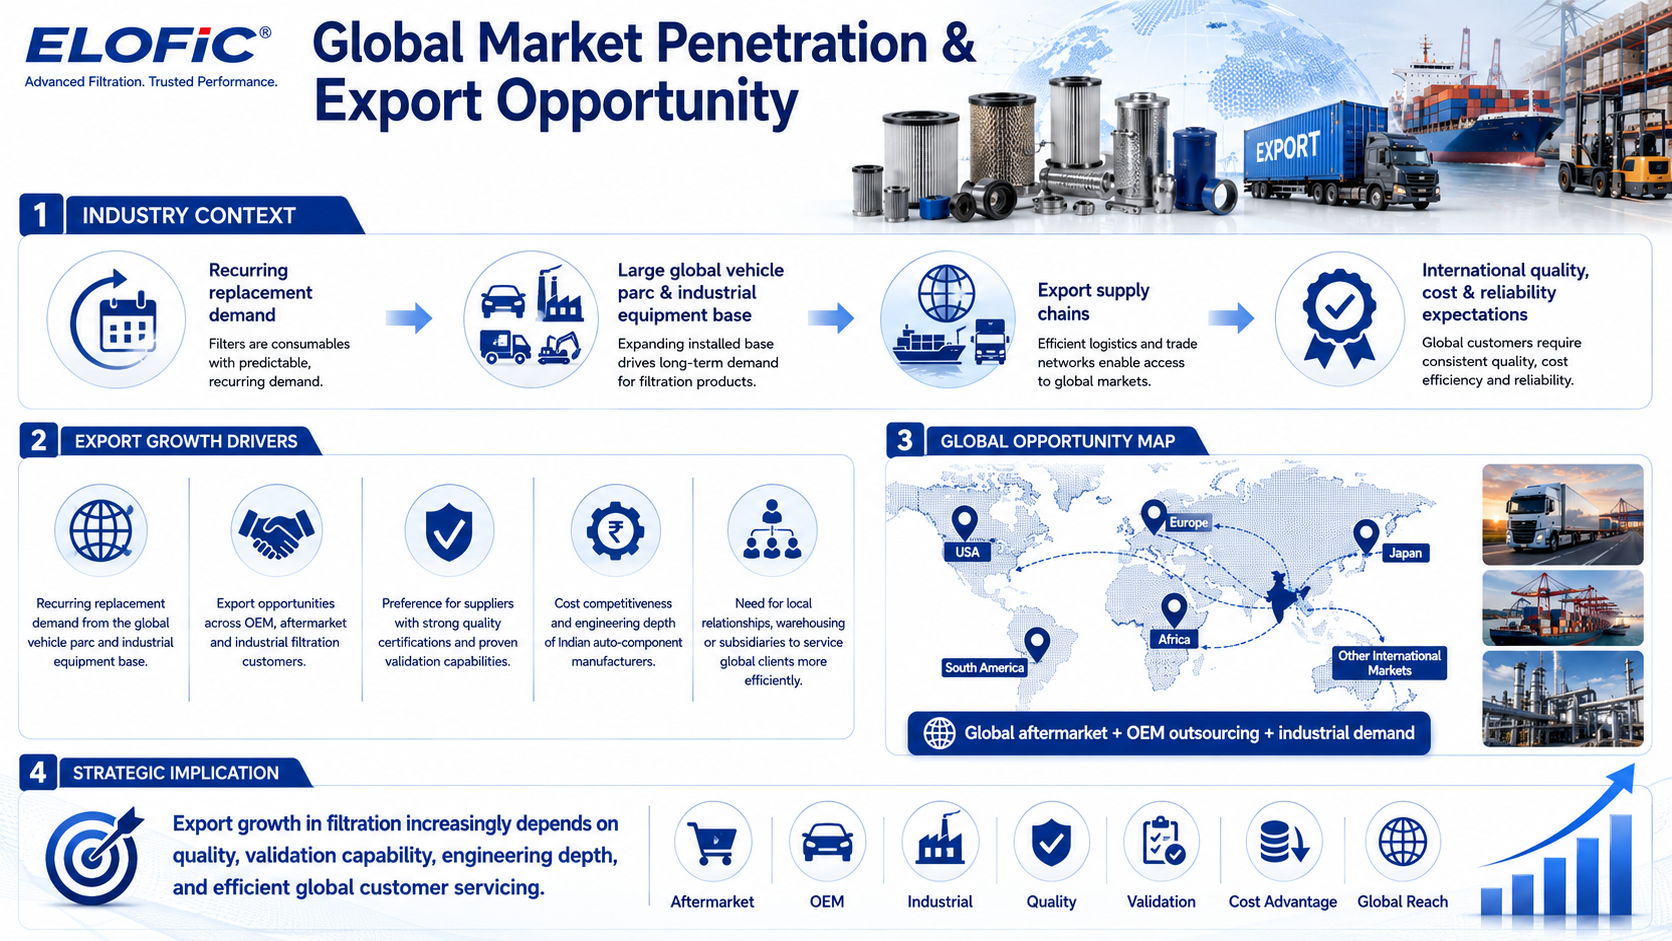
Automotive and industrial filters are global consumable products with recurring replacement demand. Indian manufacturers can participate in export supply chains where they can meet international quality, cost and reliability expectations. Export growth in the industry is supported by global aftermarket demand, OEM outsourcing, industrial filtration demand and the ability of Indian manufacturers to offer engineering-led, cost competitive products.
Key Drivers:
Recurring replacement demand from the global vehicle parc and industrial equipment base
Export opportunities across OEM, aftermarket and industrial filtration customers
International customer preference for suppliers with strong quality certifications and proven validation capabilities
Cost competitiveness and engineering depth of Indian auto-component manufacturers
Need for local relationships, warehousing or subsidiaries to service global clients more efficiently.
Risks in the Industry
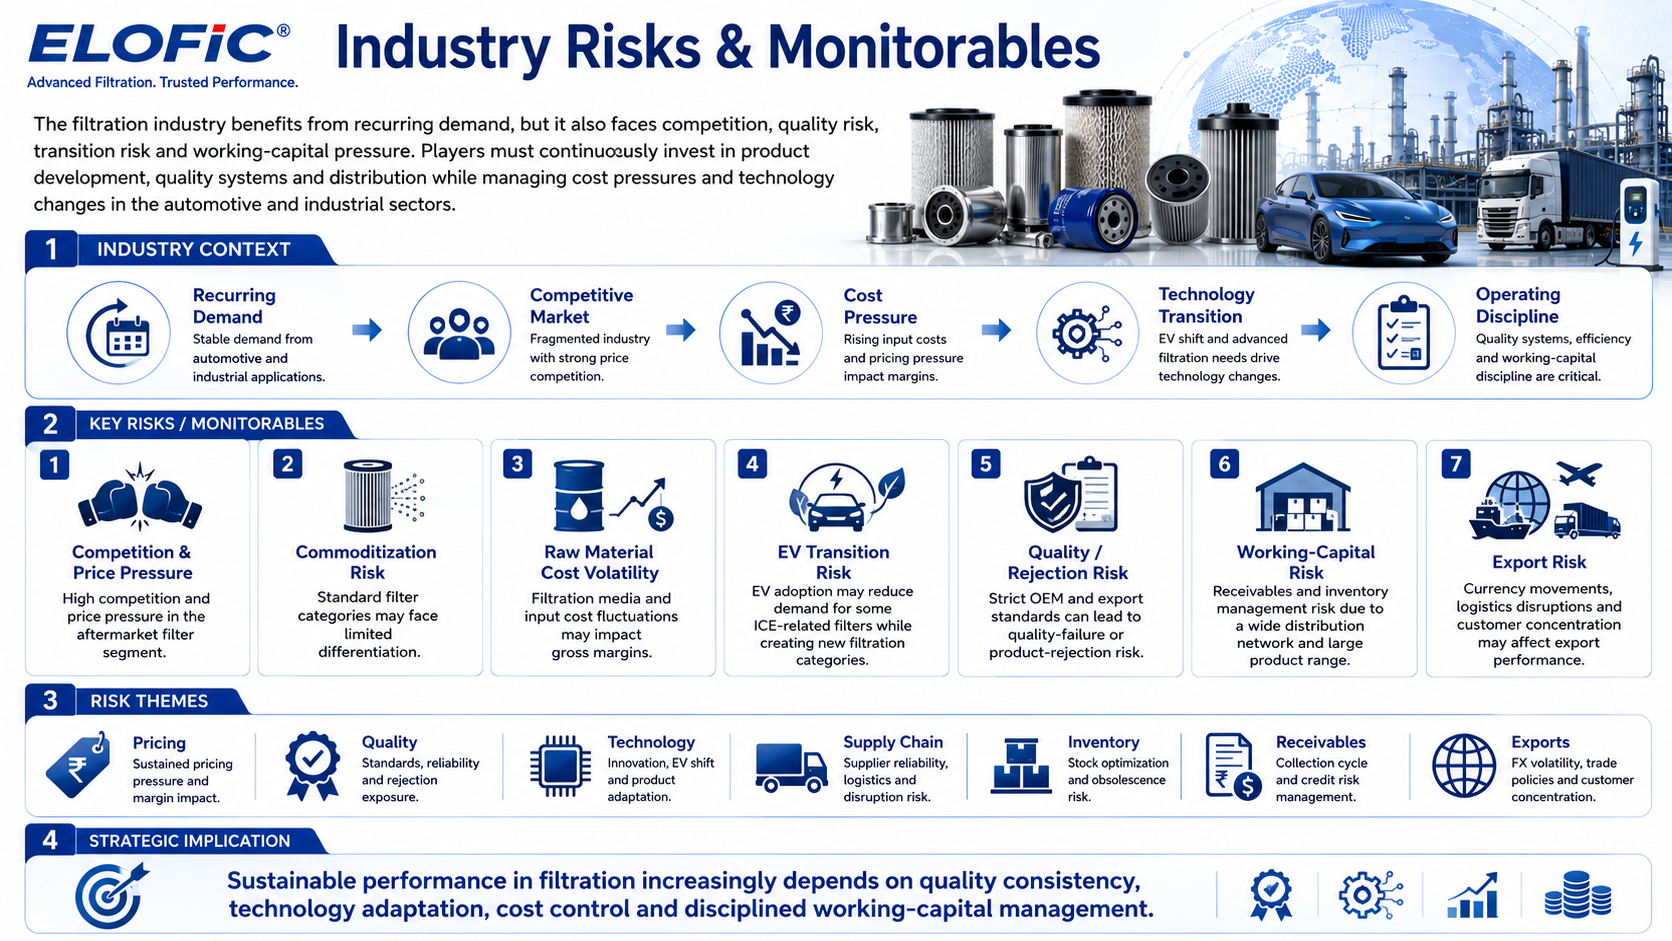
The filtration industry benefits from recurring demand, but it also faces competition, quality risk, transition risk and working-capital pressure. Players must continuously invest in product development, quality systems and distribution while managing cost pressures and technology changes in the automotive and industrial sectors.
Key Risks / Monitorables:
High competition and price pressure in the aftermarket filter segment.
Commoditization risk in standard filter categories where differentiation is limited.
Raw material and filtration media cost volatility impacting gross margins.
EV transition may reduce demand for certain ICE-related filters while creating new filtration categories.
Quality failure or product rejection risk due to strict OEM and export standards.
Receivable and inventory management risk due to wide distribution and large product range.
Export risk from currency movements, logistics disruptions and customer concentration.
Government Policy Support
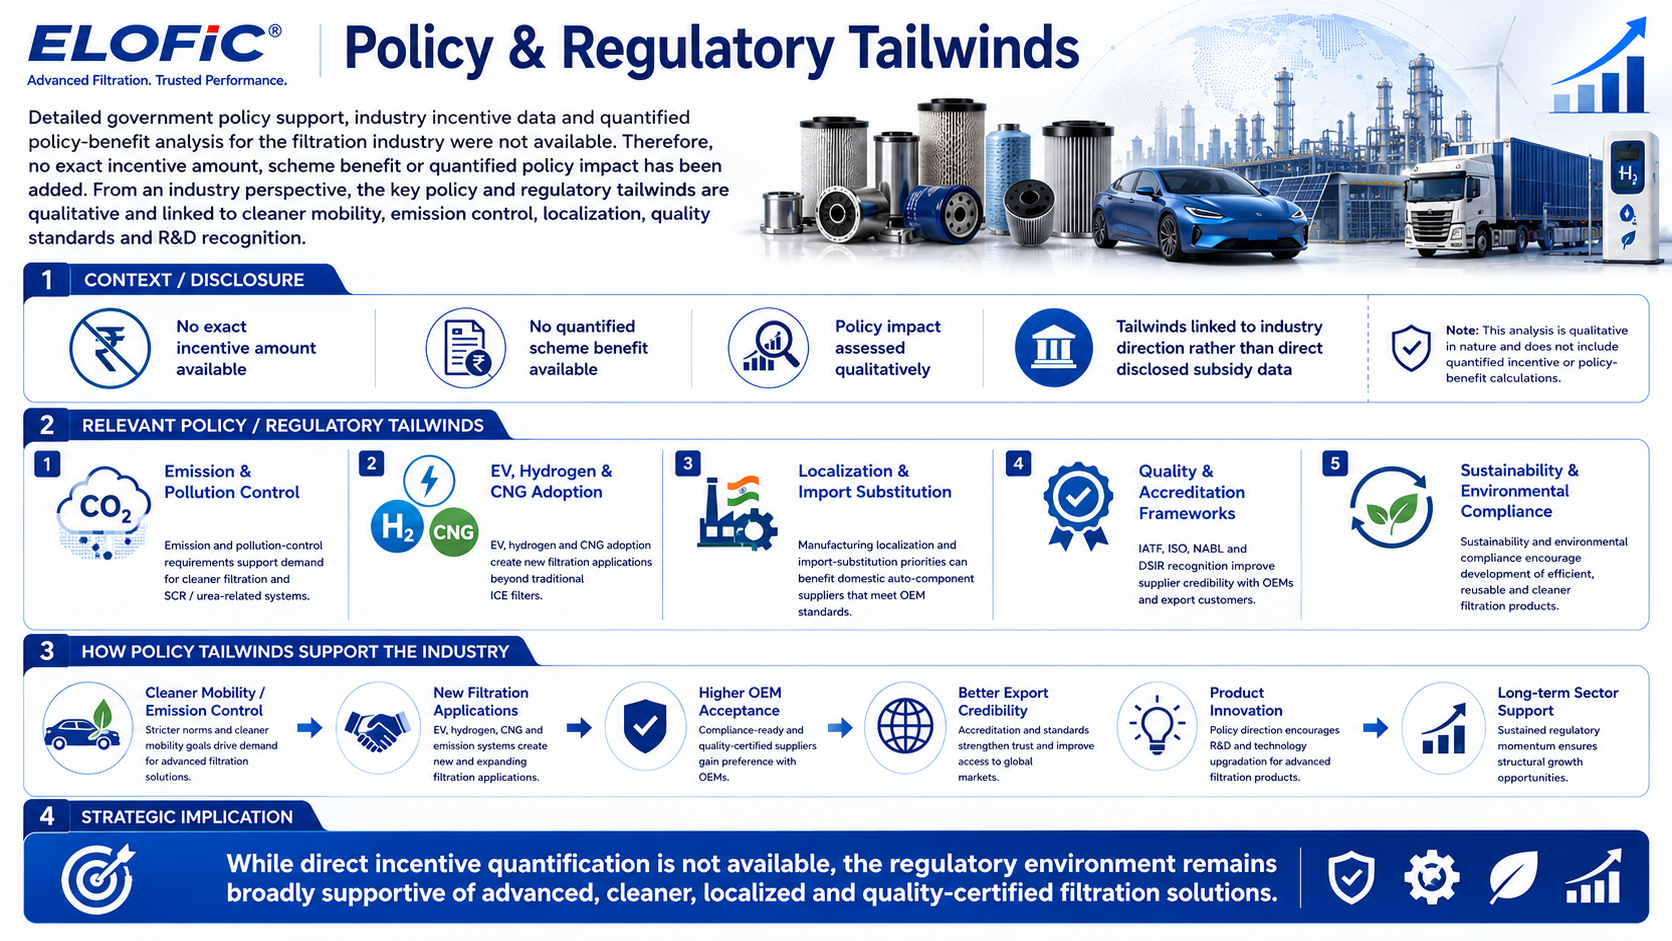
Detailed government policy support, industry incentive data and quantified policy-benefit analysis for the filtration industry were not available. Therefore, no exact incentive amount, scheme benefit or quantified policy impact has been added. From an industry perspective, the key policy/regulatory tailwinds are qualitative and linked to cleaner mobility, emission control, localization, quality standards and R&D recognition.
Relevant Policy / Regulatory Tailwinds:
Emission and pollution-control requirements support demand for cleaner filtration and SCR/urea-related systems.
EV, hydrogen and CNG adoption create new filtration applications beyond traditional ICE filters.
Manufacturing localization and import-substitution priorities can benefit domestic auto-component suppliers that meet OEM standards.
Quality and accreditation frameworks such as IATF, ISO, NABL and DSIR recognition improve supplier credibility with OEMs and export customers.
Sustainability and environmental compliance encourage development of efficient, reusable and cleaner filtration products
- Overview
- Business
- Financial Highlights
- Industry Overview
- Documentation
Get the Preqt App and keep in touch around the clock!
 Monitor your investments in real-time.
- Receive tailored deal suggestions.
- Get real-time updates and alerts.
