


Eventions
Events Beyond ExpectationsCreating Experiences That Matter
IPO Summary
Eventions Limited is a Gurgaon-based MICE and corporate event-management company operating an asset-light execution model across meetings, incentive travel, conferences, corporate events and brand activations. FY26 revenue from operations was INR 99.7 Cr, EBITDA INR 10.2 Cr and PAT INR 7.7 Cr, with EBITDA margin expanding to 10.2% and PAT margin to 7.7%. The business has executed more than 200 events across FY24-FY26, but remains highly concentrated in MICE services, insurance/banking clients and a limited customer set. The IPO is a 100% fresh issue of 32.304 lakh shares at INR 112-118, with proceeds primarily directed to working capital, debt reduction and investment in the 70%-owned travel subsidiary Gantu Online.
IPO Review Rating
Above Avg
SME Connecting Brands and Audiences Through Powerful Experiential Solutions
Eventions demonstrates strong margin expansion, PAT growth and return ratios, supported by a fully fresh IPO. .Eventions' stronger attributes are its substantial EBITDA and PAT margin expansion, 53.3% FY24–FY26 PAT CAGR, 55.2% RoNW, 48.8% ROCE and 100% fresh-issue structure. Its 18.6x post-issue P/E is only around 11% above the RHP peer average.
The principal offsets are more meaningful. Revenue CAGR is only 7.3%, operating cash flow has been negative for two consecutive years, the largest customer contributes 42.7%, the top 10 contribute 84.6%, and 71.1% of reported FY26 revenue is concentrated in Haryana billing. EV/EBITDA also sits at a substantial premium to the selected peers.
The subscription book and QIB demand are the biggest remaining scoring variables.
PARAMETER
WEIGHT
SCORE
KEY FACTORS
Financial Performance
40.0%
3.0/5
Eventions has delivered strong PAT growth and significant margin expansion with high return ratios. However, revenue growth is moderate, operating cash flow has remained negative for two consecutive years, and customer concentration remains substantial.
Show more
Detailed Analysis
The Company's revenue increased from INR 86.6 Cr in FY24 to INR 99.7 Cr in FY26, representing a moderate FY24–FY26 CAGR of approximately 7.3%, although FY26 growth accelerated to 14.0% YoY
The Company's EBITDA margin expanded materially from 4.8% in FY24 to 10.2% in FY26, demonstrating significant improvement in the profitability of its event mix
The Company's PAT margin improved consistently from 3.8% in FY24 to 7.7% in FY26, indicating better operating leverage and higher profitability
The Company's debt-to-equity ratio stood at approximately 0.5x in FY26, representing manageable leverage, although it increased from 0.4x in FY25
The Company generated a very strong 55.2% RoNW in FY26, although this moderated from 70.3% in FY25 and 106.5% in FY24 as its equity base expanded
Operating cash flow remained negative at INR 4.5 Cr in FY26 after negative INR 2.9 Cr in FY25, indicating that reported accounting profits have not translated into operating cash generation
Industry
15.0%
4.0/5
Eventions operates in a structurally growing MICE and event-management market, with government tourism initiatives and increasing corporate experiential spending supporting demand. The principal offsets are fragmentation, discretionary corporate budgets, vendor dependence and geographic/customer concentration
Show more
Detailed Analysis
India's event and exhibition market is expected to grow from USD 5.2 Bn in 2024 to USD 7.8 Bn by 2029, representing an estimated 8.3% CAGR
India's organised MICE and event-management market remains in a growth phase, supported by corporate marketing expenditure, experiential engagement, tourism and increasing professionalisation of event execution
Event and MICE operators face moderate regulatory exposure involving venue permissions, travel rules, taxation, safety standards and international-event requirements, but the sector does not face unusually restrictive licensing barriers
The Company has the ability to execute assignments across India and internationally, but 71.2% of FY26 reported revenue was billed from Haryana, creating meaningful geographic concentration in the disclosed financials
Management
15.0%
5.0/5
Eventions benefits from zero promoter pledge, no OFS and experienced operating promoters. Deductions arise from only 40% Board independence, recently constituted independent oversight, related-party movements, historical statutory-compliance delays and ongoing tax/consumer matters
Show more
Detailed Analysis
Cristoo Arora has over 15 years of MICE and event-management experience, while Ravi Rajak has more than seven years of relevant experience, providing reasonable sector expertise within the promoter team
Two of the Company's five Directors are Independent Directors, resulting in 40.0% Board independence, with both Independent Directors appointed only in February 2026
No promoter or promoter-group shares are pledged and there are no criminal or SEBI proceedings, although the Company has a pending consumer complaint, tax proceedings and a history of delayed statutory filings
Gross FY26 disclosed related-party movements total approximately INR 9.4 Cr, or around 9.4% of revenue, although this includes loans, repayments and imprest movements and therefore should not be interpreted entirely as operating expenditure
Valuation
20.0%
4.0/5
P/E valuation is only moderately above the RHP peer average and is supported by Eventions' superior RoNW. However, its EV/EBITDA premium is considerably larger, while the Gantu pro-forma numbers indicate some dilution to consolidated profitability.
Show more
Detailed Analysis
Eventions' 18.7x post-issue P/E is approximately 11.4% above the 16.7 RHP peer average, representing a relatively modest earnings-multiple premium
Eventions' ~14.9x EV/EBITDA is approximately 70% above the ~8.8x peer average, indicating a significantly higher enterprise-value multiple than the selected listed peers
The issue is valued at approximately 5.6x FY26 historical book value, although the fresh issue reduces the approximate pro-forma post-issue P/B to ~2.6x before issue expenses
Eventions generated a very strong 55.2% FY26 RoNW, substantially above Mach Conferences' 13% and E-Factor's 24.3%
Merchant Banker Track Record
10.0%
5.0/5
Merchant Banker Summary: Corporate Professionals Capital has a limited but mixed SME IPO track record, with only three completed issues in the comparable set. Its average listing gain of 51.45% is heavily skewed by Diensten Tech’s 152% debut, while average subscription stands at 19.04x. With 2 of 3 IPOs listing above issue price, the success rate is 66.7%, indicating reasonable execution capability but a relatively small and inconsistent historical sample
Show more
Detailed Analysis
Corporate Professionals' three tracked SME IPOs produced an average listing gain of 51.45%
The three completed issues achieved average subscription of 19.04x
Two of the three completed SME IPOs listed above their issue prices, resulting in a 66.7% positive-listing rate
TOTAL
100%
3.9/5
Weighted Composite Score
Issue Price
₹112.0 to ₹118.0
As of 30 Sep 2026
GMP
₹0.0
As of 30 Sep 2026
Estimated Gain / Loss
0.0%
Lot Size
1,200.0 Shares
Grey Market Premium (GMPs) are shared for knowledge purpose only. PrEqt doesn’t promote or execute the trades.
| Issue Size (in Cr) | |
|---|---|
| Overall | ₹38.0 Cr |
| Fresh Issue | ₹38.0 Cr |
| Offer for Sale | ₹0.0 Cr |
Minimum Investment
₹2,83,200.0 / 14,40,000 shares

Merchant Banker
Corporate Professionals Capital Pvt.Ltd.
Corporate Professionals Capital Pvt.Ltd.
IPO Document
Offer Start Date
Offer End Date
Valuation
Revenue (FY'26)
PAT (FY'26)
Issue Size (in Cr)
Face Value
₹ 10.0Offer Price
₹ 118.0Lot Size
1,200.0 sharesSale Type
Fresh capital onlyPAT (FY'26)
₹ 7.7 CrPAT Margin (FY'26)
7.7 %P/E Multiple
18.7xEBITDA (FY'26)
₹ 10.2 CrCAGR Growth 2Y
7.3 %ROE (FY'26)
55.2 %ROCE (FY'26)
48.8 %Price to Book Value
2.6xDebt/Equity
0.5xCompany Website
eventions.inExplore new deals
Overview
Fund Allocation
Total: ₹0 CrSource:Company DRHP
Timeline
IPO Open Date
To Be Announced
IPO Close Date
To Be Announced
Tentative Allotment
To Be Announced
Initiation of Refunds
To Be Announced
Credit of Shares to Demat
To Be Announced
Tentative Listing Date
To Be Announced
Business
Business Model
Geographical Presence
Sales Channel
Key Risk Factors
Financial Highlights
Income Statement
Revenue growth with EBITDA and PAT margins
| Financial Metric | FY 2024 | FY 2025 | FY 2026 |
|---|---|---|---|
| Revenue (₹ Cr) | 87.3 | 88.0 | 100.6 |
| Growth (%) | 108.1% | 1.1% | 14.0% |
| EBITDA (₹ Cr) | 4.1 | 7.1 | 10.2 |
| EBITDA Margin (%) | 4.7% | 8.1% | 10.2% |
| PAT (₹ Cr) | 3.3 | 5.1 | 7.7 |
| PAT Margin (%) | 3.8% | 5.8% | 7.7% |
OBSERVATIONS & INSIGHTS
Revenue increased from INR 87.3 Cr in FY24 to ₹88.0 Cr in FY25 and INR 100.6 Cr in FY26. FY25 growth was modest because the Company prioritised higher-margin engagements over volume growth, while FY26 growth accelerated as execution of premium MICE assignments increased
EBITDA increased from approximately INR 4.1 Cr in FY24 to ₹7.1 Cr in FY25 and INR 10.2 Cr in FY26, while EBITDA margin expanded from 4.7% to 8.1% and 10.2%, respectively. The improvement was driven by a favourable event mix, better procurement, higher-value assignments and greater contribution from premium international events
PAT rose from INR 3.3 Cr in FY24 to INR 5.1 Cr in FY25 and INR 7.7 Cr in FY26, with PAT margin expanding from 3.8% to 5.8% and 7.7%. Margin expansion outpaced revenue growth because of improved event economics and better vendor pricing
Balance Sheet
| Financial Metric | FY 2024 | FY 2025 | FY 2026 |
|---|---|---|---|
| Net Worth | ₹ 4.7 Cr | ₹ 9.9 Cr | ₹ 18.1 Cr |
| Total Assets | ₹ 29.0 Cr | ₹ 23.8 Cr | ₹ 50.6 Cr |
| Total Borrowing | ₹ 2.0 Cr | ₹ 3.6 Cr | ₹ 9.4 Cr |
| Reserves & Surplus | ₹ 4.7 Cr | ₹ 9.9 Cr | ₹ 9.2 Cr |
OBSERVATIONS & INSIGHTS
Net Worth: Increased from ₹4.7 Cr in FY24 to ₹9.9 Cr in FY25 and ₹18.1 Cr in FY26, supported by retained profits and the significant increase in equity share capital during FY26
Total Assets: Declined from ₹29.0 Cr to ₹23.8 Cr in FY25, mainly due to lower receivables and cash, before rising sharply to ₹50.6 Cr in FY26 as trade receivables and advances expanded
Total Borrowings: Increased from ₹2.0 Cr to ₹3.6 Cr to ₹9.4 Cr, primarily reflecting higher short-term funding requirements as the business and working-capital cycle expanded
Reserves & Surplus: Increased from ₹4.7 Cr in FY24 to ₹9.9 Cr in FY25, driven by accumulated profits, before moderating to ₹9.2 Cr in FY26 as part of reserves was effectively reflected through the enlarged equity capital base
Cash Flow
| Financial Metric | FY 2024 | FY 2025 | FY 2026 |
|---|---|---|---|
CFO in Cr Cash generated from core business operations. | +0.3 Cr | -2.9 Cr | -4.5 Cr |
CFI in Cr Cash used in / generated from investing activities. | -1.7 Cr | -0.8 Cr | +0.4 Cr |
CFF in Cr Cash from / used in financing activities. | +1.1 Cr | +1.2 Cr | +5.7 Cr |
Working Capital
| Efficiency Metric | FY 2023 | FY 2024 | FY 2025 |
|---|---|---|---|
Debtor Days Average number of days taken to collect customer payments. | - | - | - |
Creditor Days Average time taken to pay suppliers and vendors. | - | - | - |
Inventory Days Average number of days inventory remains unsold. | - | - | - |
CCC (Cash Conversion Cycle) (Debtor Days + Inventory Days - Creditor Days) | - | - | - |
Financial Ratios
Measures the company’s leverage relative to shareholder equity.
OBSERVATIONS & INSIGHTS
ROE: Fell from 106.5% to 70.3% to 55.2% as equity grew faster than PAT
Debt-to-Equity: Moved from 0.4x to 0.4x to 0.5x due to higher FY26 borrowings for working capital
Interest Coverage: Declined from 18.9x to 18.9x to 16.3x as finance costs increased faster than operating profit
Current Ratio: Improved from 1.3x to 1.6x, then remained at 1.6x, indicating adequate short-term liquidity
ROA: Improved from 11.3% to 19.4% to 20.7% due to strong PAT growth and better asset utilisation
ROCE: Declined from 88.5% to 68.3% to 48.8% as capital employed expanded faster than operating profit
Industry Overview
Industry Drivers
Premium Corporate and Incentive Travel
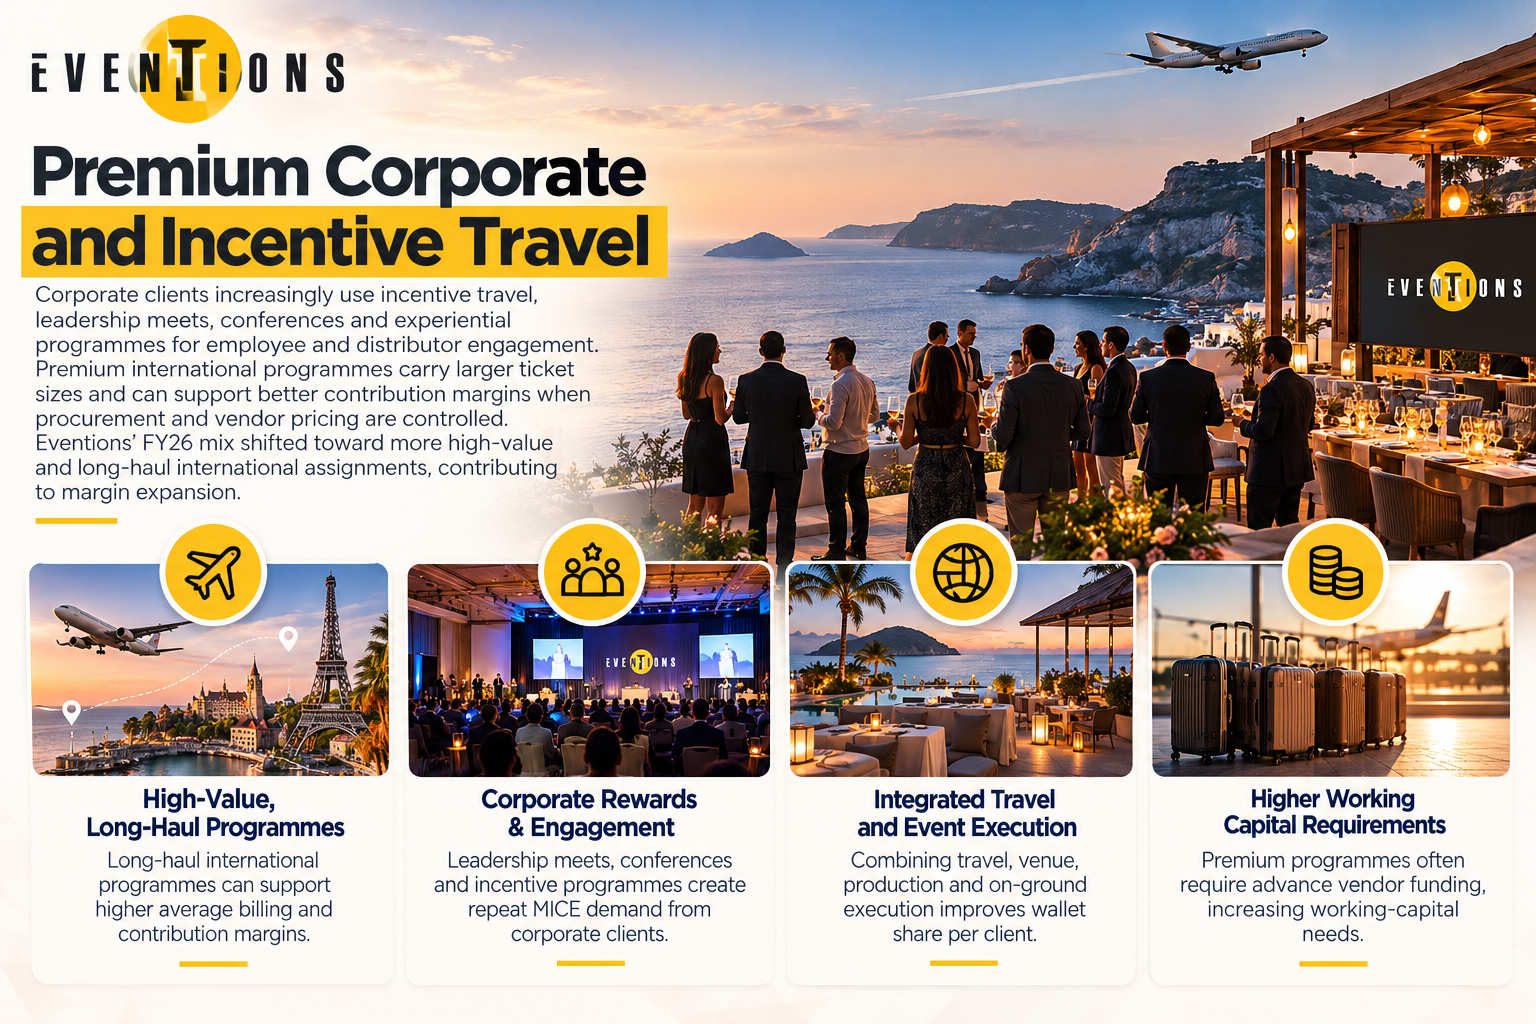
Corporate clients increasingly use incentive travel, leadership meets, conferences and experiential programmes for employee and distributor engagement. Premium international programmes carry larger ticket sizes and can support better contribution margins when procurement and vendor pricing are controlled. Eventions' FY26 mix shifted toward more high-value and long-haul international assignments, contributing to margin expansion.
The key points are:
Long-haul programmes can support higher average billing and contribution margins
Corporate reward and recognition budgets create repeat MICE demand
Integrated travel plus event execution improves wallet share per client
Premium programmes also increase advance vendor funding and working-capital needs
Technology and Hybrid Event Formats
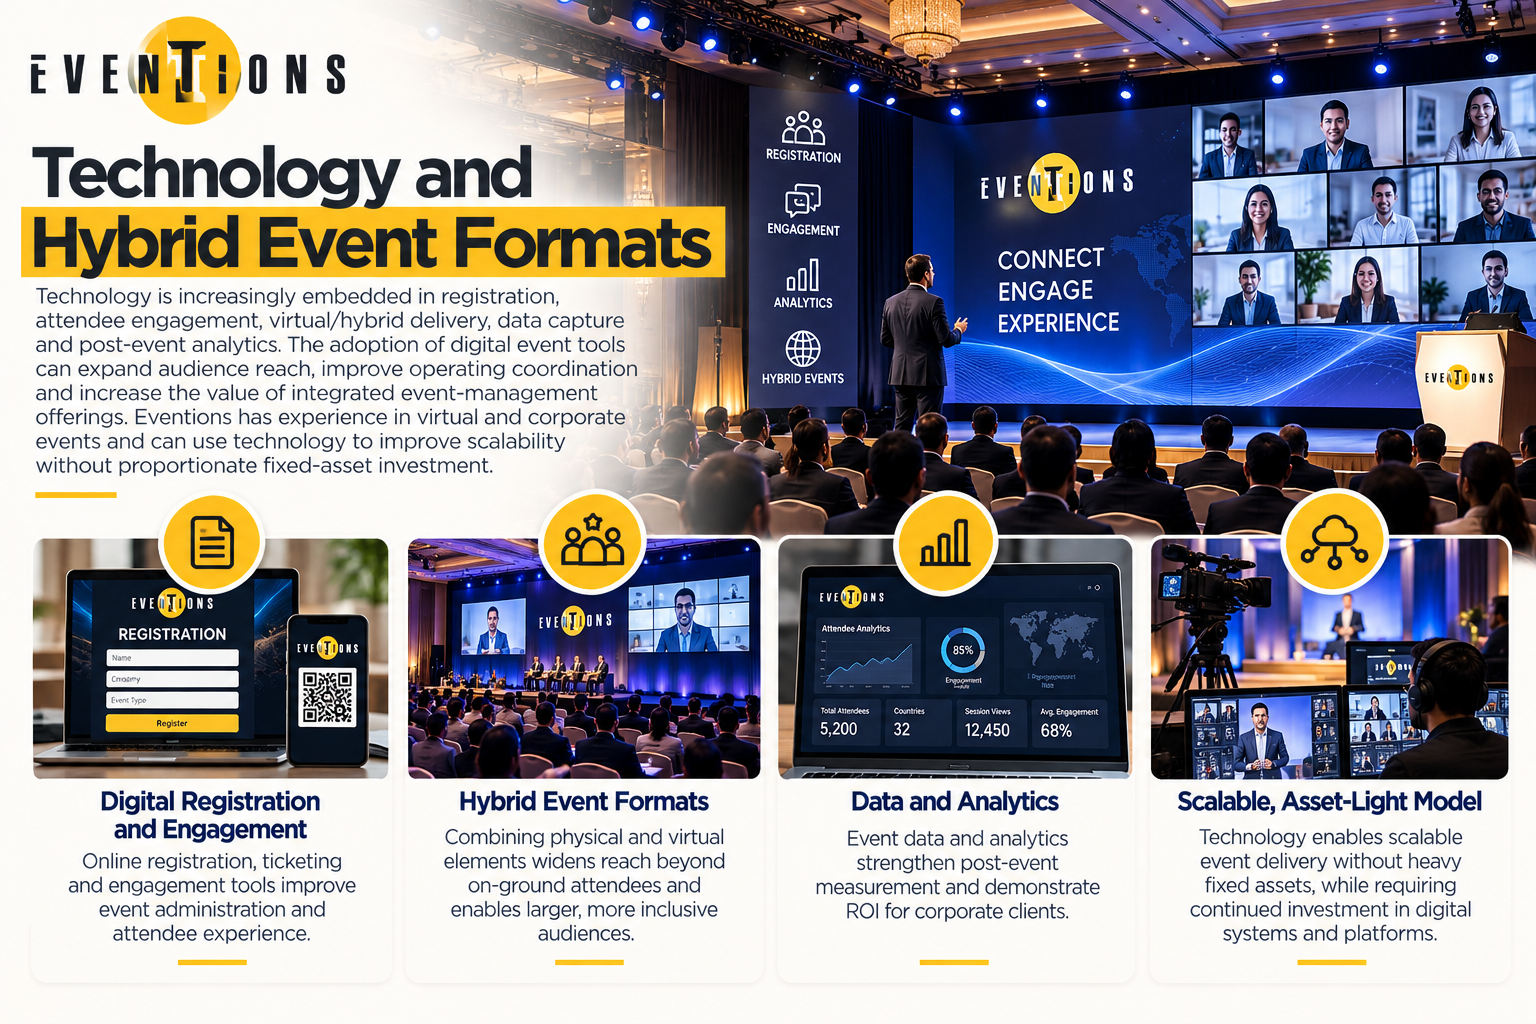
Technology is increasingly embedded in registration, attendee engagement, virtual/hybrid delivery, data capture and post-event analytics. The adoption of digital event tools can expand audience reach, improve operating coordination and increase the value of integrated event-management offerings. Eventions has experience in virtual and corporate events and can use technology to improve scalability without proportionate fixed-asset investment.
The key points are:
Hybrid formats widen reach beyond physical attendees
Digital registration and engagement improve event administration
Data and analytics can strengthen post-event measurement for corporate clients
Technology supports asset-light scalability but requires continued systems investment
Tourism, Connectivity and Venue Infrastructure
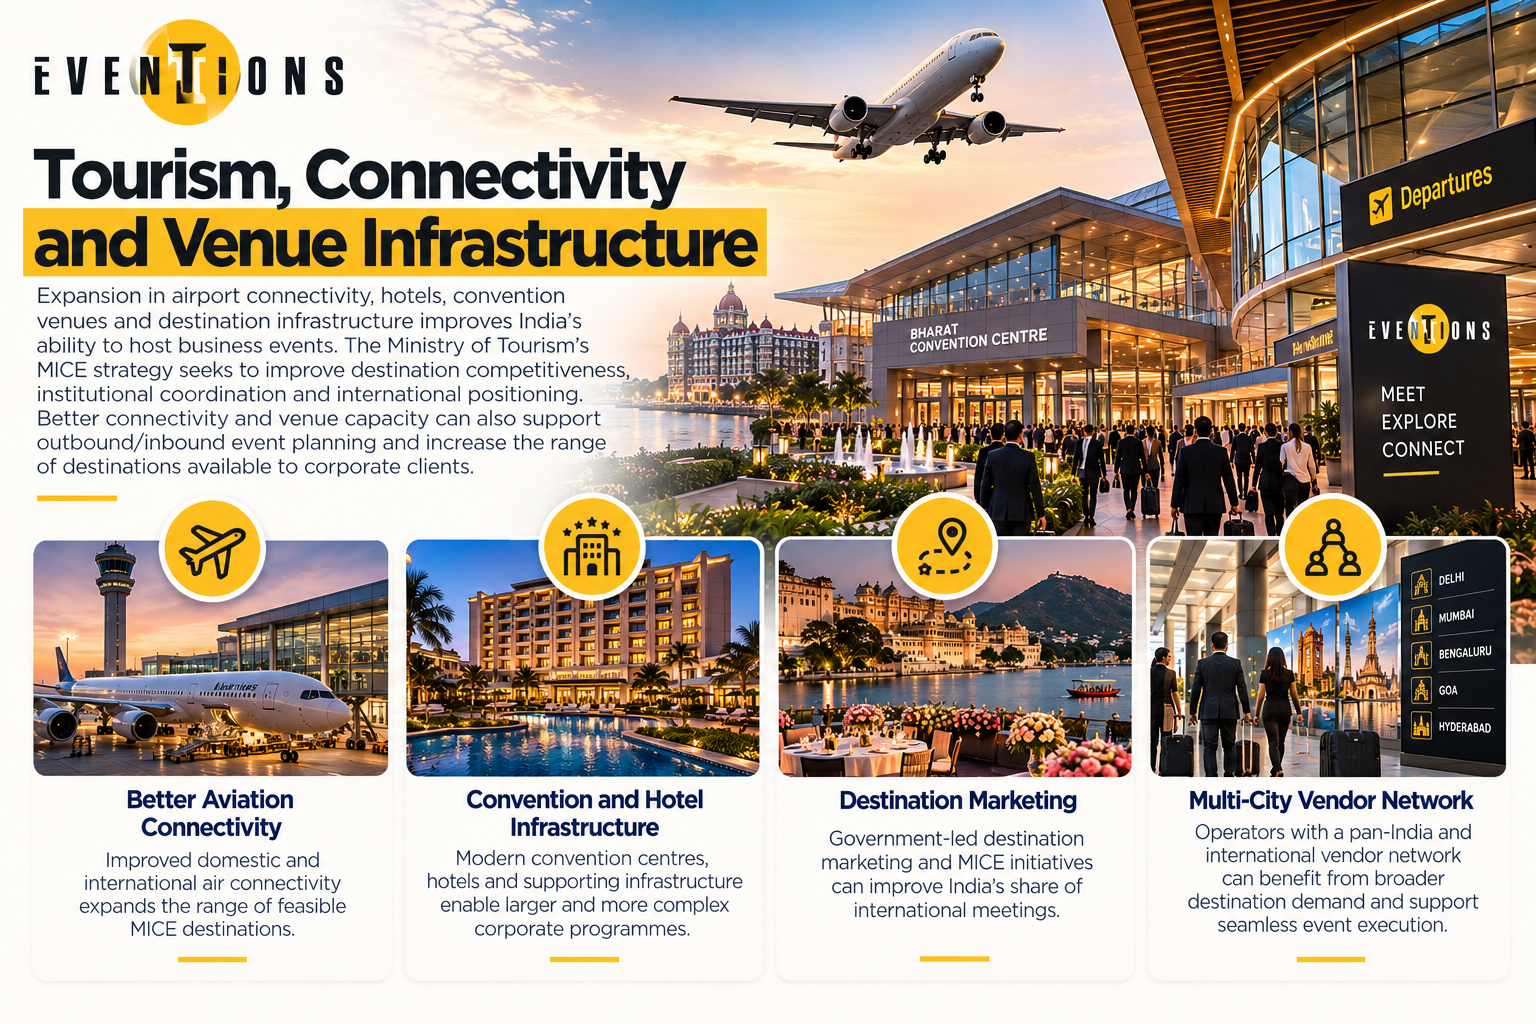
Expansion in airport connectivity, hotels, convention venues and destination infrastructure improves India's ability to host business events. The Ministry of Tourism's MICE strategy seeks to improve destination competitiveness, institutional coordination and international positioning. Better connectivity and venue capacity can also support outbound/inbound event planning and increase the range of destinations available to corporate clients.
The key points are:
Better aviation connectivity expands feasible MICE destinations
Convention and hotel infrastructure supports larger corporate programmes
Destination marketing can improve India's share of international meetings
Operators with multi-city vendor networks can benefit from broader destination demand
Risks in the Industry
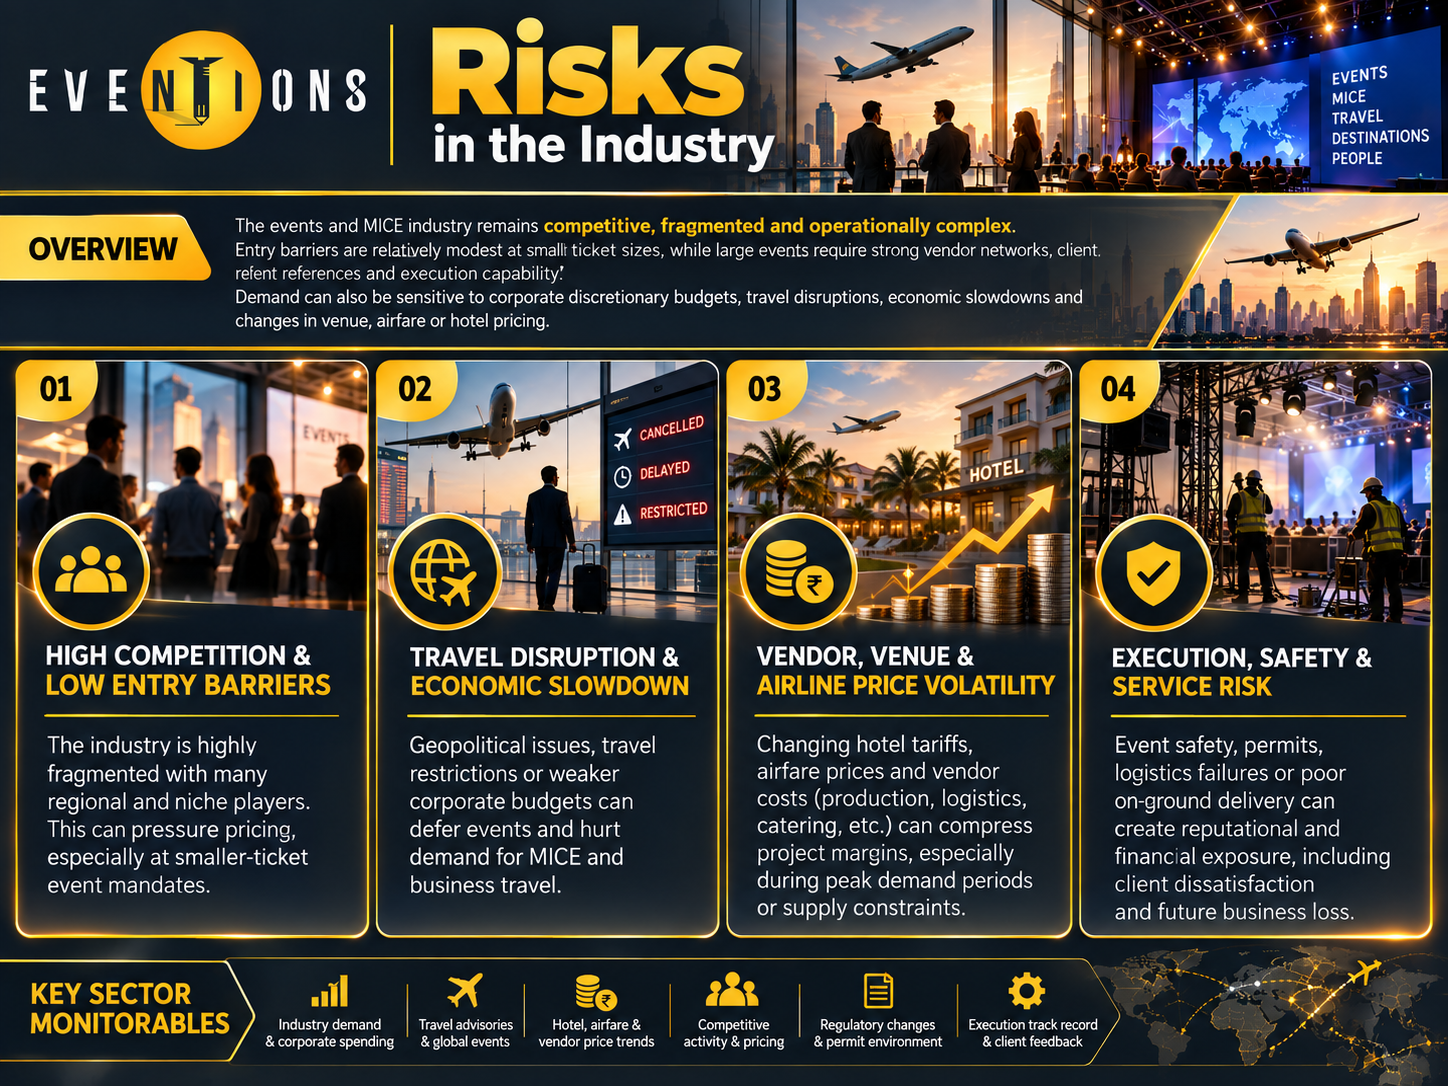
The events and MICE industry remains competitive, fragmented and operationally complex. Entry barriers are relatively modest at smaller ticket sizes, while large events require strong vendor networks, client references and execution capability. Demand can also be sensitive to corporate discretionary budgets, travel disruptions, economic slowdowns and changes in venue, airfare or hotel pricing.
The key risks are:
High competition and low entry barriers can pressure pricing
Travel disruptions, geopolitical events and economic slowdowns can defer corporate events
Vendor, venue and airline price volatility can compress project margins
Event safety, permits, logistics and service failures can create reputational and financial exposure
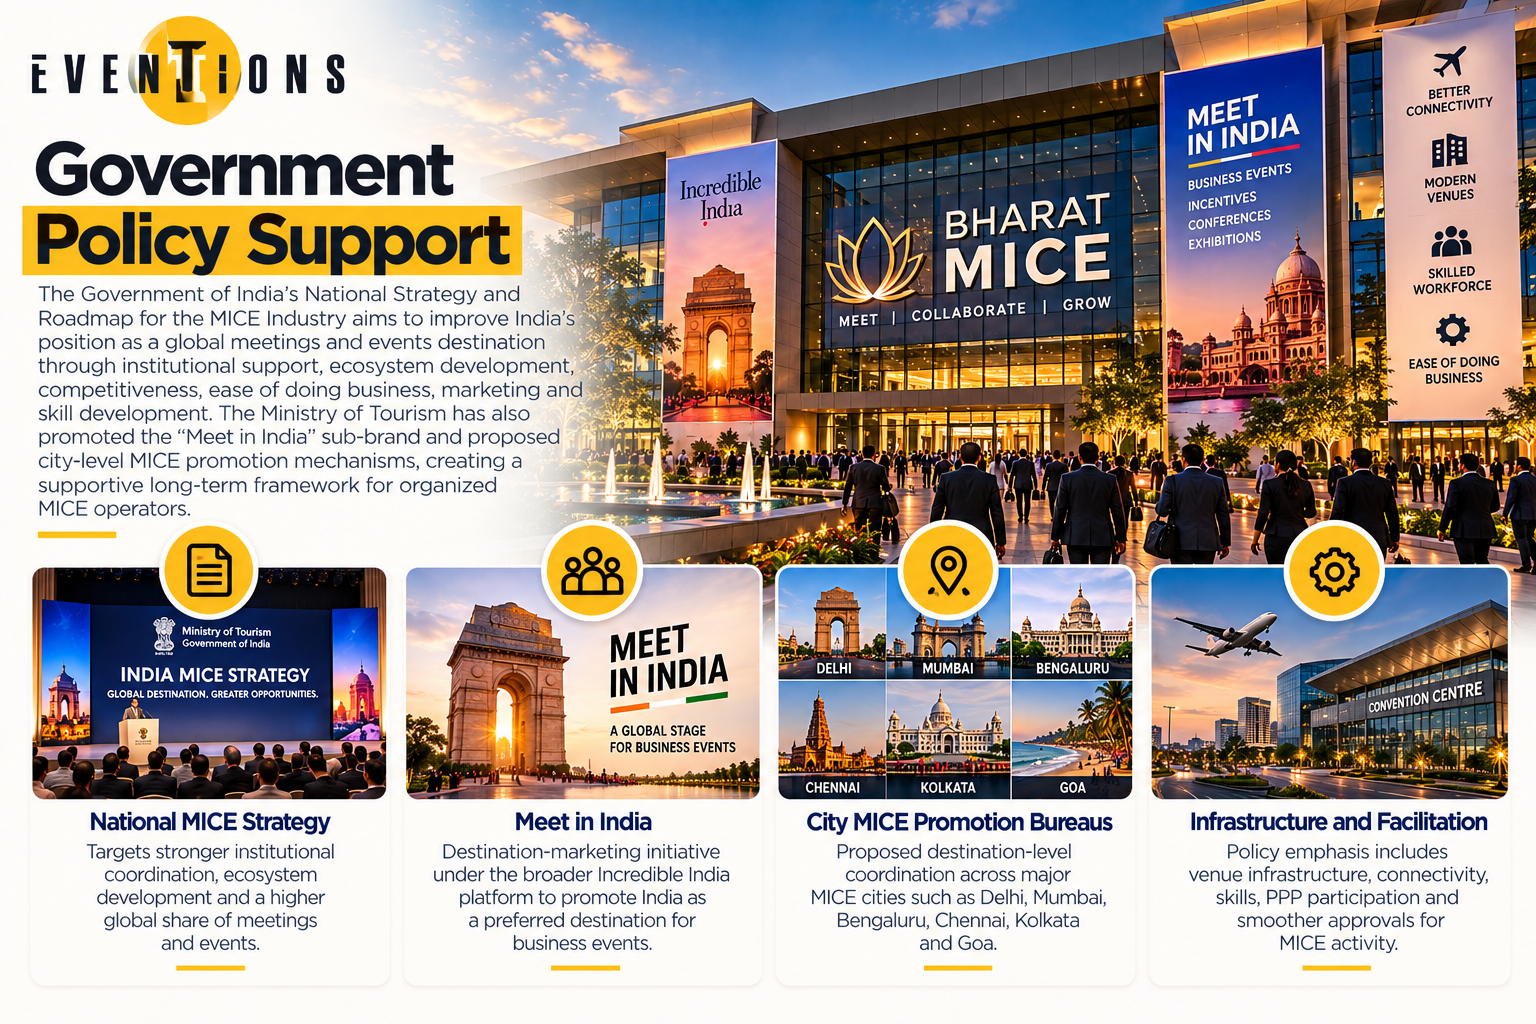
Government Policy Support
The Government of India's National Strategy and Roadmap for the MICE Industry aims to improve India's position as a global meetings and events destination through institutional support, ecosystem development, competitiveness, ease of doing business, marketing and skill development. The Ministry of Tourism has also promoted the "Meet in India" sub-brand and proposed city-level MICE promotion mechanisms, creating a supportive long-term framework for organized MICE operators.
The key policies are:
National MICE Strategy: targets stronger institutional coordination and a higher global share of meetings and events
Meet in India: Destination-marketing initiative under the broader Incredible India platform to promote India for business events
City MICE Promotion Bureaus: Proposed destination-level coordination across major MICE cities such as Delhi, Mumbai, Bengaluru, Chennai, Kolkata and Goa
Infrastructure and facilitation: Policy emphasis includes venue infrastructure, connectivity, skills, PPP participation and smoother approvals for MICE activity
Fundraise/Future Plans
Shareholding
Pre-issue shareholding
Promoter Holding 0.0%
Post-Issue Shareholding
Promoter Holding 0.0%
Category
Pre-Issue%Post-Issue%
Promoters
Cristoo Arora
49.0%36.0%
Ravi Rajak
50.0%36.8%
Kirat Ahluwalia
0.4%0.3%
Malti Verma
0.5%0.4%
Vincy Arora
0.1%0.1%
Total Promoter Holding
100.0%73.6%
Additional Shareholders
Other Shareholders
0.0%26.5%
Total Additional Holding
0.0%26.5%
Total Shareholding
100.0%100.1%
- Overview
- Business
- Financial Highlights
- Industry Overview
- Fundraise/Future Plans
- Documentation
Get the Preqt App and keep in touch around the clock!
 Monitor your investments in real-time.
- Receive tailored deal suggestions.
- Get real-time updates and alerts.
