

Evergreen Recyclekaro (India) Limited
Recycling Resources, Renewing ValueRecovering Value Responsibly
Unlisted Review and Rating
Speculative
DRHP Not FiledOverall Recommendation
Evergreen Recyclekaro has delivered excellent growth, healthy margins, strong ROE and operates in a structurally attractive recycling industry. However, two consecutive years of negative operating cash flow, rapidly increasing inventory and receivables, intense competition for feedstock, future dilution and a highly terminal-dependent valuation materially reduce the margin of safety. The company would become more attractive after audited FY26–FY27 results demonstrate positive cash conversion and meaningful progress toward the valuation report’s aggressive forecasts
PARAMETER
WEIGHT
SCORE
KEY FACTORS
Financial Performance
25.0%
4.0/5
Exceptional revenue and profit growth, healthy margins and ROE are undermined by persistent, increasingly negative working-capital cash flow
Show more
Detailed Analysis
Revenue increased 74.6%, from INR 125.3 crore in FY24 to INR 218.78 crore in FY25; ten-month FY26 provisional revenue reached INR 298.94 crore
Core FY25 EBITDA was approximately INR 36.5 crore, producing a strong 16.7% margin after excluding other income and prior-period items
FY25 PAT of INR 22.3 crore represented a healthy 10.2% margin and increased 136.9% year-on-year
Borrowings of INR 49.7 crore against ₹117.61 crore equity produced a moderate 0.4× gross D/E ratio
PAT on average FY24–FY25 equity resulted in an excellent ROE of approximately 26.0
Industry
25.0%
3.0/5
Recycling enjoys excellent structural demand and policy support, but competition, feedstock availability, commodity volatility and regulatory intervention remain substantial
Show more
Detailed Analysis
Indian e-waste generation increased 11.5%, while estimated formally processed volume increased approximately 27%, battery recycling also has a strong structural outlook
Environmental permissions, EPR certificates, recycling targets, safety requirements and regulated certificate pricing create substantial compliance risk
No meaningful export revenue was disclosed; operations remain dependent on Indian feedstock, customers and regulation
Management
25.0%
5.0/5
Low RPTs, limited litigation and improved board independence support governance, although the independent-board track record remains short
Show more
Detailed Analysis
The Company has operated since December 2010, providing approximately 15 years of recycling-sector experience
Three of six directors at the valuation date were independent
Gross disclosed RPTs were approximately INR 2.8 crore, or around 1.3% of FY25 revenue
Valuation Metrics
25.0%
1.0/5
The ₹1,590 crore DCF valuation is terminal-value dependent and implies expensive earnings, book and EBITDA multiples
Show more
Detailed Analysis
Low RPTs, limited litigation and improved board independence support governance, although the independent-board track record remains
Implied EV/EBITDA is approximately 40–49×, depending on annualisation, versus the valuer’s peer average of 24.4x
Price/provisional January 2026 book value is approximately 9.0×, despite negative operating cash flow
TOTAL
100%
3.3/5
Weighted Composite Score
Per Share Price
₹1000000.0
As of 14 Oct 2026
Lot Size
1.0 Shares
Minimum Investment
₹10,00,000.0 / 1 shares
Market Cap. (₹ Cr)
Revenue FY’25
PAT FY’25
P/E Multiple
Face Value
₹ 10.0Offer Price
₹ 10,24,995.0Lot Size
1.0 sharesSale Type
Secondary SalePAT FY’25
₹ 22.3 CrPAT Margin (%)
10.2 %P/E Multiple
71.4xCAGR Growth 2Y
74.6 %ROE (FY’25)
18.9 %ROCE (FY’25)
23.8 %Price to Book Value ratio
14.0xMerchant banker appointed
❌ NoCompany Website
www.recyclekaro.comDisclaimer: Unlisted shares are unregulated & illiquid. This is NOT investment advice. Please do your own due diligence before investing.
Minimum Investment
₹10,00,000.0 / 1 sharesShares Lot 1 X 1
Investment amount
₹10,00,000.0
Overview
Business
Business Model
Geographical Presence
Sales Channel
Financial Highlights
Income Statement
Revenue growth with EBITDA and PAT margins
| Financial Metric | FY 2024 | FY 2025 |
|---|---|---|
| Revenue (₹ Cr) | 125.3 | 218.8 |
| Growth (%) | 0.0% | 74.6% |
| EBITDA (₹ Cr) | 18.4 | 37.8 |
| EBITDA Margin (%) | 14.7% | 17.3% |
| PAT (₹ Cr) | 9.4 | 22.3 |
| PAT Margin (%) | 7.5% | 10.2% |
OBSERVATIONS & INSIGHTS
Revenue increased by ₹93.5 Cr to ₹218.8 Cr, reflecting rapid scaling across the consolidated recycling platform
The EBITDA proxy more than doubled and margin expanded by 2.6 percentage points, indicating that fixed processing and employee costs were absorbed over a larger revenue base
PAT rose 137.0% to ₹22.3 Cr and PAT margin improved to 10.2%, outpacing revenue growth
Finance cost increased to ₹5.4 Cr as short-term borrowings expanded, partly offsetting the benefit of better operating margins
Balance Sheet
| Financial Metric | FY 2024 | FY 2025 |
|---|---|---|
| EQUITY & LIABILITIES | ₹ 123.0 Cr | ₹ 241.1 Cr |
| Net Worth | ₹ 53.9 Cr | ₹ 146.8 Cr |
| Share Capital | ₹ 0.0 Cr | ₹ 0.0 Cr |
| Reserves & Surplus | ₹ 53.9 Cr | ₹ 146.8 Cr |
| Total Liabilities | ₹ 69.1 Cr | ₹ 94.3 Cr |
| Current Liabilities | ₹ 66.4 Cr | ₹ 92.6 Cr |
| Borrowings | ₹ 27.8 Cr | ₹ 48.4 Cr |
| Trade Payables | ₹ 30.4 Cr | ₹ 29.7 Cr |
| Other Current Liabilities | ₹ 8.2 Cr | ₹ 14.5 Cr |
| Non-Current Liabilities | ₹ 2.7 Cr | ₹ 1.7 Cr |
| Borrowings | ₹ 2.6 Cr | ₹ 1.3 Cr |
| Other Non-Current Liabilities | ₹ 0.1 Cr | ₹ 0.4 Cr |
| ASSETS | ₹ 123.1 Cr | ₹ 241.2 Cr |
| Current Assets | ₹ 93.0 Cr | ₹ 204.7 Cr |
| Trade Receivables | ₹ 34.6 Cr | ₹ 66.6 Cr |
| Inventory | ₹ 39.9 Cr | ₹ 81.6 Cr |
| Cash & Cash Equivalents | ₹ 0.3 Cr | ₹ 35.4 Cr |
| Other Current Assets | ₹ 18.2 Cr | ₹ 21.1 Cr |
| Non-Current Assets | ₹ 30.1 Cr | ₹ 36.5 Cr |
| Fixed Assets | ₹ 27.8 Cr | ₹ 31.7 Cr |
| Other Non-Current Assets | ₹ 2.3 Cr | ₹ 4.8 Cr |
OBSERVATIONS & INSIGHTS
Total assets nearly doubled to ₹241.1 Cr, reflecting a step-change in the scale of the Group
Reserves increased to ₹117.6 Cr and ₹29.2 Cr of share-application money was pending allotment, providing capital for expansion
Inventory and receivables together represented ₹148.2 Cr, or 61.5% of total assets
Current borrowings rose to ₹48.4 Cr, while non-current borrowings declined to ₹1.3 Cr, shifting funding toward shorter maturities
Cash increased to ₹35.4 Cr after ₹84.6 Cr of financing inflows, not because of operating cash generation
Fixed assets increased to ₹31.7 Cr, considerably less than the growth in current assets, showing that scale absorbed more working capital than plant investment during FY25
Cash Flow
| Financial Metric | FY 2024 | FY 2025 |
|---|---|---|
CFO (₹ Cr) Cash generated from core business operations. | -8.8 Cr | -39.8 Cr |
CFI (₹ Cr) Cash used for investments and long-term assets. | -3.0 Cr | -9.8 Cr |
CFF (₹ Cr) Cash flow related to funding and borrowings. | +12.1 Cr | +84.6 Cr |
Financial Ratios
Measures the company’s leverage relative to shareholder equity.
OBSERVATIONS & INSIGHTS
ROE and ROA increased as PAT growth outpaced the rise in closing shareholders’ wealth and assets
ROCE reduced to 23.8% because share-application money and long-term capital increased faster than EBIT
Debt-to-equity fell to 0.4x even though total borrowings increased, because reserves and fresh funding expanded more rapidly
Interest coverage improved to 6.5x, but the calculation is accounting-based and does not offset negative operating cash flow
Industry Overview
Industry Drivers
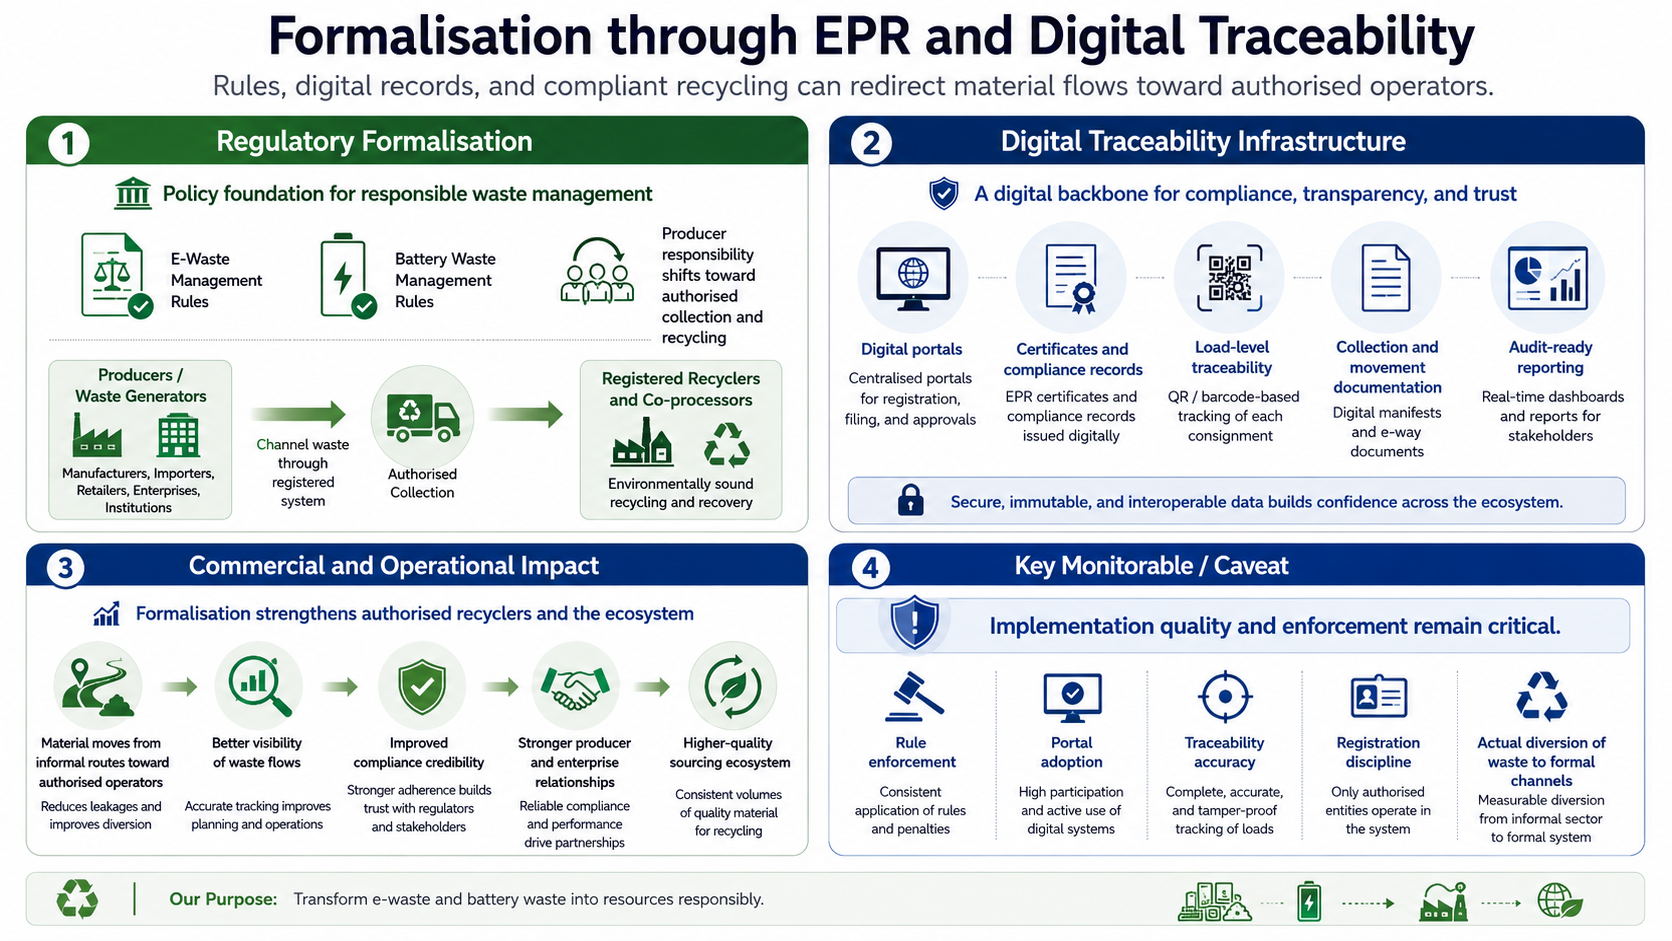
Formalisation through EPR and digital traceability
The E-Waste Management Rules and Battery Waste Management Rules move responsibility toward producers and registered recyclers
Digital portals, certificates and load-level traceability can shift material toward authorised operators, but implementation quality and enforcement remain critical
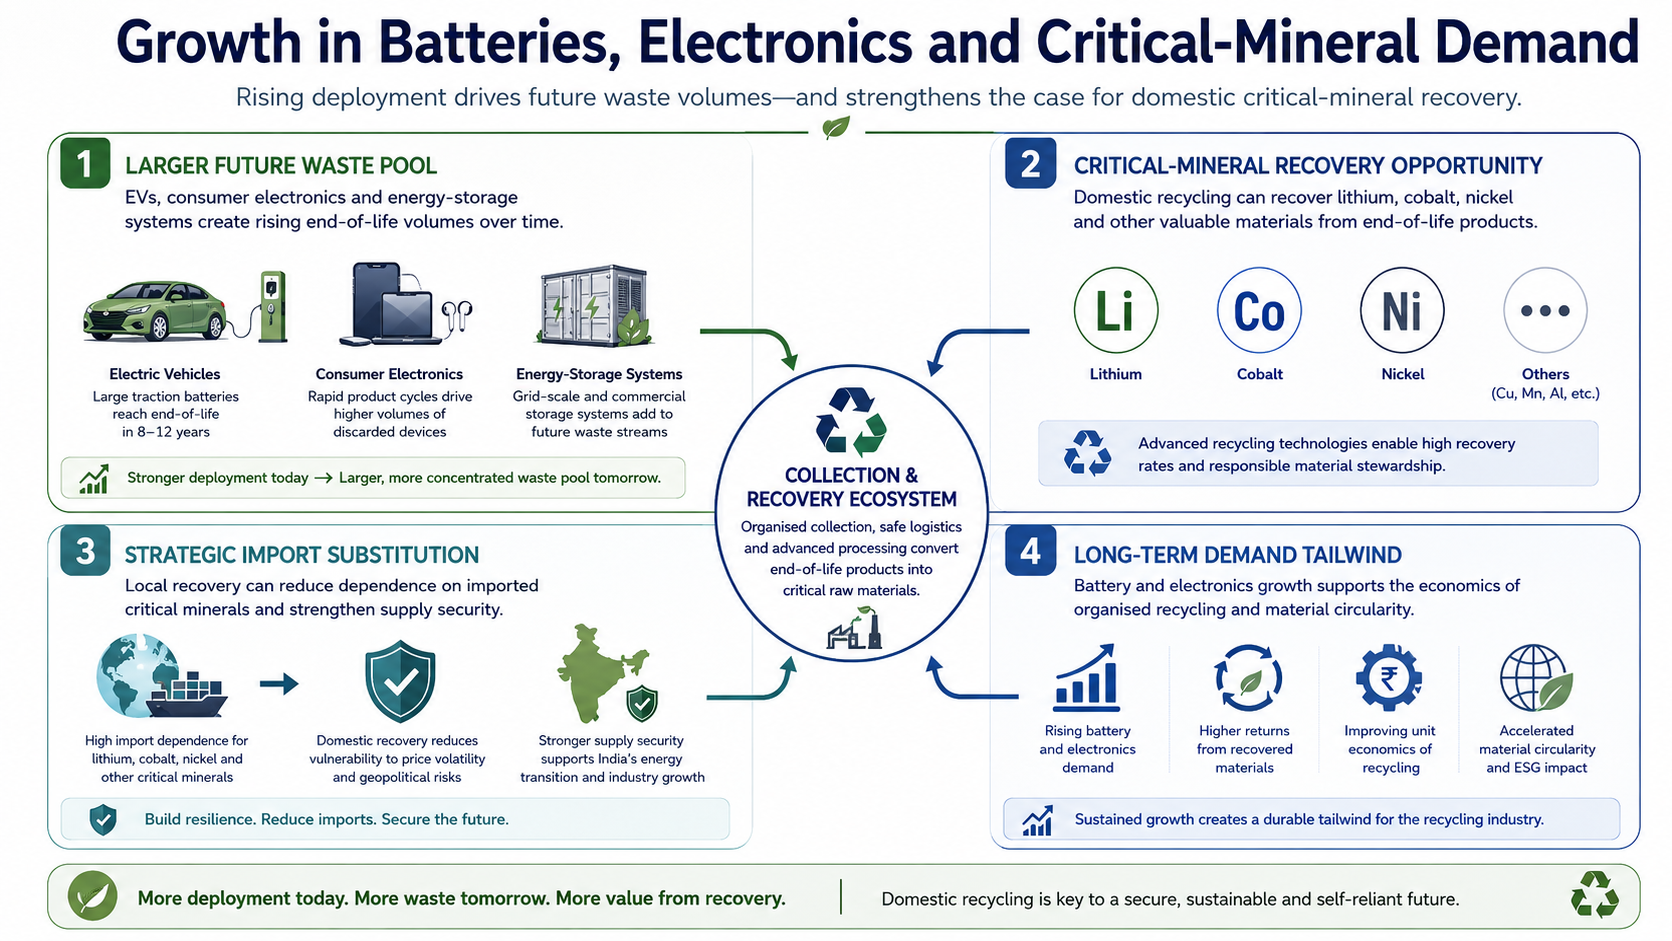
Growth in batteries, electronics and critical-mineral demand
Higher deployment of electric vehicles, consumer electronics and energy-storage systems expands the future waste pool
At the same time, import dependence for lithium, cobalt, nickel and other critical minerals raises the strategic value of domestic recovery
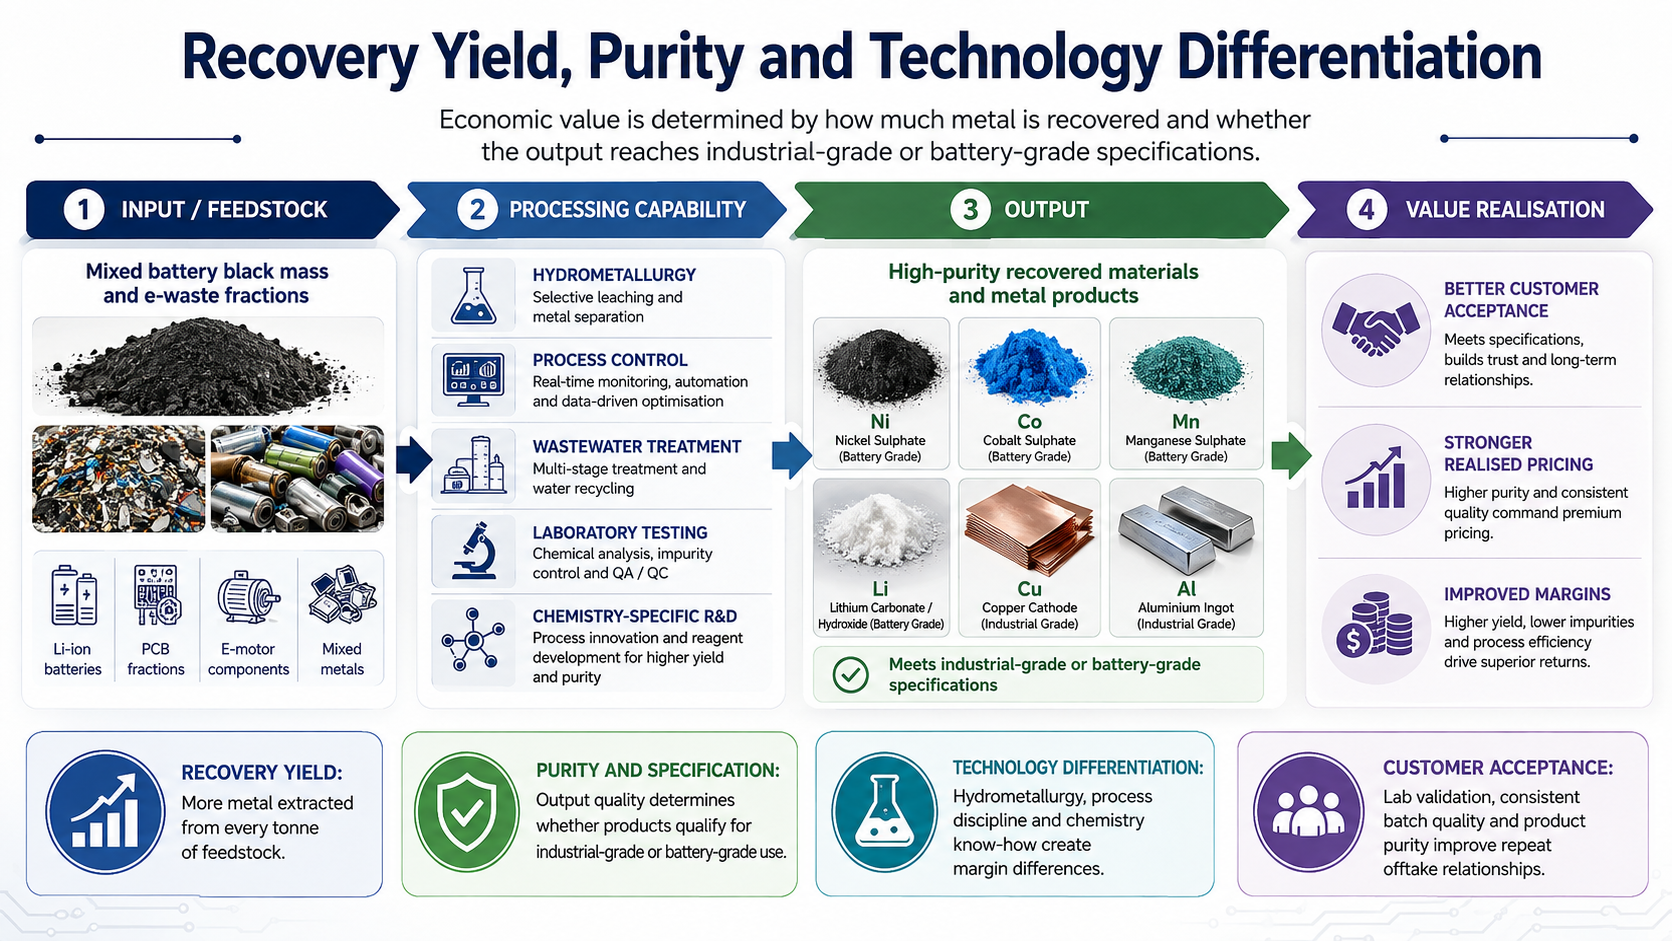
Recovery yield, purity and technology differentiation
Economic value is determined by how much metal is recovered and whether the output reaches industrial or battery-grade specifications
Hydrometallurgy, process control, wastewater treatment, laboratory testing and chemistry-specific R&D can create material differences in margin and customer acceptance
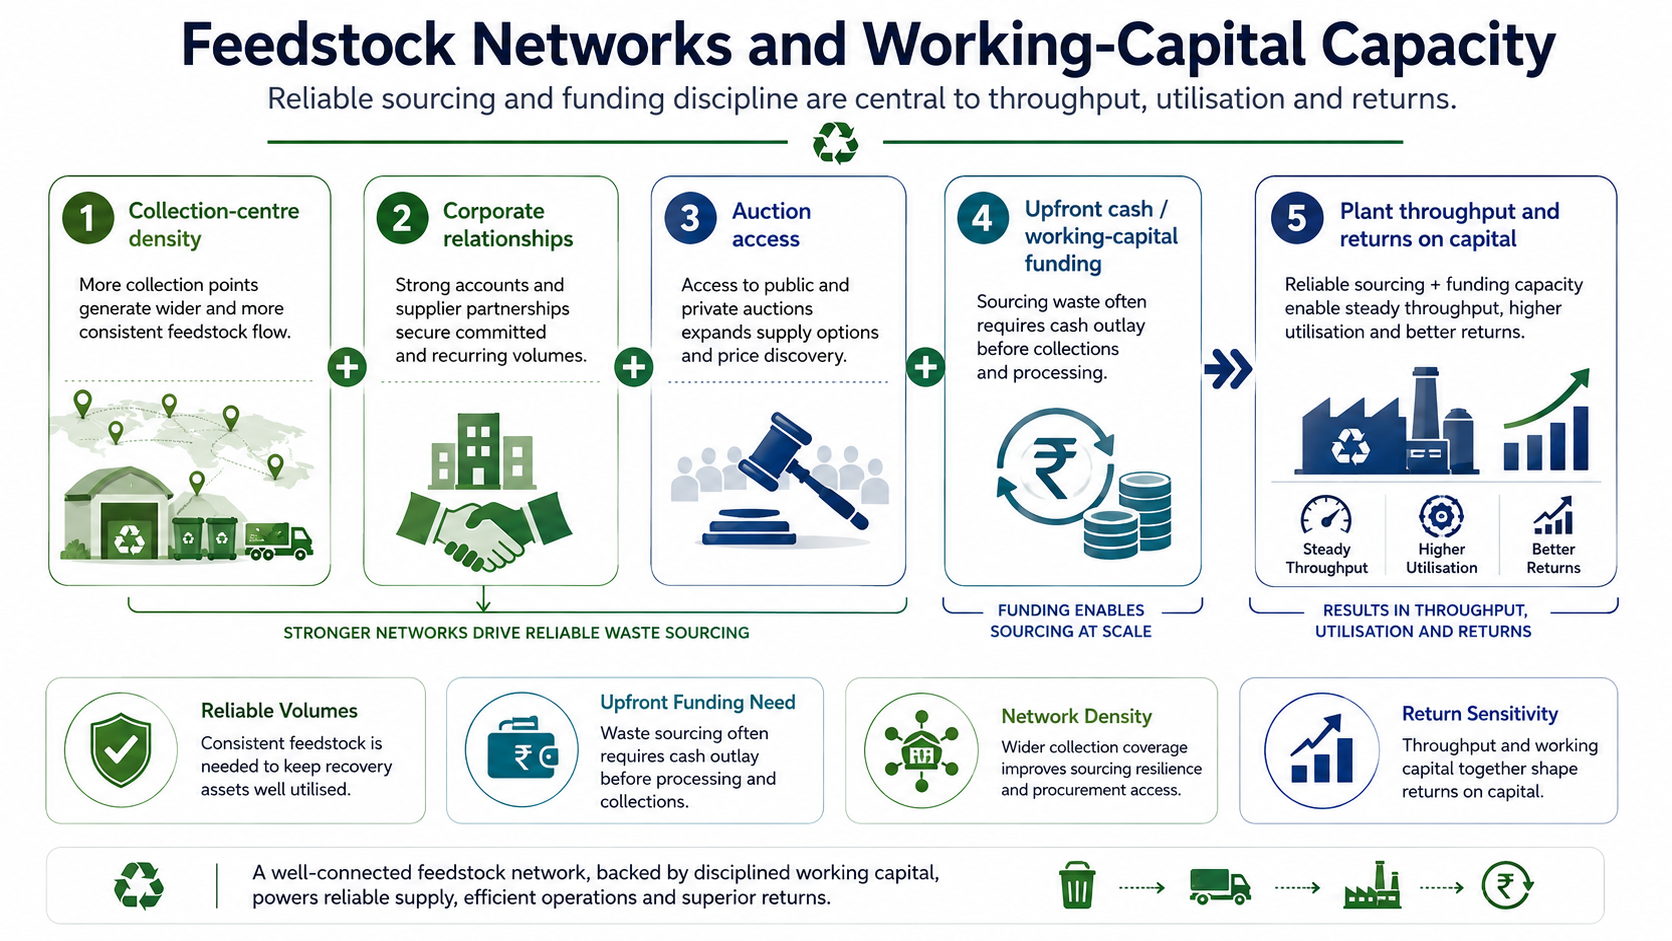
Feedstock networks and working-capital capacity
Recycling plants need reliable volumes to achieve utilisation targets, yet waste sourcing frequently requires upfront cash
Collection-centre density, corporate relationships, auction access and funding capacity therefore influence both throughput and returns on capital
Government Policy Support
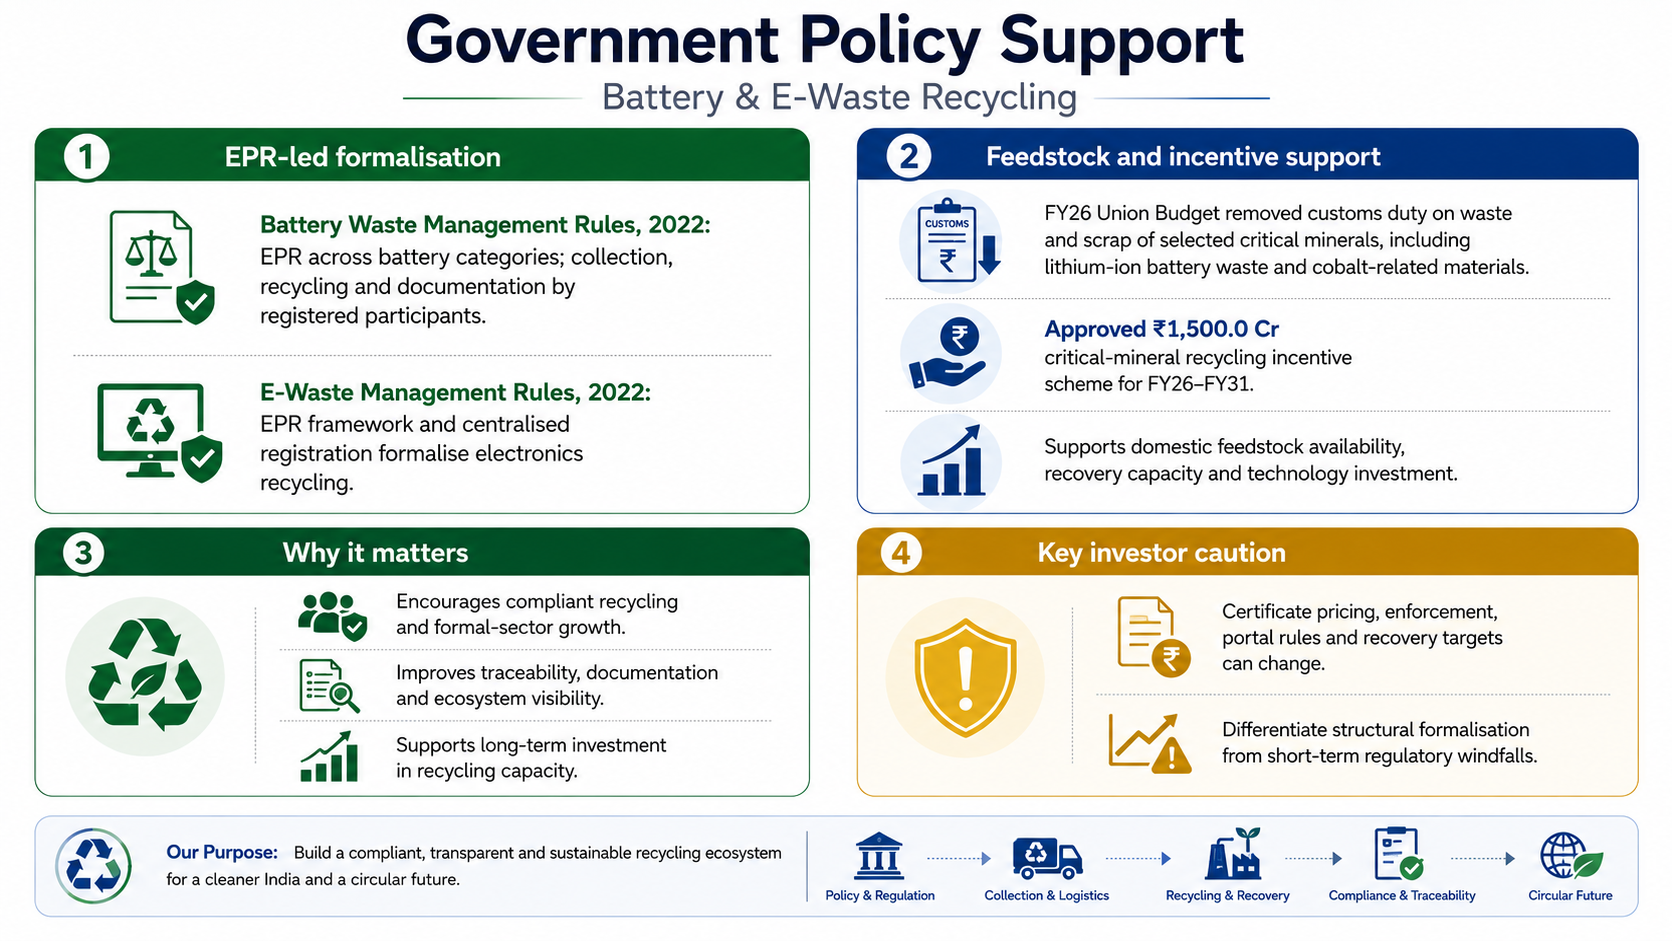
The Battery Waste Management Rules, 2022 establish extended producer responsibility across battery categories and require registered participants to manage collection, recycling and documentation. The E-Waste Management Rules, 2022 similarly use an EPR framework and centralised registration to formalise electronics recycling
The Union Budget for FY26 removed customs duty on waste and scrap of selected critical minerals, including lithium-ion battery waste and cobalt-related materials, to improve domestic feedstock availability. The Government has also approved a ₹1,500.0 Cr critical-mineral recycling incentive scheme for FY26-FY31, supporting recovery capacity and technology investment
Policy support creates demand for compliant recycling, but certificate pricing, enforcement, portal rules and recovery targets can change. Investors should distinguish structural formalisation from short-term regulatory windfalls
Fundraise/Future Plans
Shareholding
Pre-issue shareholding
Promoter Holding 0.0%
Category
Pre-Issue%
Promoters
0.0%
Total Promoter Holding
0.0%
Additional Shareholders
0.0%
Total Additional Holding
0.0%
Total Shareholding
0.0%
- Overview
- Business
- Financial Highlights
- Industry Overview
- Fundraise/Future Plans
- Documentation
Get the Preqt App and keep in touch around the clock!
 Monitor your investments in real-time.
- Receive tailored deal suggestions.
- Get real-time updates and alerts.
