


Fusion CX
Engagement That Builds LoyaltyExperience Powered by Intelligence
IPO Summary (PreQT)
Fusion CX Limited operates technology-enabled business-process and customer-experience (CX) services, including inbound and outbound customer support, technical support, email/chat, digital engagement and AI data-infrastructure offerings. It serves enterprise clients through a global onshore, nearshore and offshore delivery network. FY26 revenue grew 36.8% to INR 1,818.1 Cr; EBITDA increased to INR 329.9 Cr at 18.1%, while PAT reached INR 169.8 Cr at 9.3%. Revenue growth reflects both acquisitions and customer wins, and therefore should not be presented as wholly organic. The INR 702.0 Cr mainboard IPO at the cap comprises INR 500.0 Cr fresh capital and INR 202.0 Cr promoter OFS. Proceeds for debt repayment and technology upgrades add financial flexibility; North American revenue exposure, client concentration and acquired goodwill remain fundamental underwriting questions
IPO Review Rating
Above Avg
MainboardPowering Better Customer Experiences Through People, Technology, and Intelligence
Fusion CX presents a strong growth and profitability profile, with revenue reaching INR 1,818.1 Cr, PAT of INR 169.8 Cr, improving margins, strong cash conversion and a 30.7% RoNW. Valuation at 24.6x post-issue P/E and 13.2x EV/EBITDA appears broadly reasonable relative to listed CX/BPM peers, while the INR 275.7 Cr debt repayment should further strengthen the balance sheet.
Key risks include the 30.1% largest-customer concentration, 85.3% North American revenue dependence, acquisition-led expansion and ongoing litigation. The issue also includes an INR 202.0 Cr promoter OFS. GMP has weakened materially to around 8.7%, making anchor participation and QIB subscription particularly important.
Overall, the fundamentals remain attractive, but institutional demand should be monitored before taking an aggressive view.
PARAMETER
WEIGHT
SCORE
KEY FACTORS
Financial Performance
40.0%
4.0/5
Fusion CX demonstrates strong revenue and PAT growth, sustained margin expansion, improving leverage, high return ratios and strong cash conversion. These positives are partly offset by acquisition-led growth and meaningful dependence on its largest customer.
Show more
Detailed Analysis
Revenue increased from INR 991.3 Cr in FY24 to INR 1,329.3 Cr in FY25 and INR 1,818.1 Cr in FY26, representing a strong two-year CAGR of approximately 35.4%, although acquisitions have contributed to part of the expansion
EBITDA increased from INR 104.6 Cr in FY24 to INR 329.9 Cr in FY26, while EBITDA margin expanded consistently from 10.6% to 18.1%, demonstrating substantial improvement in operating leverage
PAT increased from INR 36.3 Cr in FY24 to INR 169.8 Cr in FY26, while PAT margin expanded from 3.7% to 9.3%, indicating significant improvement in bottom-line profitability
Debt-to-equity improved from approximately 0.8x in FY24 and 0.9x in FY25 to 0.5x in FY26, while FY26 net debt-to-equity stood at approximately 0.3x, indicating a substantially stronger leverage position
ROE improved consistently from 13.4% in FY24 to 20.7% in FY25 and 30.3% in FY26, demonstrating increasingly efficient utilisation of shareholder capital
Operating cash flow increased from INR 39.3 Cr in FY24 to INR 102.4 Cr in FY25 and INR 264.2 Cr in FY26, materially exceeding FY26 PAT and indicating strong cash conversion
The largest customer contributed 30.1% of FY26 revenue, while the top ten customers contributed 52.2%, creating meaningful dependence on a limited number of large customer relationships
Industry
15.0%
4.0/5
Fusion operates in an attractive digital CX segment benefiting from AI, automation and omnichannel adoption. Its global network provides scalability, although competition, AI-driven disruption, data regulation and significant North American revenue concentration remain important industry risks
Show more
Detailed Analysis
The digital CX industry is projected to grow at approximately 19.0% CAGR during 2025–2027, providing a strong structural growth opportunity for technology-enabled CX providers
Traditional voice-led outsourcing is relatively mature, while digital, omnichannel, analytics and AI-enabled CX services remain in a structural growth phase
Fusion operates across multiple jurisdictions and processes sensitive customer information, creating meaningful exposure to data-protection, cybersecurity, outsourcing and privacy regulations
Management
15.0%
4.0/5
Fusion benefits from experienced promoters, 50.0% Board independence, zero promoter pledge and high continuing promoter ownership. Governance deductions primarily arise from ongoing litigation, acquisition-related disputes and the complexity of related-party and subsidiary transactions across its global structure.
Show more
Detailed Analysis
Pankaj Dhanuka and Kishore Saraogi possess approximately 22 years and 27 years of CX/BPO experience, respectively, providing substantial operating and sector expertise
Four of the Company's eight Directors are Independent Directors, resulting in 50.0% Board independence
No promoter or promoter-group shares are pledged or encumbered, although certain material civil, tax and acquisition-related proceedings remain outstanding
Related-party activity includes promoter/KMP remuneration and intra-group transactions across the Company's international subsidiary structure, while FY26 KMP remuneration was approximately INR 12.0 Cr
Valuation
20.0%
3.0/5
Fusion's P/E and EV/EBITDA are broadly reasonable relative to listed peers and supported by strong RoNW. However, historical P/B remains elevated, while the sharp decline in GMP indicates that pre-issue sentiment has weakened considerably
Show more
Detailed Analysis
Fusion's 24.6x post-issue P/E is 7.8% below the 26.7x peer average, although it remains above the peer median
Fusion's 13.2x EV/EBITDA is approximately 9.1% below the current 14.5x comparable average and broadly in line with the median
The issue is valued at 6.6x FY26 historical book value, although fresh-capital accretion reduces approximate post-issue P/B to around 4.0x
Fusion generated a strong FY26 RoNW of 30.7%, providing meaningful fundamental support to the valuation
Merchant Banker Track Record
10.0%
4.0/5
Fusion CX has a highly experienced three-BRLM consortium with substantial Mainboard execution capability. Recent listing outcomes are positive overall but not uniformly strong, while historical subscription averages are not disclosed in the RHP and remain unscored
Show more
Detailed Analysis
The three BRLMs' latest disclosed IPO samples generated positive average listing performance, with Motilal Oswal and IIFL demonstrating stronger opening-day outcomes than Nuvama
Historical subscription multiples are not disclosed in the RHP's BRLM track-record tables, so this parameter remains pending
Across the latest disclosed samples, positive-listing rates range from 50.0% to 80.0%, with an aggregate observation-level success rate of approximately 63.3%
TOTAL
100%
3.8/5
Weighted Composite Score
Issue Price
₹275.0 to ₹289.0
As of 13 Oct 2026
GMP
₹29.0
As of 13 Oct 2026
Estimated Gain / Loss
+10.0%
Lot Size
51.0 Shares
Grey Market Premium (GMPs) are shared for knowledge purpose only. PrEqt doesn’t promote or execute the trades.
| Issue size | |
|---|---|
| Overall | ₹702.0 Cr |
| Fresh Issue | ₹500.0 Cr |
| Offer for Sale | ₹202.0 Cr |
Minimum Investment
₹14,739.0 / 2,601 shares

Merchant Banker
Nuvama Wealth Management Ltd., IIFL Capital Services, Motilal Oswal Investment Advisors
Nuvama Wealth Management Ltd.
IIFL Capital Services
Motilal Oswal Investment Advisors
IPO Document
Offer Start Date
Offer End Date
Valuation
Revenue (FY'26)
PAT (FY'26)
Issue Size
Face Value
₹ 1.0Offer Price
₹ 289.0Lot Size
51.0 sharesSale Type
Fresh capital cum OFSPAT (FY'26)
₹ 169.8 CrPAT Margin (FY'26)
9.3 %P/E Multiple
24.6xEBITDA (FY'26)
₹ 329.9 CrCAGR Growth 3Y
34.6 %ROE (FY'26)
30.3 %ROCE (FY'26)
71.6 %Price to Book Value
4.0xDebt/Equity
0.5xCompany Website
www.fusioncx.comExplore new deals
Overview
Fund Allocation
Total: ₹0 CrSource:Company DRHP
Timeline
IPO Open Date
To Be Announced
IPO Close Date
To Be Announced
Tentative Allotment
To Be Announced
Initiation of Refunds
To Be Announced
Credit of Shares to Demat
To Be Announced
Tentative Listing Date
To Be Announced
Business
Business Model
Geographical Presence
Sales Channel
Key Risk Factor
Financial Highlights
Income Statement
Revenue growth with EBITDA and PAT margins
| Financial Metric | FY 2024 | FY 2025 | FY 2026 |
|---|---|---|---|
| Revenue (₹ Cr) | 1,021.5 | 1,352.0 | 1,851.8 |
| Growth (%) | - | 34.1% | 36.8% |
| EBITDA (₹ Cr) | 104.6 | 197.8 | 329.9 |
| EBITDA Margin (%) | 10.6% | 14.9% | 18.1% |
| PAT (₹ Cr) | 36.3 | 74.3 | 169.8 |
| PAT Margin (%) | 3.7% | 5.6% | 9.2% |
OBSERVATIONS & INSIGHTS
Revenue: Revenue increased 34.1% in FY25 and 36.8% in FY26, primarily driven by acquisitions of Ready Call Centre, S4 Communication, Scribe.ology and Infinity Outsourcing, alongside onboarding of new customers
EBITDA: EBITDA increased from INR 104.6 Cr in FY24 to INR 329.9 Cr in FY26, supported by acquisition-led revenue growth and operating leverage, as total expenses increased slower than revenue. Margins improved from 10.6% in FY24 to 18.1% in FY26, primarily due to improved cost absorption and a reduction in employee and other expenses as a proportion of revenue
PAT: PAT increased from INR 36.3 Cr in FY24 to INR 169.8 Cr in FY26, supported by higher revenue from acquisitions and new customers, alongside improved operating profitability. Margins improved from 3.7% in FY24 to 9.2% in FY26, as operating profitability increased substantially despite higher finance costs, depreciation and tax expenses
Balance Sheet
| Financial Metric | FY 2024 | FY 2025 | FY 2026 |
|---|---|---|---|
| Net Worth | ₹ 271.1 Cr | ₹ 354.6 Cr | ₹ 552.5 Cr |
| Total Assets | ₹ 768.0 Cr | ₹ 1,143.3 Cr | ₹ 1,385.1 Cr |
| Total Borrowing | ₹ 210.6 Cr | ₹ 306.7 Cr | ₹ 266.9 Cr |
| Reserves & Surplus | ₹ 258.5 Cr | ₹ 345.8 Cr | ₹ 548.0 Cr |
OBSERVATIONS & INSIGHTS
Net Worth: Increased from ₹271.1 Cr in FY24 to ₹552.5 Cr in FY26, more than doubling over two years, indicating a stronger capital base
Total Assets: Grew 80.4% from ₹768.0 Cr to ₹1,385.1 Cr, primarily supported by business expansion, acquisitions and higher goodwill
Borrowings: Declined 13.0% from ₹306.7 Cr in FY25 to ₹266.9 Cr in FY26, reflecting improved leverage despite expanding operations
Reserves & Surplus: Increased from ₹258.5 Cr to ₹548.0 Cr, supported by accumulated earnings and other equity movements, strengthening the company's financial position
Cash Flow
| Financial Metric | FY 2024 | FY 2025 | FY 2026 |
|---|---|---|---|
CFO (₹ Cr) Cash generated from core business operations. | +39.3 Cr | +102.4 Cr | +264.2 Cr |
CFI (₹ Cr) Cash used for investments and long-term assets. | -61.9 Cr | -63.6 Cr | -83.1 Cr |
CFF (₹ Cr) Cash flow related to funding and borrowings. | +11.0 Cr | -26.7 Cr | -138.0 Cr |
Financial Ratios
Measures the company’s leverage relative to shareholder equity.
OBSERVATIONS & INSIGHTS
Current ratio: The current ratio improved from 0.7x in FY25 to 0.9x in FY26, as current assets increased faster than current liabilities, supported by higher cash balances, receivables and loans
Debt / equity: Debt/equity declined from 0.9x in FY25 to 0.5x in FY26, primarily due to repayment of borrowings and an increase in cash balances, alongside higher shareholders' equity
Return on equity: ROE improved from 13.4% in FY24 to 30.3% in FY26, as acquisition-led business expansion and improved profitability resulted in earnings growth exceeding equity growth
Return on capital employed: ROCE increased from 19.6% in FY24 to 71.6% in FY26, driven by higher operating earnings. The RHP's calculation excludes goodwill and intangible assets from capital employed, which materially influences the ratio
Return on assets: ROA improved from 4.7% in FY24 to 13.4% in FY26, as profitability increased faster than the company's asset base, supported by earnings growth from acquisitions and new customers
Interest coverage: Interest coverage improved from 2.9x in FY24 to 5.2x in FY26, as growth in operating earnings outpaced the increase in finance costs.
Industry Overview
Industry Drivers
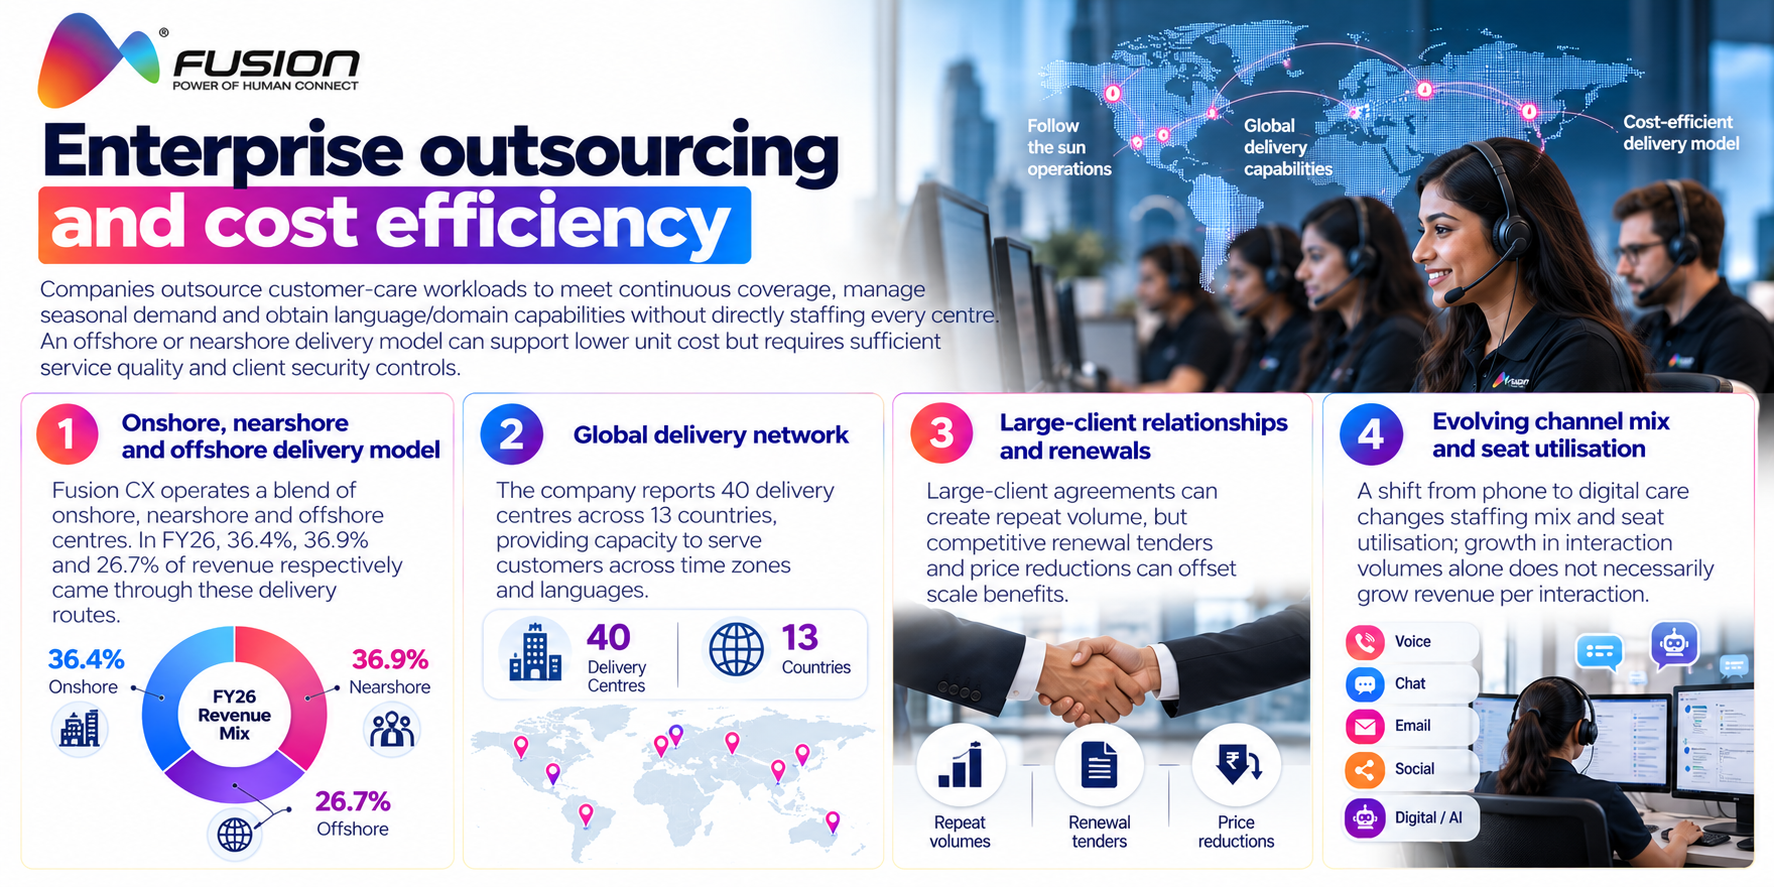
Enterprise outsourcing and cost efficiency
Companies outsource customer-care workloads to meet continuous coverage, manage seasonal demand and obtain language/domain capabilities without directly staffing every centre. An offshore or nearshore delivery model can support lower unit cost but requires sufficient service quality and client security controls.
The key drivers are:
Fusion CX operates a blend of onshore, nearshore and offshore centres; in FY26, 36.4%, 36.9% and 26.7% of revenue respectively came through these delivery routes
The company reports 40 delivery centres across 13 countries, providing capacity to serve customers across time zones and languages
Large-client agreements can create repeat volume, but competitive renewal tenders and price reductions can offset scale benefits
A shift from phone to digital care changes staffing mix and seat utilisation; growth in interaction volumes alone does not necessarily grow revenue per interaction
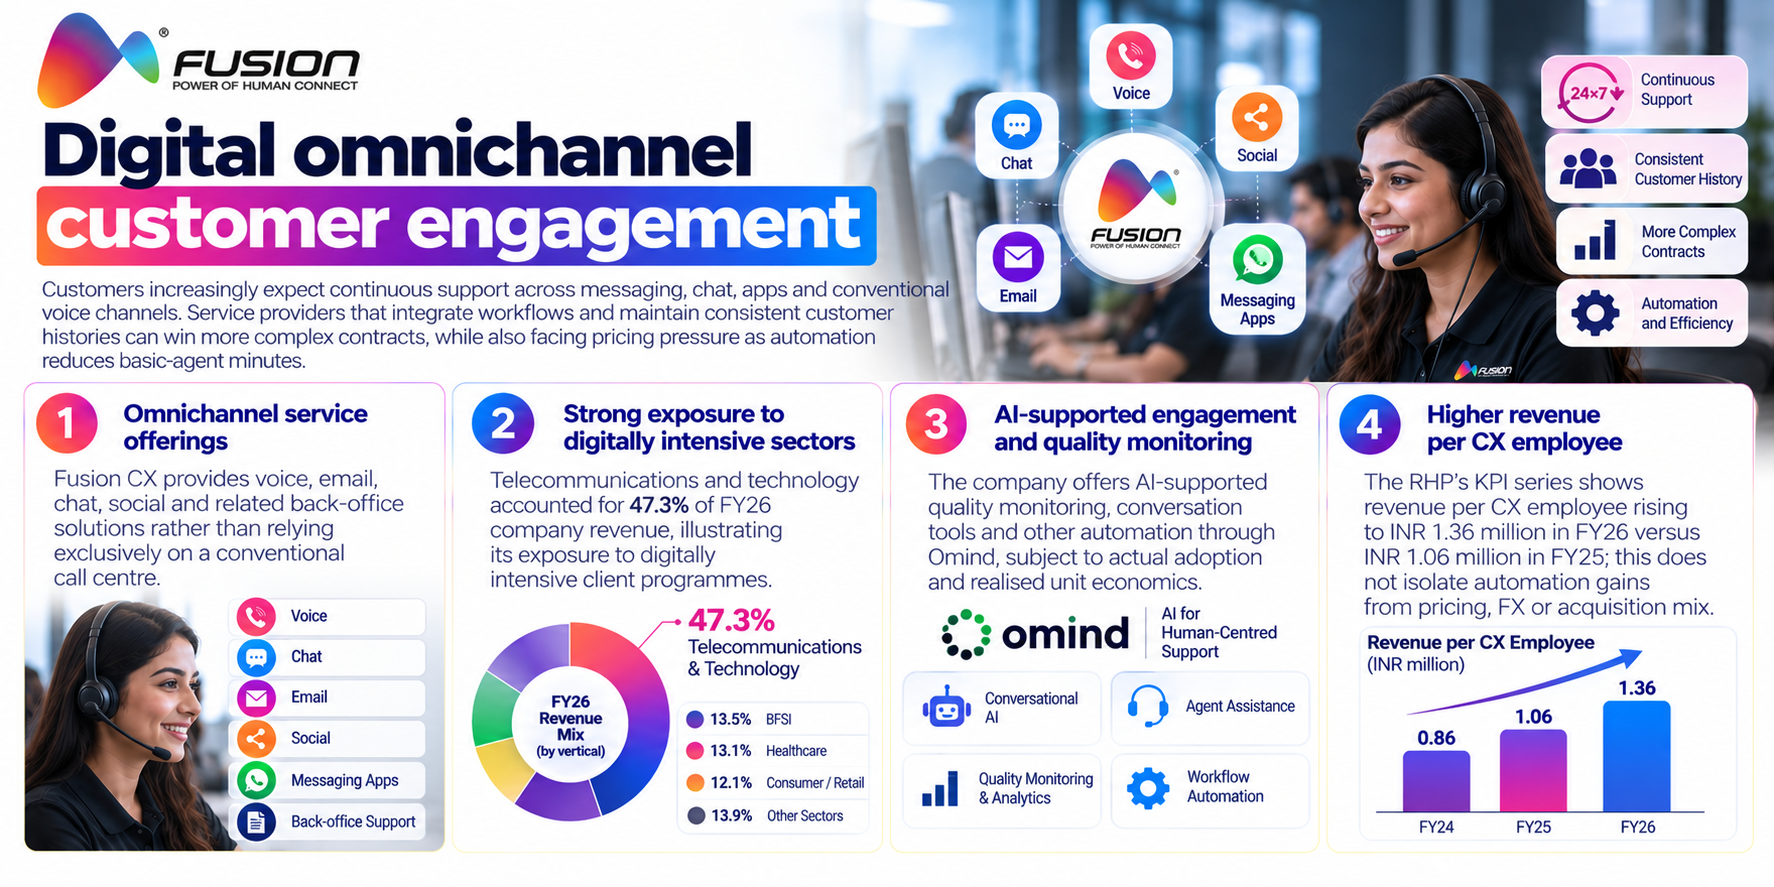
Digital omnichannel customer engagement
Customers increasingly expect continuous support across messaging, chat, apps and conventional voice channels. Service providers that integrate workflows and maintain consistent customer histories can win more complex contracts, while also facing pricing pressure as automation reduces basic-agent minutes.
The key drivers are:
Fusion CX provides voice, email, chat, social and related back-office solutions rather than relying exclusively on a conventional call centre
Telecommunications and technology accounted for 47.3% of FY26 company revenue, illustrating its exposure to digitally intensive client programmes
The company offers AI-supported quality monitoring, conversation tools and other automation through Omind, subject to actual adoption and realised unit economics
The RHP’s KPI series shows revenue per CX employee rising to INR 1.36 million in FY26 versus INR 1.06 million in FY25; this does not isolate automation gains from pricing, FX or acquisition mix
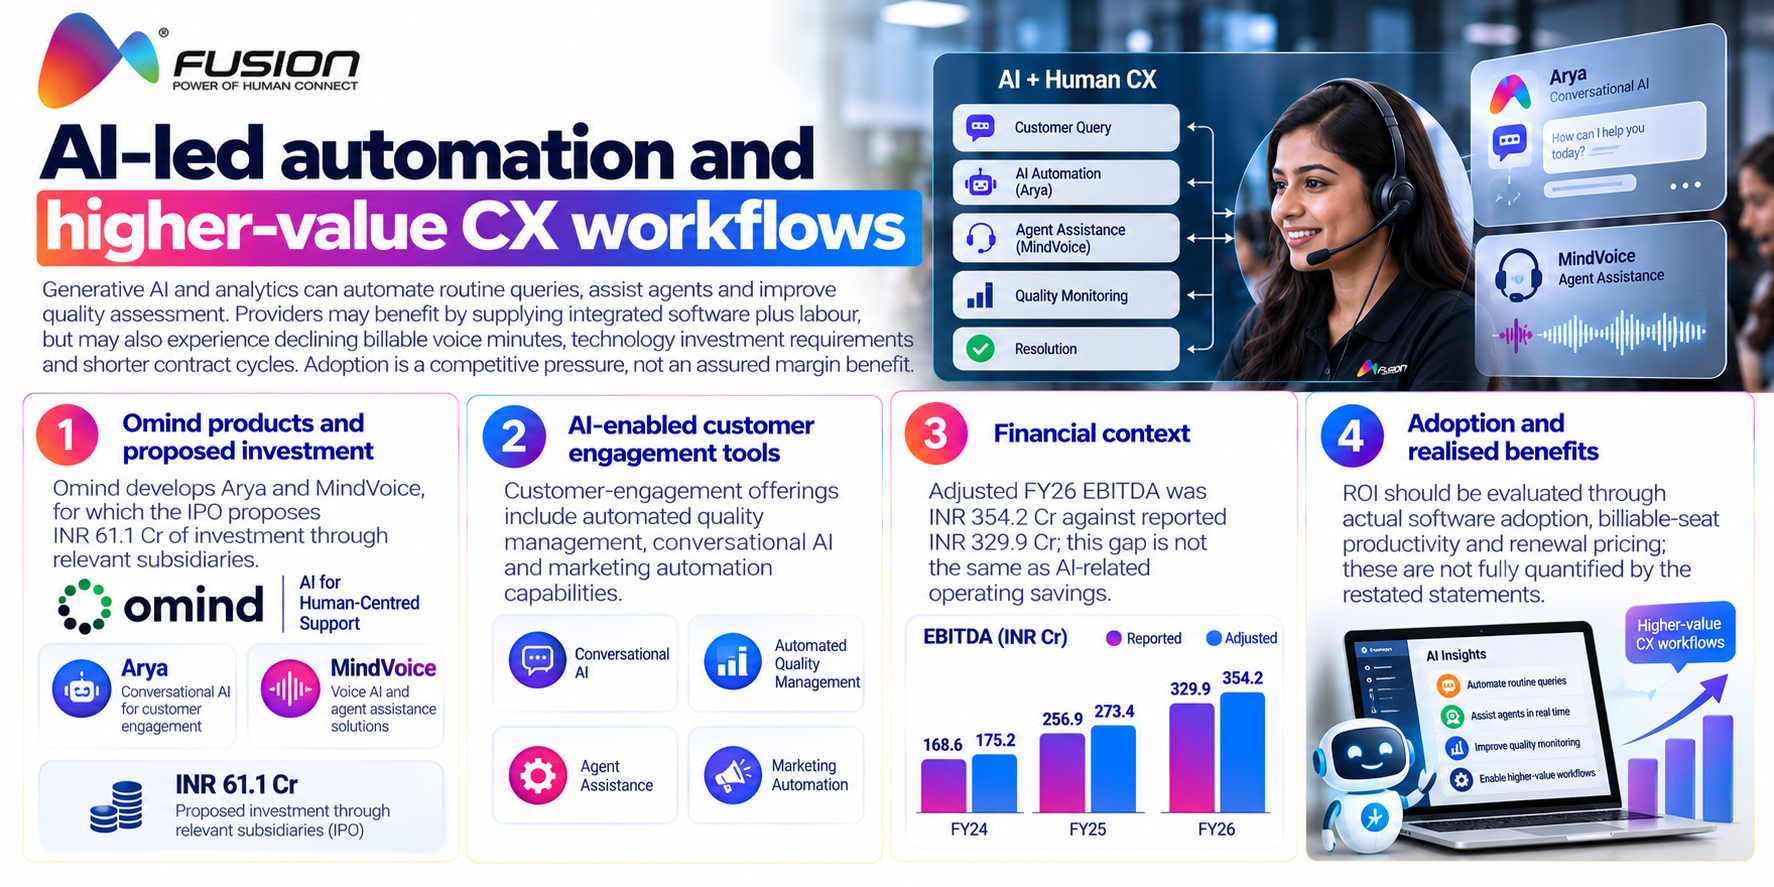
AI-led automation and higher-value CX workflows
Generative AI and analytics can automate routine queries, assist agents and improve quality assessment. Providers may benefit by supplying integrated software plus labour, but may also experience declining billable voice minutes, technology investment requirements and shorter contract cycles. Adoption is a competitive pressure, not an assured margin benefit.
The key drivers are:
Omind develops Arya and MindVoice, for which the IPO proposes INR 61.1 Cr of investment through relevant subsidiaries
Customer-engagement tools include automated quality management, conversational AI and marketing automation offerings
Adjusted FY26 EBITDA was INR 354.2 Cr against reported INR 329.9 Cr; this gap is not the same as AI-related operating savings
ROI should be evaluated through actual software adoption, billable-seat productivity and renewal pricing; these are not fully quantified by the restated statements
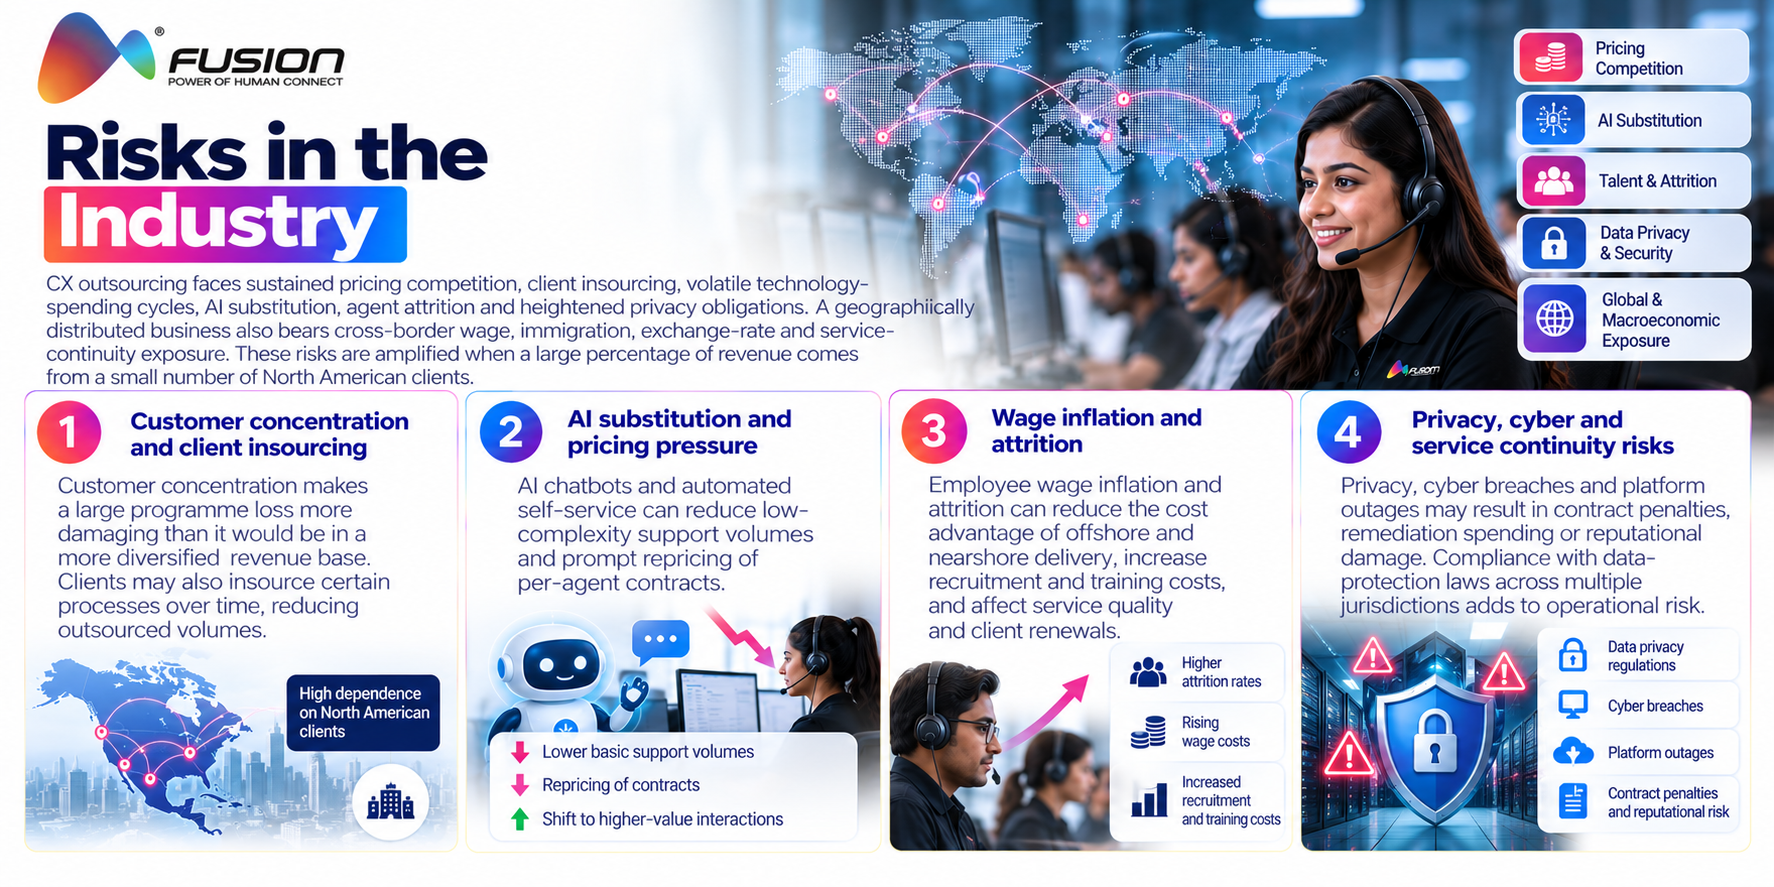
Risks in the Industry
CX outsourcing faces sustained pricing competition, client insourcing, volatile technology-spending cycles, AI substitution, agent attrition and heightened privacy obligations. A geographically distributed business also bears cross-border wage, immigration, exchange-rate and service-continuity exposure. These risks are amplified when a large percentage of revenue comes from a small number of North American clients.
The key risks are:
Customer concentration makes a large programme loss more damaging than it would be in a more diversified revenue base
AI chatbots and automated self-service can reduce low-complexity support volumes and prompt repricing of per-agent contracts
Employee wage inflation and attrition can reduce the cost advantage of offshore and nearshore delivery
Privacy, cyber breaches and platform outages may result in contract penalties, remediation spending or reputational damage
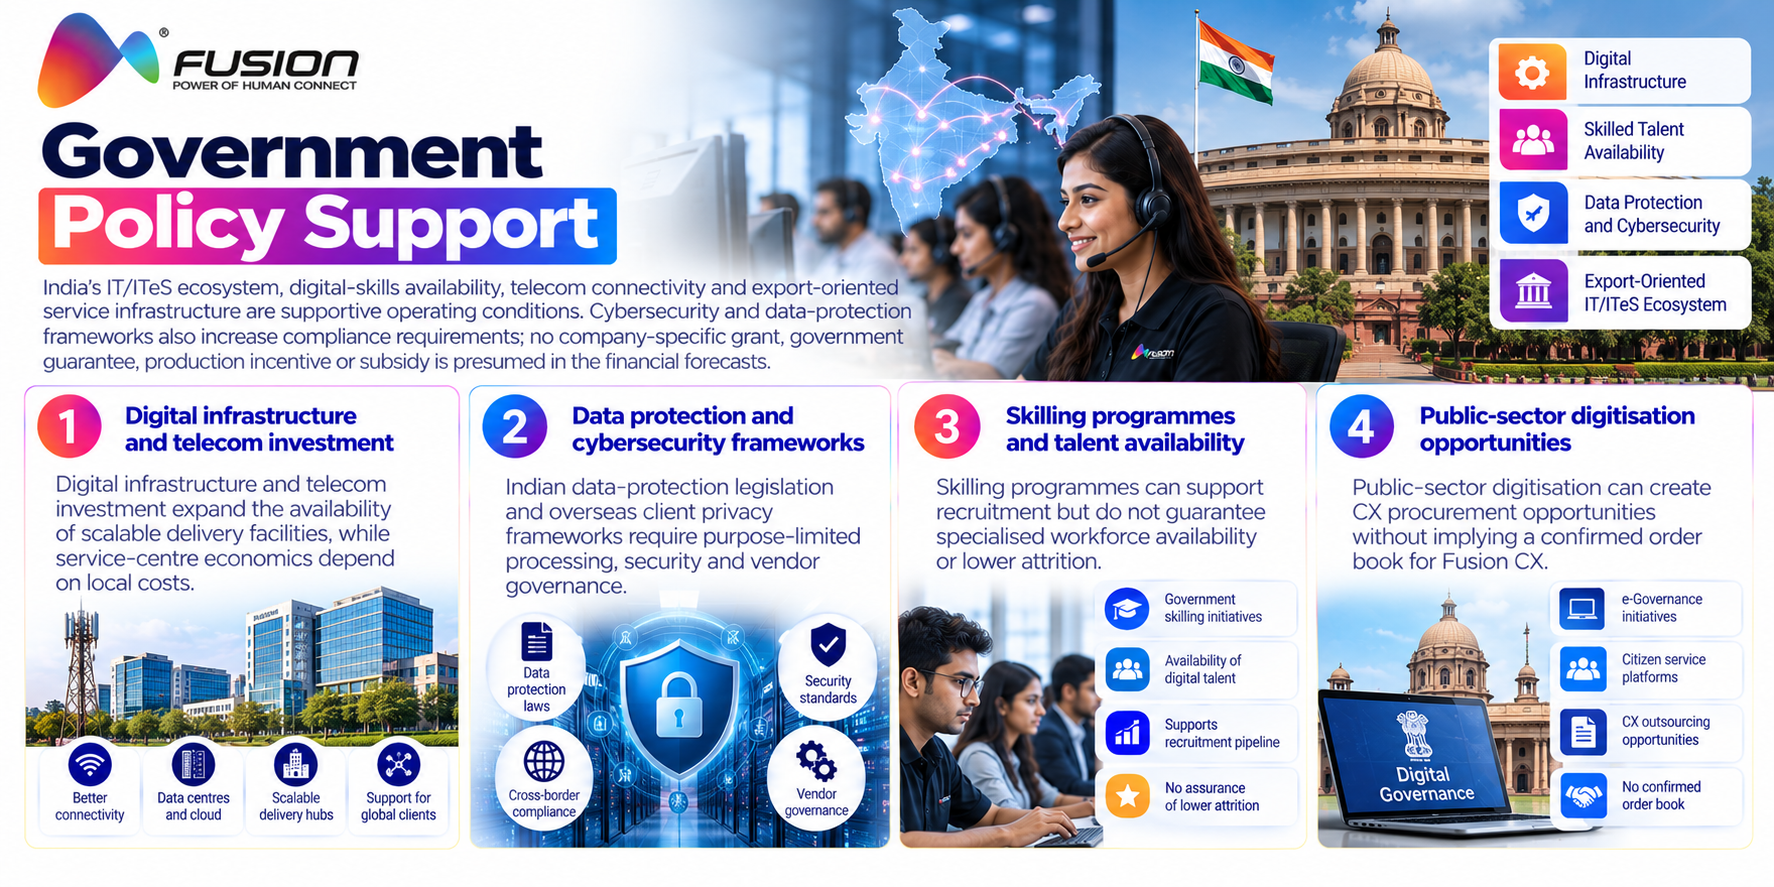
Government Policy Support
India’s IT/ITeS ecosystem, digital-skills availability, telecom connectivity and export-oriented service infrastructure are supportive operating conditions. Cybersecurity and data-protection frameworks also increase compliance requirements; no company-specific grant, government guarantee, production incentive or subsidy is presumed in the financial forecasts.
The key policies are:
Digital infrastructure and telecom investment expand the availability of scalable delivery facilities, while service-centre economics depend on local costs
Indian data-protection legislation and overseas client privacy frameworks require purpose-limited processing, security and vendor governance
Skilling programmes can support recruitment but do not guarantee specialised workforce availability or lower attrition
Public-sector digitisation can create CX procurement opportunities without implying a confirmed order book for Fusion CX
Fundraise/Future Plans
Shareholding
Pre-issue shareholding
Promoter Holding 0.0%
Post-Issue Shareholding
Promoter Holding 0.0%
Category
Pre-Issue%Post-Issue%
Promoters
P N S Business Pvt Ltd
50.6%42.1%
Rasish Consultants Pvt Ltd
47.9%39.7%
Total Promoter Holding
98.5%81.8%
Additional Shareholders
Other Shareholders
1.5%18.2%
Total Additional Holding
1.5%18.2%
Total Shareholding
100.0%100.0%
- Overview
- Business
- Financial Highlights
- Industry Overview
- Fundraise/Future Plans
- Documentation
Get the Preqt App and keep in touch around the clock!
 Monitor your investments in real-time.
- Receive tailored deal suggestions.
- Get real-time updates and alerts.
