


Garuda Aerospace
Engineering aerial intelligenceDrones for progress
IPO Review and Rating
Risky
DRHP ApprovedOverall Recommendation
Garuda Aerospace recorded a 97.4% 3-year revenue CAGR. FY25 EBITDA margin stood at 23.1%, PAT margin at 14.7%, D/E at 0.04x and ROE at approximately 10.9%–12.6%. Operating cash flow remained negative at INR (33.7) Cr in FY25 after INR (41.4) Cr in FY24. The drone industry is estimated to grow at 24.4% CAGR, with an HHI of approximately 1,750 and strong global demand.
PARAMETER
WEIGHT
SCORE
KEY FACTORS
Financial Performance
25.0%
3.0/5
Revenue recorded a 97.4% 3-year CAGR, but FY25 growth slowed to 7.0%. EBITDA and PAT margins remained healthy at 23.1% and 14.7%.
Show more
Detailed Analysis
Revenue increased from INR 15.3 Cr in FY22 to INR 47.0 Cr in FY23, INR 109.9 Cr in FY24 and INR 117.7 Cr in FY25, representing a 3-year CAGR of 97.4%.
FY25 EBITDA margin stood at 23.1%, compared with approximately 22.0% in FY24, indicating broadly stable operating profitability.
FY25 PAT stood at INR 17.3 Cr on revenue of INR 117.7 Cr, translating into a 14.7% PAT margin, compared with 14.4% margin in FY24.
FY25 debt stood at approximately INR 6.7 Cr against equity of approximately INR 168.0 Cr, resulting in a D/E ratio of 0.04x, rounded to 0.0x.
FY25 ROE stood at approximately 10.9%–12.6%, compared with 23.5% in FY24, primarily reflecting expansion in the equity base during FY25.
Operating cash flow remained negative at INR (41.4) Cr in FY24 and INR (33.7) Cr in FY25, despite positive PAT in both years.
Industry
25.0%
4.0/5
The industry benefits from an estimated 24.4% CAGR and remains in the Growth stage. Competitive intensity is moderate with an estimated HHI of 1,750.
Show more
Detailed Analysis
The relevant Indian drone market is estimated to grow at approximately 24.4% CAGR, supported by increasing adoption across agriculture, defence, surveillance, infrastructure and logistics.
The drone industry is classified in the Growth stage, supported by increasing domestic manufacturing, new applications and government-backed adoption.
Regulatory environment is assessed as Neutral, with DGCA certification requirements creating compliance obligations while also acting as entry barriers.
Management
25.0%
3.0/5
Promoter experience is approximately 11–16 years, while the FY25 Board had 0.0% independent representation.
Show more
Detailed Analysis
Promoter experience is assessed at approximately 11 years under the scoring sheet; FY24 disclosures separately state more than 16 years of experience for Agnishwar Jayaprakash.
FY25 Board comprised 2 executive directors and 0 independent directors, resulting in 0.0% independent representation.
No promoter pledge or major litigation was identified in the scoring review; FY25 disclosures also reported no material regulatory or court orders.
Valuation Metrics
25.0%
2.0/5
Garuda is valued at approximately 128.8x FY25 P/E, with the scoring sheet indicating a 132.3% premium to peers.
Show more
Detailed Analysis
The Company is valued at approximately 128.8x FY25 earnings, while the scoring sheet records a 132.3% premium to the relevant peer/industry benchmark.
The scoring sheet records Garuda's relative EV/EBITDA at approximately 0.56x of the relevant peer benchmark, placing the Company within the 0.5x–1.0x relative-multiple scoring band.
P/B stood at approximately 14.0x–15.2x, indicating a substantial premium to FY25 book value.
TOTAL
100%
3.0/5
Weighted Composite Score
Per Share Price
₹450.0
As of 14 Oct 2026
Lot Size
1,000.0 Shares
Minimum Investment
₹4,50,000.0 / 1,000 shares
Market Cap. (₹ Cr)
Revenue FY’25
PAT FY’25
P/E Multiple
Face Value
₹ 2.0Lot Size
1,000.0 sharesPAT FY’25
₹ 17.3 CrPAT Margin (%)
14.7 %P/E Multiple
128.8xCAGR Growth 3Y
97.3 %ROE (FY’25)
12.6 %ROCE (FY’25)
14.9 %Price to Book Value ratio
14.0xDebt/Equity (FY’25)
0.0xMerchant banker appointed
❌ NoCompany Website
www.garudaaerospace.comDisclaimer: Unlisted shares are unregulated & illiquid. This is NOT investment advice. Please do your own due diligence before investing.
Minimum Investment
₹4,50,000.0 / 1,000 sharesShares Lot 1000 X 1
Investment amount
₹4,50,000.0
Overview
Business
Products
Business Model
Geographical Presence
Sales Channel
Financial Highlights
Income Statement
Revenue growth with EBITDA and PAT margins
| Financial Metric | FY 2023 | FY 2024 | FY 2025 |
|---|---|---|---|
| Revenue (₹ Cr) | 47.0 | 109.9 | 117.7 |
| Growth (%) | 206.9% | 134.0% | 7.0% |
| EBITDA (₹ Cr) | 10.9 | 25.3 | 28.2 |
| EBITDA Margin (%) | 23.1% | 23.1% | 24.0% |
| PAT (₹ Cr) | 6.2 | 15.8 | 17.3 |
| PAT Margin (%) | 13.1% | 14.4% | 14.7% |
OBSERVATIONS & INSIGHTS
Revenue has scaled rapidly from INR 47.0 Cr in FY23 to INR 117.7 Cr in FY25. However, the growth profile has normalised sharply: revenue growth fell from 134.0% in FY24 to only 7.0% in FY25. The 97.4% three-year CAGR therefore overstates the current run-rate growth if viewed without the annual progression.
PAT increased from INR 6.2 Cr in FY23 to INR 15.8 Cr in FY24 and INR 17.3 Cr in FY25. FY25 PAT growth was approximately 9.1%, broadly in line with the slower revenue expansion.
Reconstructed EBITDA margin remained resilient at approximately 23.1% in FY23, 23.1% in FY24 and 24.0% in FY25, while PAT margin improved from 13.1% to 14.7%. The ability to preserve margins despite slower FY25 growth is positive, but the multiple EBITDA definitions in source materials should be reconciled before external publication.
FY25 revenue mix was balanced between product sales (INR 59.8 Cr) and DaaS (INR 56.2 Cr), reducing dependence on a single monetisation model. Training remained small at INR 1.7 Cr.
Balance Sheet
| Financial Metric | FY 2023 | FY 2024 | FY 2025 |
|---|---|---|---|
| EQUITY & LIABILITIES | ₹ 56.9 Cr | ₹ 148.7 Cr | ₹ 211.2 Cr |
| Net Worth | ₹ 30.0 Cr | ₹ 104.7 Cr | ₹ 168.0 Cr |
| Share Capital | ₹ 0.1 Cr | ₹ 0.1 Cr | ₹ 0.1 Cr |
| Reserves & Surplus | ₹ 29.9 Cr | ₹ 104.6 Cr | ₹ 167.9 Cr |
| Total Liabilities | ₹ 26.9 Cr | ₹ 44.0 Cr | ₹ 43.2 Cr |
| Current Liabilities | ₹ 15.8 Cr | ₹ 38.0 Cr | ₹ 40.9 Cr |
| Borrowings | ₹ 3.8 Cr | ₹ 15.4 Cr | ₹ 6.2 Cr |
| Trade Payables | ₹ 1.6 Cr | ₹ 15.7 Cr | ₹ 25.8 Cr |
| Other Current Liabilities | ₹ 10.4 Cr | ₹ 6.9 Cr | ₹ 8.9 Cr |
| Non-Current Liabilities | ₹ 11.1 Cr | ₹ 6.0 Cr | ₹ 2.3 Cr |
| Borrowings | ₹ 10.9 Cr | ₹ 4.3 Cr | ₹ 0.5 Cr |
| Other Non-Current Liabilities | ₹ 0.2 Cr | ₹ 1.7 Cr | ₹ 1.8 Cr |
| ASSETS | ₹ 56.9 Cr | ₹ 148.7 Cr | ₹ 211.3 Cr |
| Current Assets | ₹ 49.8 Cr | ₹ 130.0 Cr | ₹ 179.3 Cr |
| Trade Receivables | ₹ 37.7 Cr | ₹ 73.8 Cr | ₹ 114.8 Cr |
| Inventory | ₹ 1.4 Cr | ₹ 26.2 Cr | ₹ 24.6 Cr |
| Cash & Cash Equivalents | ₹ 3.8 Cr | ₹ 15.7 Cr | ₹ 4.6 Cr |
| Other Current Assets | ₹ 6.9 Cr | ₹ 14.3 Cr | ₹ 35.3 Cr |
| Non-Current Assets | ₹ 7.1 Cr | ₹ 18.7 Cr | ₹ 32.0 Cr |
| Fixed Assets | ₹ 6.8 Cr | ₹ 13.3 Cr | ₹ 15.2 Cr |
| Other Non-Current Assets | ₹ 0.3 Cr | ₹ 5.4 Cr | ₹ 16.8 Cr |
OBSERVATIONS & INSIGHTS
Total assets expanded from INR 56.9 Cr in FY23 to INR 148.7 Cr in FY24 and INR 211.3 Cr in FY25, reflecting the rapid build-out of working capital, operating assets and the equity-funded scale-up of the business.
Net worth increased from INR 30.0 Cr in FY23 to INR 168.0 Cr in FY25, largely through securities-premium / preference-capital issuances and retained earnings. The larger equity base has materially reduced leverage but also diluted return ratios.
Trade receivables are the dominant balance-sheet asset at INR 114.8 Cr in FY25, up INR 41.0 Cr year-on-year. This receivables build is significantly larger than the INR 7.7 Cr year-on-year increase in revenue and is the main reason cash conversion remains weak.
Cash and bank balances fell from INR 15.7 Cr in FY24 to INR 4.6 Cr in FY25 despite strong reported profitability. This decline reinforces the importance of collections and explains why the headline 4.4x current ratio should not be interpreted as equivalent to cash liquidity.
Total borrowings fell from INR 19.7 Cr in FY24 to approximately INR 6.7 Cr in FY25. The Company therefore enters the next growth phase with relatively low financial leverage, although working-capital funding remains an operational requirement.
Cash Flow
| Financial Metric | FY 2023 | FY 2024 | FY 2025 |
|---|---|---|---|
CFO (₹ Cr) Cash generated from core business operations. | - | -42.4 Cr | -33.7 Cr |
CFI (₹ Cr) Cash used for investments and long-term assets. | - | -12.3 Cr | -7.1 Cr |
CFF (₹ Cr) Cash flow related to funding and borrowings. | - | +62.7 Cr | +31.9 Cr |
Working Capital
| Efficiency Metric | FY 2023 | FY 2024 | FY 2025 |
|---|---|---|---|
Debtor Days Average number of days taken to collect customer payments. | - | - | - |
Creditor Days Average time taken to pay suppliers and vendors. | - | - | - |
Inventory Days Average number of days inventory remains unsold. | - | - | - |
CCC (Cash Conversion Cycle) (Debtor Days + Inventory Days - Creditor Days) | - | - | - |
Financial Ratios
Measures the company’s leverage relative to shareholder equity.
OBSERVATIONS & INSIGHTS
Leverage reduced materially. Debt / equity declined from 0.5x in FY23 to 0.2x in FY24 and approximately 0.0x on one-decimal presentation in FY25, reflecting substantial equity / preference-capital funding and debt repayment.
Interest coverage improved from 9.7x in FY23 to 21.7x in FY25 as finance costs declined despite a larger operating scale, reducing near-term debt-service risk.
ROE declined from 21.0% in FY23 to 12.6% in FY25, while ROCE declined from 20.0% to 14.9%. This is primarily consistent with the significant increase in the equity and asset base ahead of full revenue monetisation.
The current ratio improved to 4.4x in FY25, but the headline liquidity ratio overstates immediately available liquidity because a large portion of current assets is concentrated in trade receivables and advances rather than cash.
Industry Overview
Industry Drivers
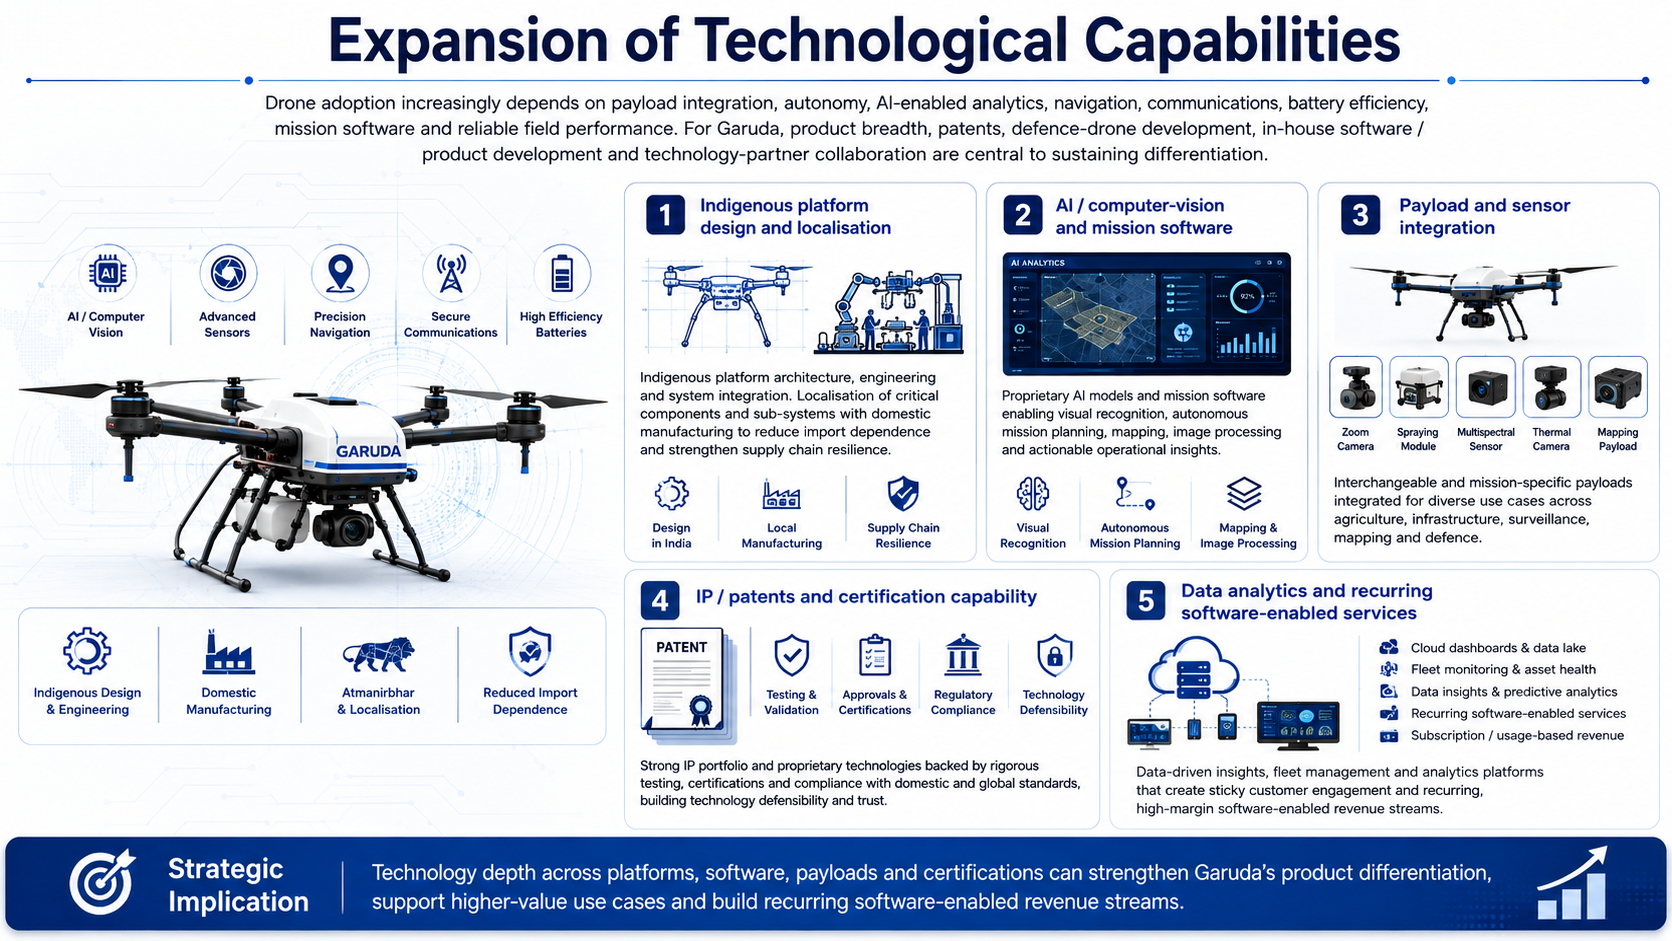
Expansion of Technological Capabilities
Drone adoption increasingly depends on payload integration, autonomy, AI-enabled analytics, navigation, communications, battery efficiency, mission software and reliable operation in demanding field conditions. For Garuda, product breadth, patents, defence-drone development, internal software / product development and collaboration with technology partners are central to maintaining differentiation.
Indigenous platform design and localisation
AI / computer-vision and mission software
Payload and sensor integration
IP / patents and certification capability
Data analytics and recurring software-enabled services
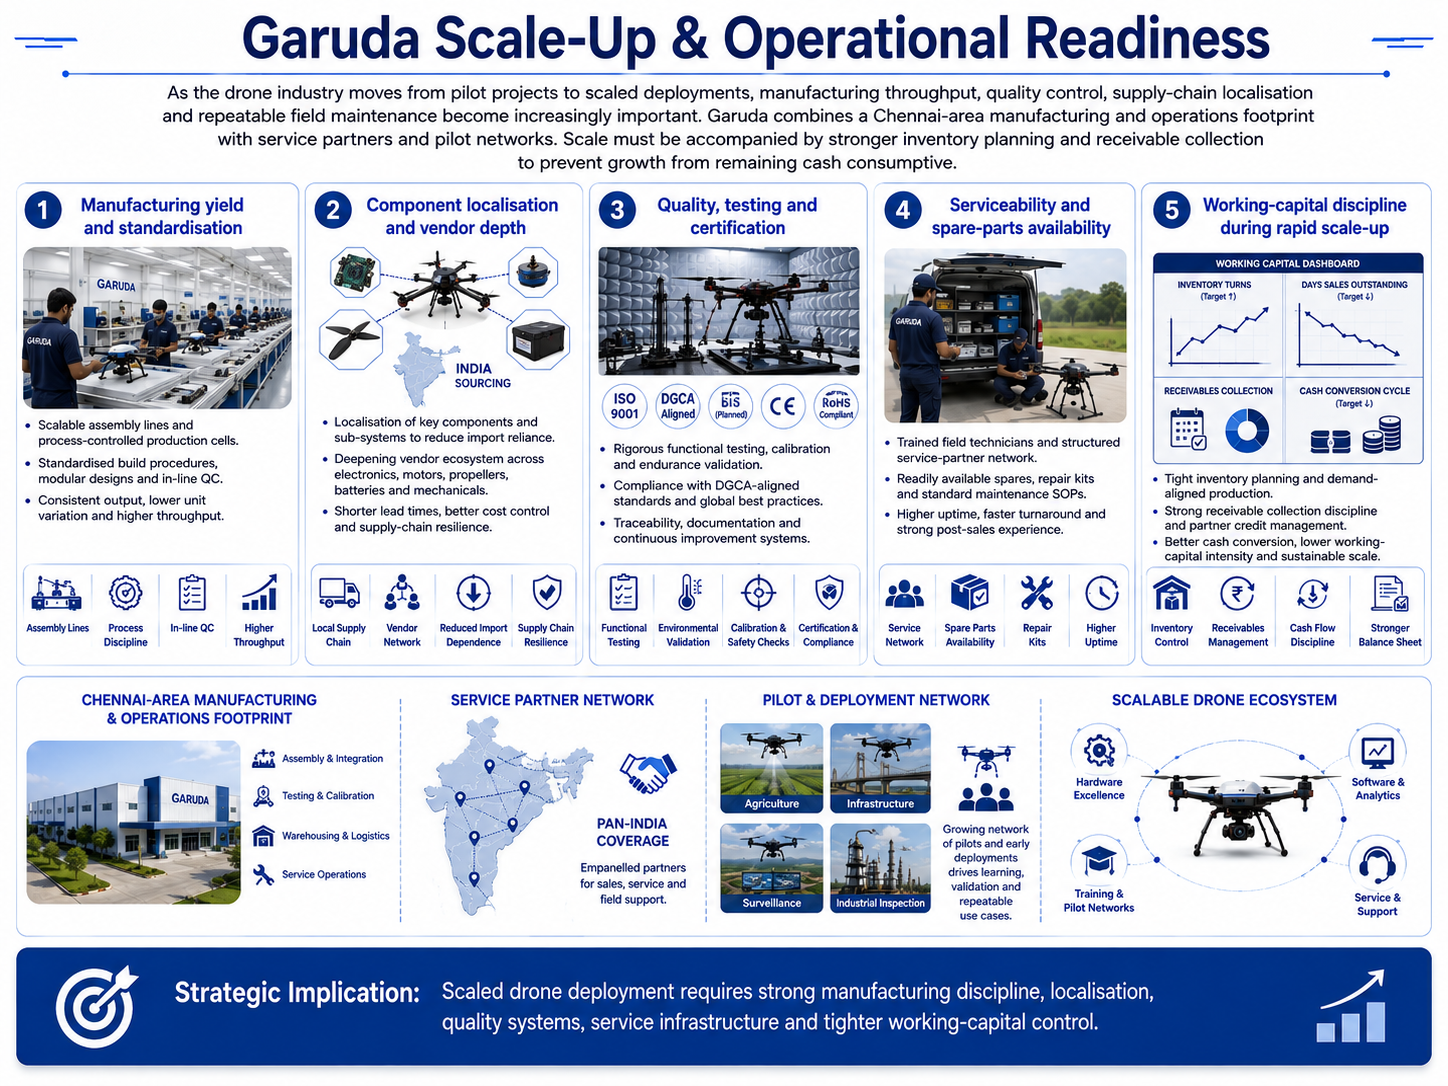
Capacity Expansion
As the industry moves from pilots to scaled deployments, manufacturing throughput, quality control, supply-chain localisation and repeatable field maintenance become increasingly important. Garuda combines a Chennai-area manufacturing / operations footprint with service partners and pilot networks. Scale must be accompanied by stronger inventory planning and receivable collection to prevent growth from remaining cash consumptive.
Manufacturing yield and standardisation
Component localisation and vendor depth
Quality, testing and certification
Serviceability and spare-parts availability
Working-capital discipline during rapid scale-up
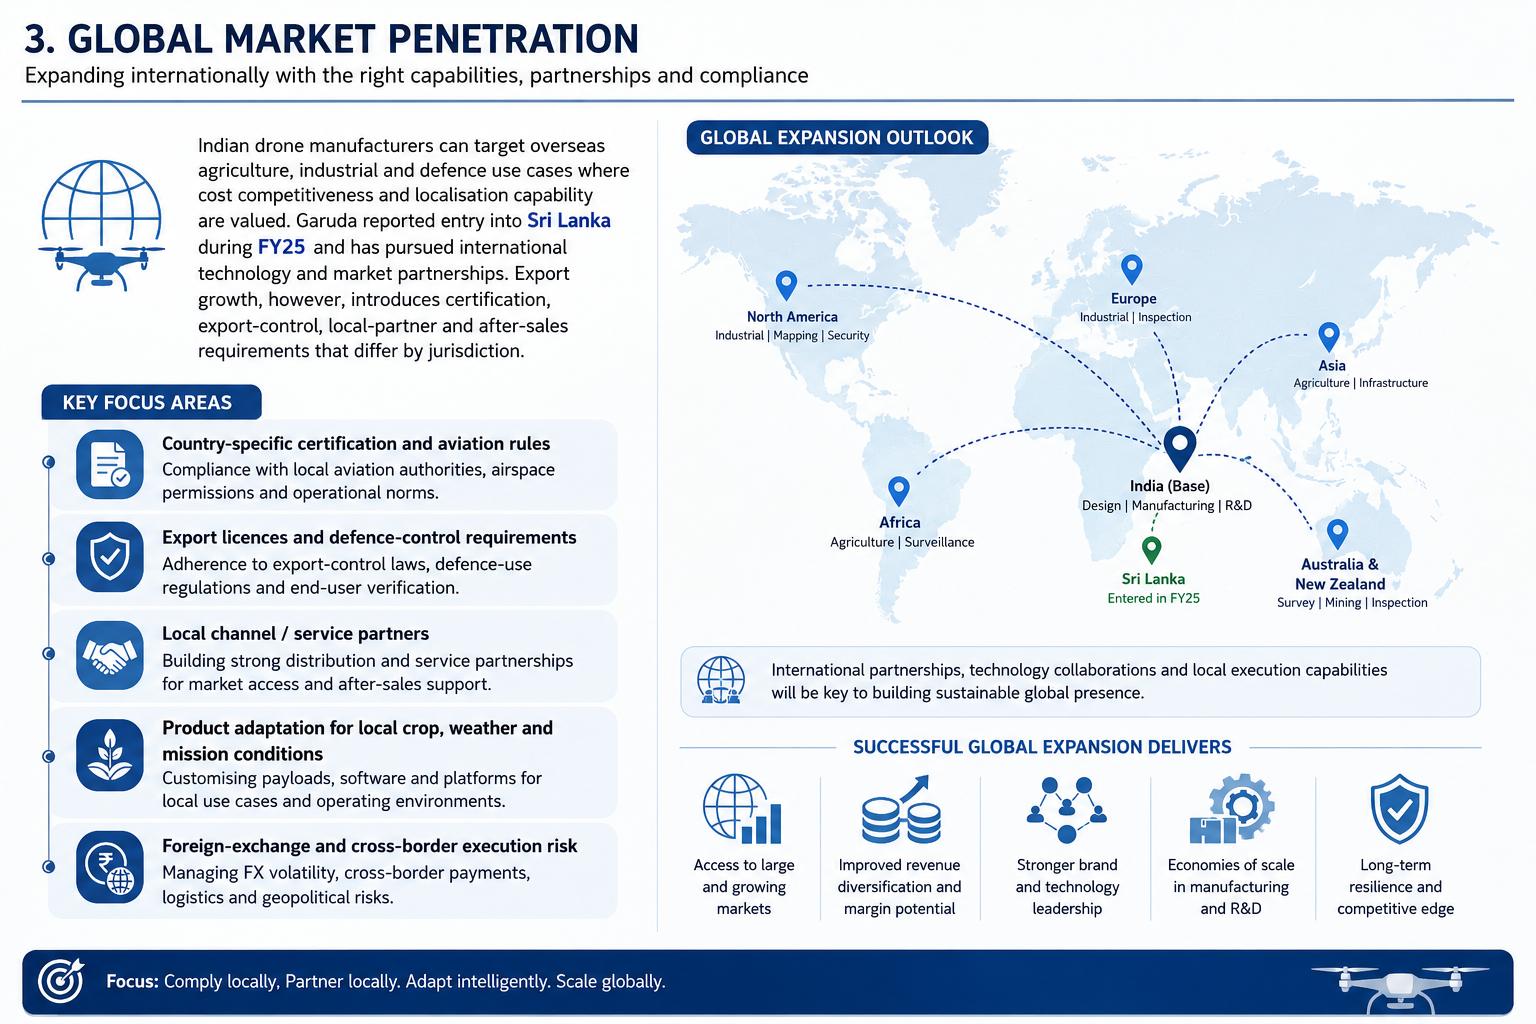
Global Market Penetration
Indian drone manufacturers can target overseas agriculture, industrial and defence use cases where cost competitiveness and localisation capability are valued. Garuda reported entry into Sri Lanka during FY25 and has pursued international technology and market partnerships. Export growth, however, introduces certification, export-control, local-partner and after-sales requirements that differ by jurisdiction.
Country-specific certification and aviation rules
Export licences and defence-control requirements
Local channel / service partners
Product adaptation for local crop, weather and mission conditions
Foreign-exchange and cross-border execution risk
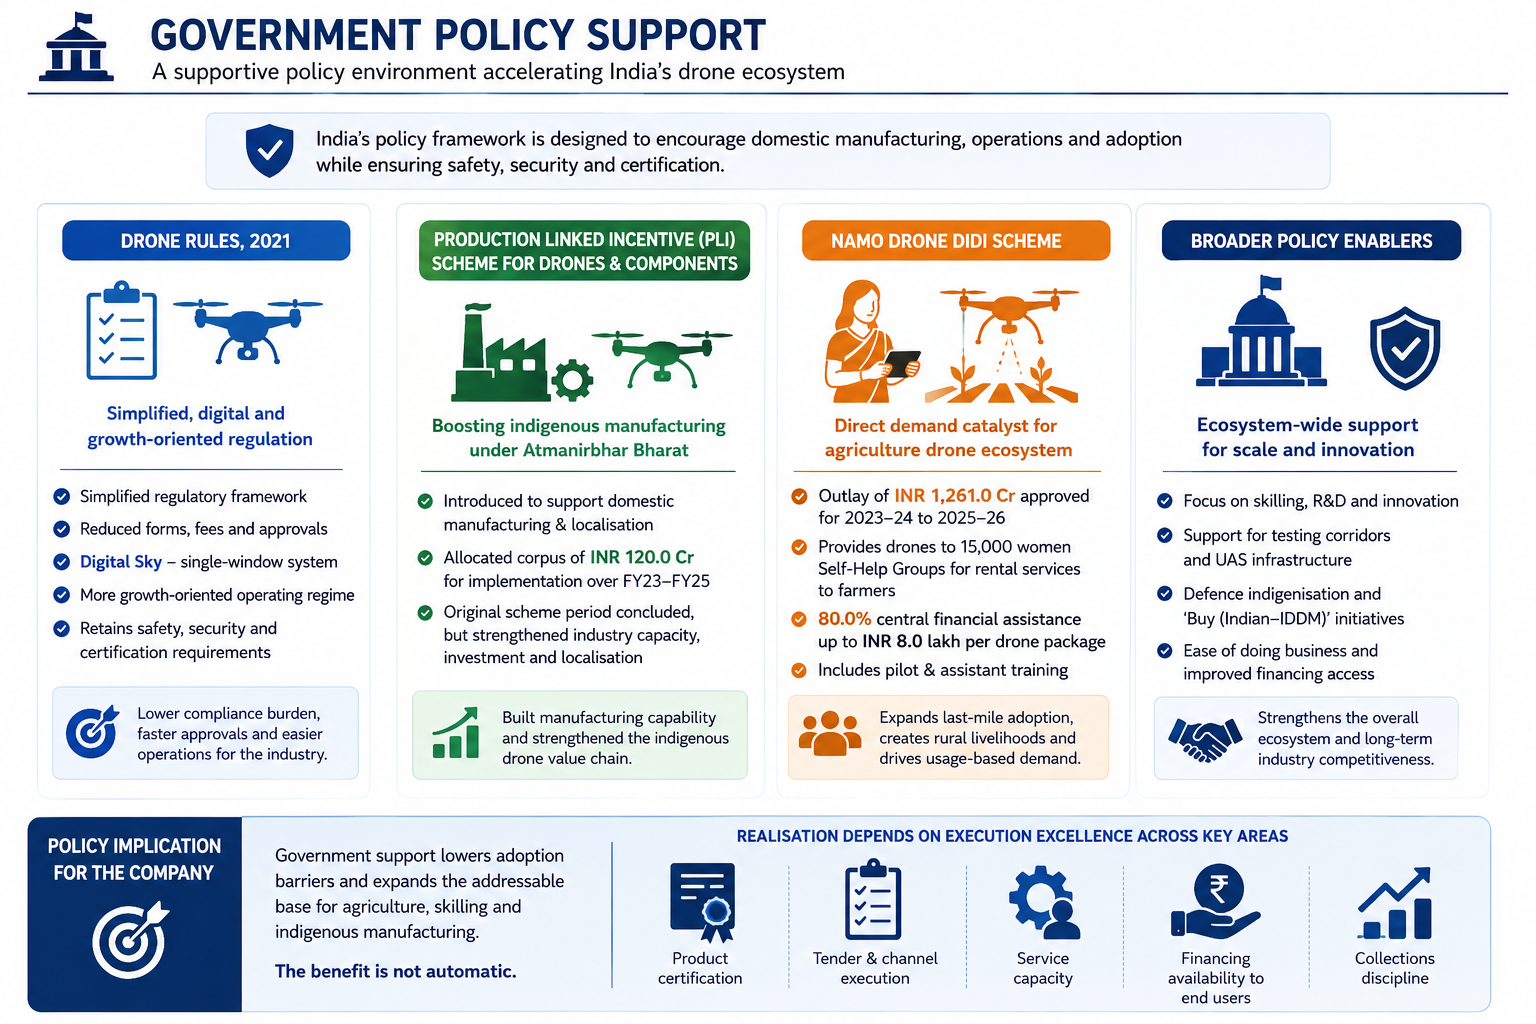
Government Policy Support
India's drone policy framework has been deliberately structured to encourage domestic manufacturing, operations and adoption. The Drone Rules, 2021 simplified the regulatory framework, reduced forms and fees, enabled a Digital Sky single-window system and created a more growth-oriented operating regime while retaining safety and certification requirements.
The Production Linked Incentive scheme for drones and drone components was introduced to support indigenous manufacturing under Atmanirbhar Bharat. The scheme had an allocated corpus of INR 120.0 Cr for implementation over FY23-FY25. While the original scheme period has concluded, it contributed to industry capacity creation and localisation.
The Namo Drone Didi scheme provided a direct agriculture-demand catalyst. The Government approved an outlay of INR 1,261.0 Cr for 2023-24 to 2025-26 to provide drones to 15,000 women Self-Help Groups for rental services to farmers. The scheme provided 80.0% central financial assistance up to INR 8.0 lakh per drone package together with pilot and assistant training. This policy directly supports the agriculture-drone and DaaS ecosystem in which Garuda operates.
Policy implication for the Company: Government support lowers adoption barriers and expands the addressable base for agriculture, skilling and indigenous manufacturing. The benefit is not automatic; realisation depends on product certification, tender / channel execution, service capacity, financing availability to end users and collections discipline.
- Overview
- Business
- Financial Highlights
- Industry Overview
- Documentation
Get the Preqt App and keep in touch around the clock!
 Monitor your investments in real-time.
- Receive tailored deal suggestions.
- Get real-time updates and alerts.
