


Goodluck Green Energy Limited
Solar and Hydrogen SolutionsBuilding Sustainable InfrastructureSustainable Engineering Excellence
Unlisted Review and Rating
Speculative
DRHP Not FiledOverall Recommendation
Goodluck Green Energy offers exposure to the emerging green-hydrogen opportunity, supported by favourable policy tailwinds, a debt-free balance sheet and the broader Goodluck industrial ecosystem; however, at a valuation of INR 1,200+ Cr, the investment case remains largely execution-driven, with no audited operating revenue, no disclosed order book or offtake, only INR 7.7 Cr of FY25 CWIP and material related-party capital deployment. The risk-reward may therefore become more attractive after commissioning and the first audited operating results, even at a higher valuation, as paying more for verified execution can be preferable to paying less for unproven projections
PARAMETER
WEIGHT
SCORE
KEY FACTORS
Financial Performance
25.0%
3.0/5
Despite INR 119.5 Cr net worth and 0.0x D/E, only INR 7.7 Cr was deployed as CWIP, while INR 73.1 Cr remained in short-term loans & advances. The key question is how quickly the equity-funded balance sheet converts into an operational hydrogen asset.
Show more
Detailed Analysis
INR 120.43 Cr total assets were almost entirely funded through equity, with no long-term borrowings and less than INR 1 Cr of external liabilities
INR 112.77 Cr, or approximately 93.6% of total assets, consisted of cash plus short-term loans and advances; only INR 7.7 Cr, or approximately 6.4% of total assets, was CWIP
INR 73.87 Cr operating cash outflow was largely driven by INR 73.09 Cr moving into receivables/advances rather than normal operating losses. FY25 financing inflow was INR 117.8 Cr, entirely equity-led
INR 1.7 Cr FY25 PAT should not be treated as operating profitability. Revenue from operations was nil and other income was INR 3.4 Cr
2.9% ROE and 6.0% ROCE are reported/derived ratios, but they primarily reflect income earned on financial assets before commercial operations
Industry
25.0%
4.0/5
Green hydrogen has strong policy support, but Goodluck Green has no disclosed quantified order book/offtake, verified commercial capacity, utilisation or plant-level unit economics. Sector attractiveness therefore needs to translate into company-level commercial visibility.
Show more
Detailed Analysis
The policy backdrop is strong: the National Green Hydrogen Mission targets at least 5 MMT of annual capacity and ~125 GW of associated renewable capacity by 2030
But the Company-specific commercial evidence is still thin. The report does not disclose verified plant capacity, utilisation, hydrogen yield, feedstock economics or signed offtake
Management
25.0%
3.0/5
Approximately INR 70.3 Cr was advanced to Excellent Fincap, a related entity, with INR 2.1 Cr of interest earned. Given the Company's pre-commercial stage, how this capital is allocated and recovered is the most important governance monitorable.
Show more
Detailed Analysis
Leadership experience is reasonable for a new project platform. Rishabh Garg has 8+ years, Rajat Garg 12+ years, while one independent director has 35 years of banking/audit experience
The audit record itself is clean. The annual report reports no qualification/adverse remark or fraud, while CARO states no material uncertainty was identified regarding payment of liabilities falling due within one year
The financial statements disclose:
INR 70.2 Cr loans given to Excellent Fincap Private Limited
INR 2 Cr interest earned
Excellent Fincap is identified as an entity controlled by directors / relatives.
Yet the Directors' Report says no related-party transactions were entered into during FY25
TOTAL
100%
3.3/5
Weighted Composite Score
Per Share Price
₹155.0
As of 14 Oct 2026
Lot Size
1,000.0 Shares
Minimum Investment
₹1,55,000.0 / 1,000 shares
Market Cap. (₹ Cr)
Revenue FY’25
PAT FY’25
P/E Multiple
Face Value
₹ 10.0Offer Price
₹ 132.0Lot Size
1,000.0 sharesSale Type
Unlisted SharesPAT FY’25
₹ 1.7 CrPAT Margin (%)
51.2 %P/E Multiple
701.0xROE (FY’25)
2.9 %ROCE (FY’25)
6.0 %Price to Book Value ratio
10.2xDebt/Equity (FY’25)
0.0xMerchant banker appointed
❌ NoCompany Website
www.goodluckgreen.comDisclaimer: Unlisted shares are unregulated & illiquid. This is NOT investment advice. Please do your own due diligence before investing.
Minimum Investment
₹1,55,000.0 / 1,000 sharesShares Lot 1000 X 1
Investment amount
₹1,55,000.0
Overview
Business
Business Model
Geographical Presence
Sales Channel
Financial Highlights
Income Statement
Revenue growth with EBITDA and PAT margins
| Financial Metric | FY 2025 |
|---|---|
| Revenue (₹ Cr) | 0.0 |
| Growth (%) | 0.0% |
| EBITDA (₹ Cr) | 3.4 |
| EBITDA Margin (%) | 0.0% |
| PAT (₹ Cr) | 1.7 |
| PAT Margin (%) | 0.0% |
OBSERVATIONS & INSIGHTS
The Company recorded no revenue from operations in FY25. FY25 total income of INR 3.40 Cr was entirely interest income, so the historical earnings base is treasury-led rather than operating.
FY25 PBT was INR 2.59 Cr and PAT was INR 1.74 Cr after an exceptional item of approximately INR 0.80 Cr.
The underlying operating cost base in the financial statements is still pre-commercial. Conventional EBITDA margin, revenue growth and PAT margin are therefore not economically meaningful.
A numerical FY26 / FY27 operating-revenue, EBITDA or PAT forecast is not defensible from the supplied audited report because verified capacity, product yield, feedstock economics, selling price, order book, offtake volume, utilisation and post-commissioning cost structure are not disclosed.
The most defensible forward inference is that as project funds are deployed, interest income should become less important relative to operating activity. The pace and magnitude cannot be estimated reliably without updated operating disclosures.
Balance Sheet
| Financial Metric | FY 2025 |
|---|---|
| EQUITY & LIABILITIES | ₹ 120.4 Cr |
| Net Worth | ₹ 119.5 Cr |
| Share Capital | ₹ 42.1 Cr |
| Reserves & Surplus | ₹ 77.4 Cr |
| Total Liabilities | ₹ 0.9 Cr |
| Current Liabilities | ₹ 0.9 Cr |
| Borrowings | ₹ 0.0 Cr |
| Trade Payables | ₹ 0.0 Cr |
| Other Current Liabilities | ₹ 0.9 Cr |
| Non-Current Liabilities | ₹ 0.0 Cr |
| Borrowings | ₹ 0.0 Cr |
| Other Non-Current Liabilities | ₹ 0.0 Cr |
| ASSETS | ₹ 120.5 Cr |
| Current Assets | ₹ 112.8 Cr |
| Trade Receivables | ₹ 0.0 Cr |
| Inventory | ₹ 0.0 Cr |
| Cash & Cash Equivalents | ₹ 39.7 Cr |
| Other Current Assets | ₹ 73.1 Cr |
| Non-Current Assets | ₹ 7.7 Cr |
| CWIP | ₹ 7.7 Cr |
| Other Non-Current Assets | ₹ 0.0 Cr |
OBSERVATIONS & INSIGHTS
The balance sheet expanded sharply through equity issuance, net worth increased to approximately INR 119.54 Cr in FY25, comprising INR 42.14 Cr of paid-up share capital and INR 77.40 Cr of reserves and surplus, largely securities premium
The Company had no current or non-current borrowings at FY25. External liabilities were less than INR 1 Cr, so project development to that date was funded predominantly by shareholder capital rather than leverage
Cash and short-term loans / advances together were approximately INR 112.77 Cr, or about 93.6% of total assets. This is consistent with a capital-raising and pre-commissioning phase rather than an established productive-asset base
Capital work-in-progress of INR 7.66 Cr represented the principal non-current asset. The audited balance sheet showed no tangible fixed assets, so future value creation depends on converting CWIP and deployed advances into commissioned, revenue-generating assets
During FY25 the related-party note reports INR 70.25 Cr of loans given to Excellent Fincap Private Limited and INR 2.07 Cr of interest earned from it. The related-party loan flow was equivalent to roughly 58% of FY25 total assets
Cash Flow
| Financial Metric | FY 2025 |
|---|---|
CFF (₹ Cr) Cash flow related to funding and borrowings. | +117.9 Cr |
CFO (₹ Cr) Cash generated from core business operations. | -73.9 Cr |
CFI (₹ Cr) Cash used for investments and long-term assets. | -4.26 Cr |
Financial Ratios
Measures the company’s leverage relative to shareholder equity.
OBSERVATIONS & INSIGHTS
The 127.37x current ratio is not evidence of a mature high-liquidity operating model. It reflects a newly capitalised balance sheet with large cash / advance balances and very small current liabilities before commercial operations.
ROE and ROCE are driven by interest income on deployed financial assets rather than operating returns from hydrogen or renewable-energy projects. Forward return ratios cannot be responsibly projected until productive assets begin generating revenue.
The Company had no bank or institutional borrowings at FY25 and the auditor noted that no term loan or working-capital borrowing was availed. Interest coverage and debt-service coverage are therefore not meaningful.
The likely direction of the current ratio is lower as cash and advances are converted into capex, inventory, receivables and operating liabilities, but the magnitude depends on the commissioning and financing model
Industry Overview
Industry Drivers
A. Technology and Operating Capability
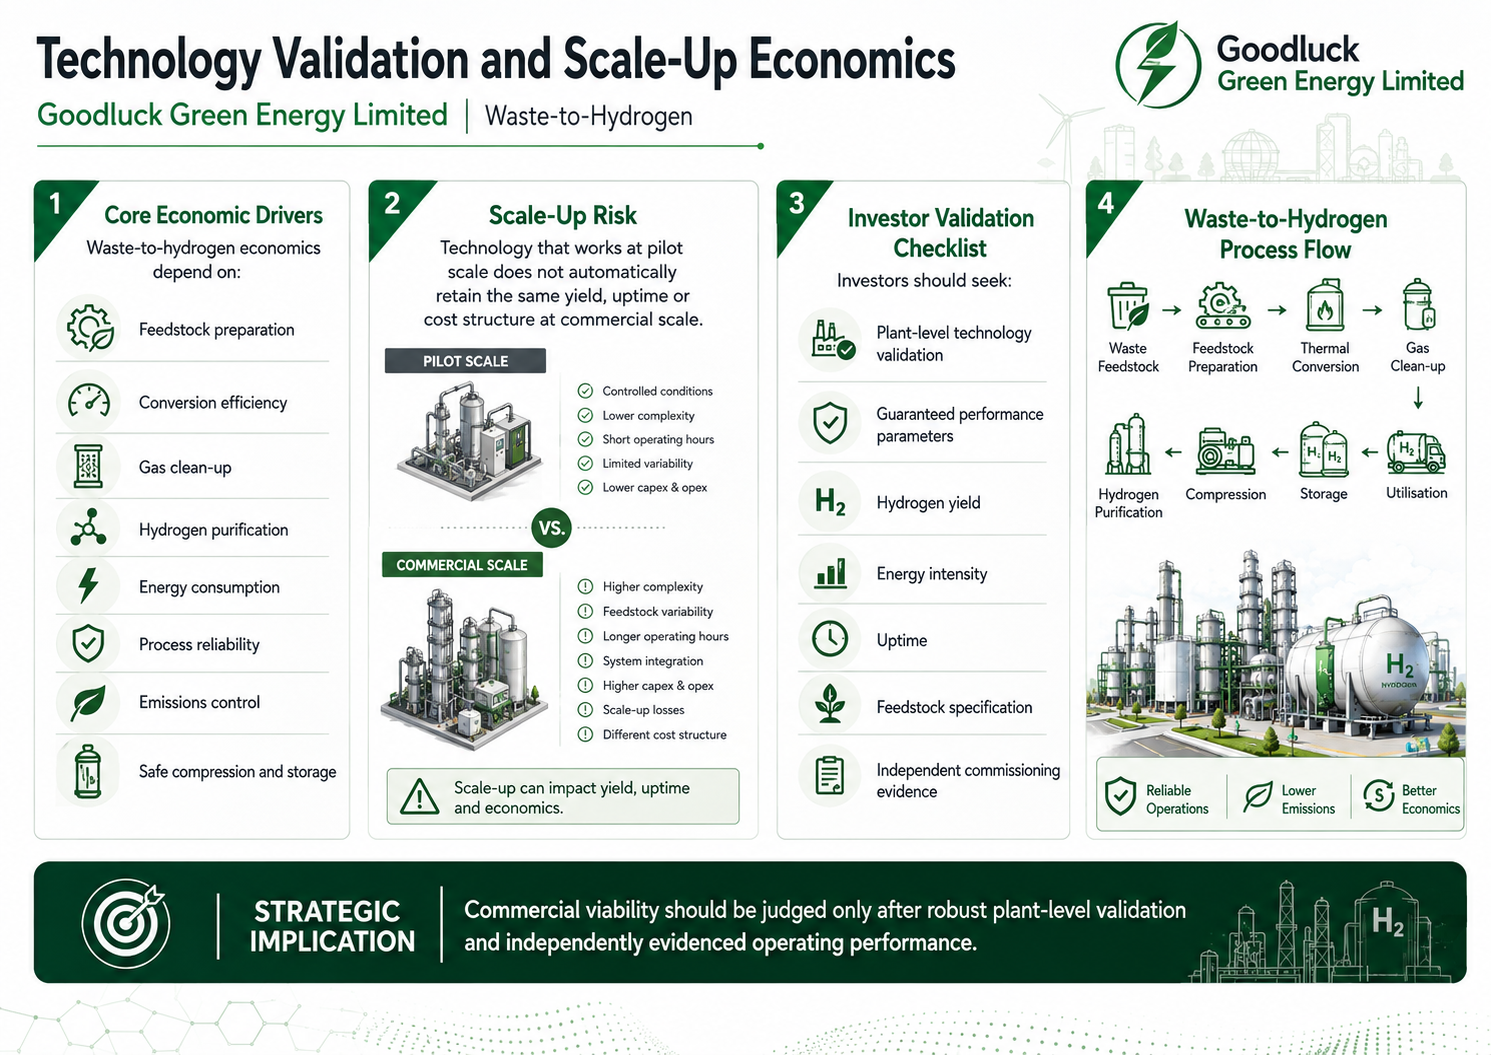
Waste-to-hydrogen economics depend on feedstock preparation, conversion efficiency, gas clean-up, hydrogen purification, energy consumption, process reliability, emissions control and safe compression / storage.
Technology that works at pilot scale does not automatically retain the same yield, uptime or cost structure at commercial scale
Investors should seek plant-level technology validation, guaranteed performance parameters, hydrogen yield, energy intensity, uptime, feedstock specification and independent commissioning evidence before assigning operating multiples
Capacity Expansion
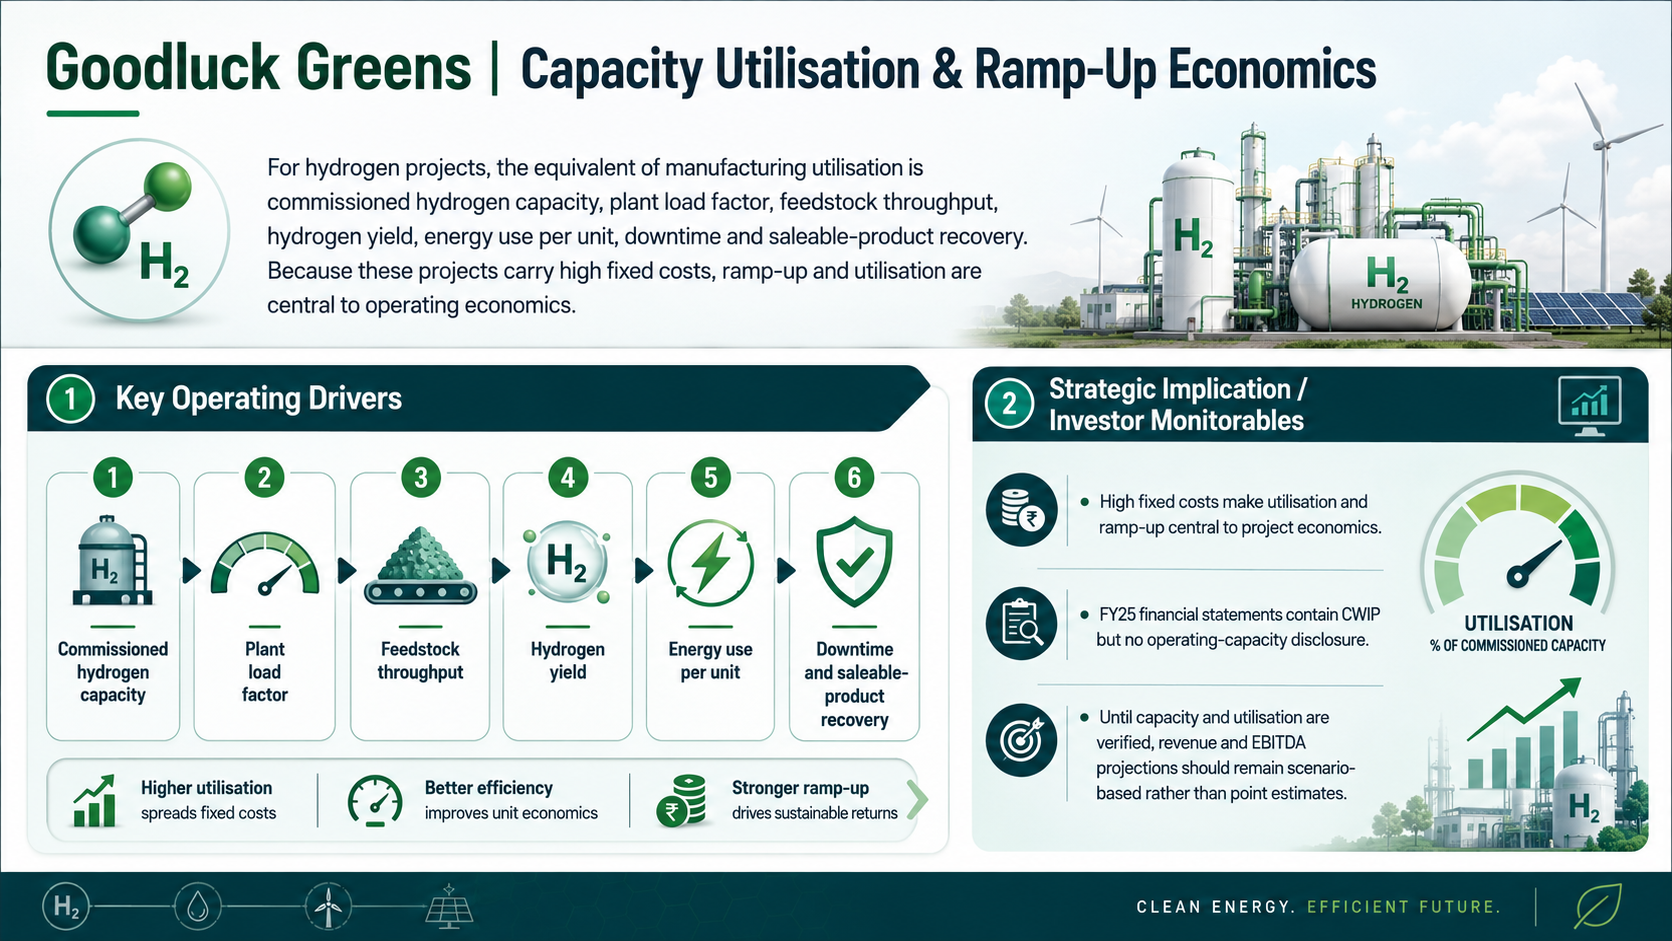
For hydrogen projects, the equivalent of manufacturing utilisation is commissioned hydrogen capacity, plant load factor, feedstock throughput, hydrogen yield, energy use per unit, downtime and saleable-product recovery. High fixed costs can make ramp-up and utilisation central to economics
The FY25 financial statements contain CWIP but no operating capacity disclosure. Until capacity and utilisation are verified, revenue and EBITDA projections should remain scenario-based rather than point estimates
Geographic and End-Market Penetration
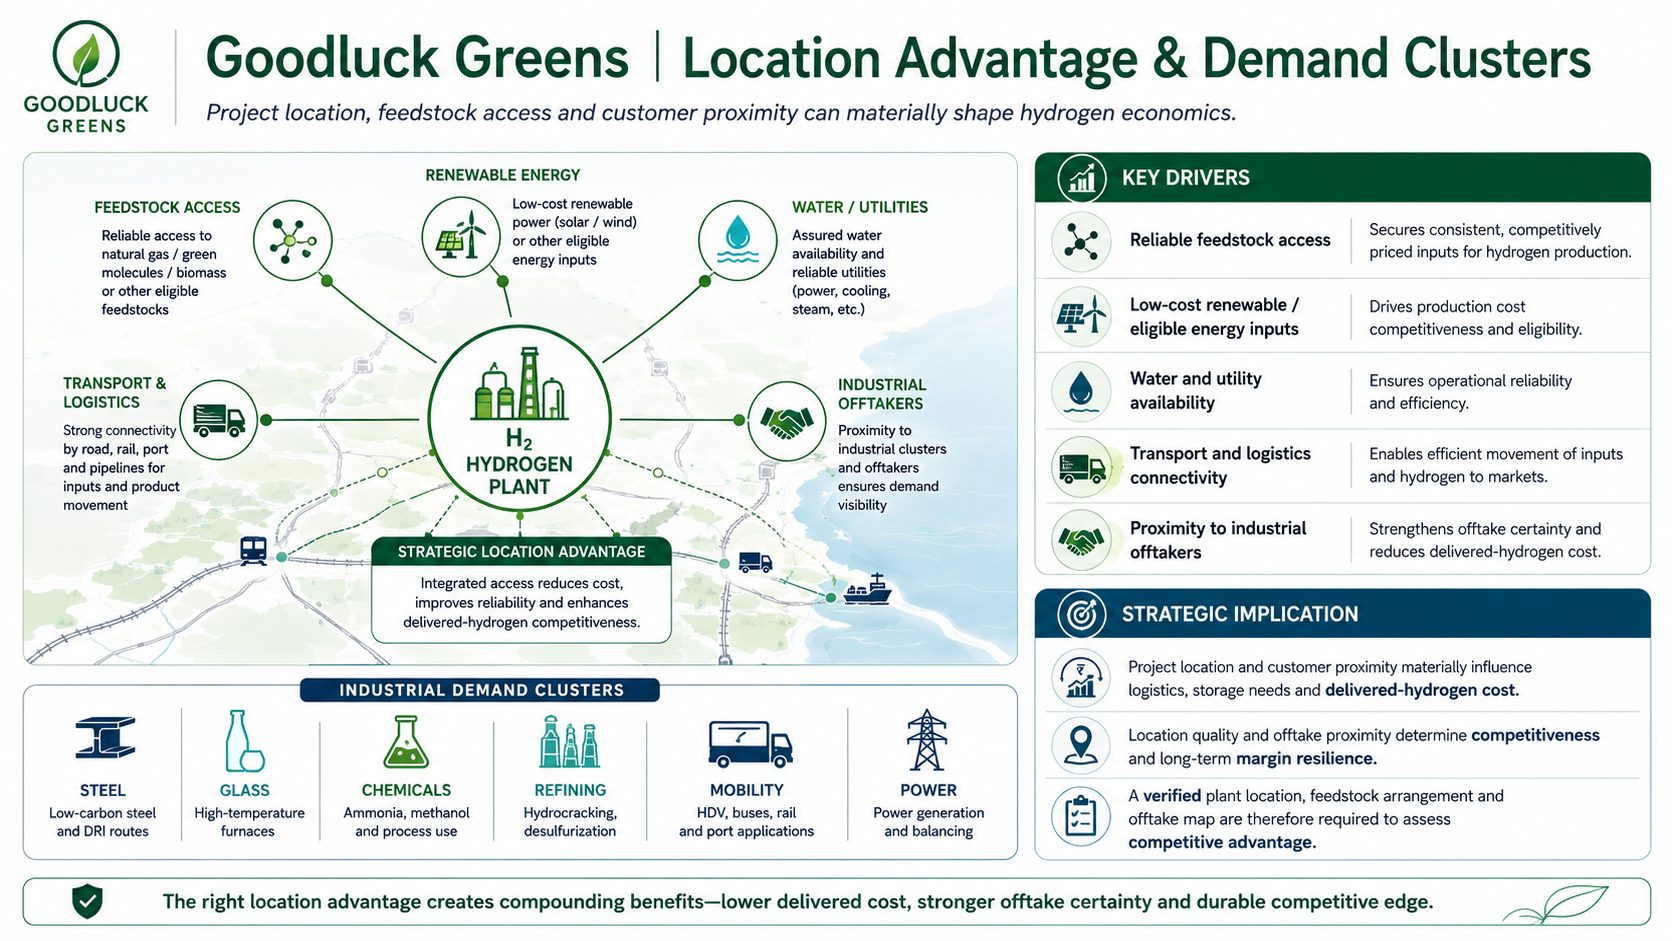
Hydrogen projects benefit from proximity to reliable feedstock, low-cost renewable energy or other eligible energy inputs, water / utilities, industrial offtakers and transport infrastructure
Industrial clusters in steel, glass, chemicals, refining, mobility and power can create concentrated demand pools
Project location and customer proximity can materially change logistics, storage and delivered-hydrogen cost. A verified plant location, feedstock arrangement and offtake map are therefore required to assess competitive advantage
Industry Risks
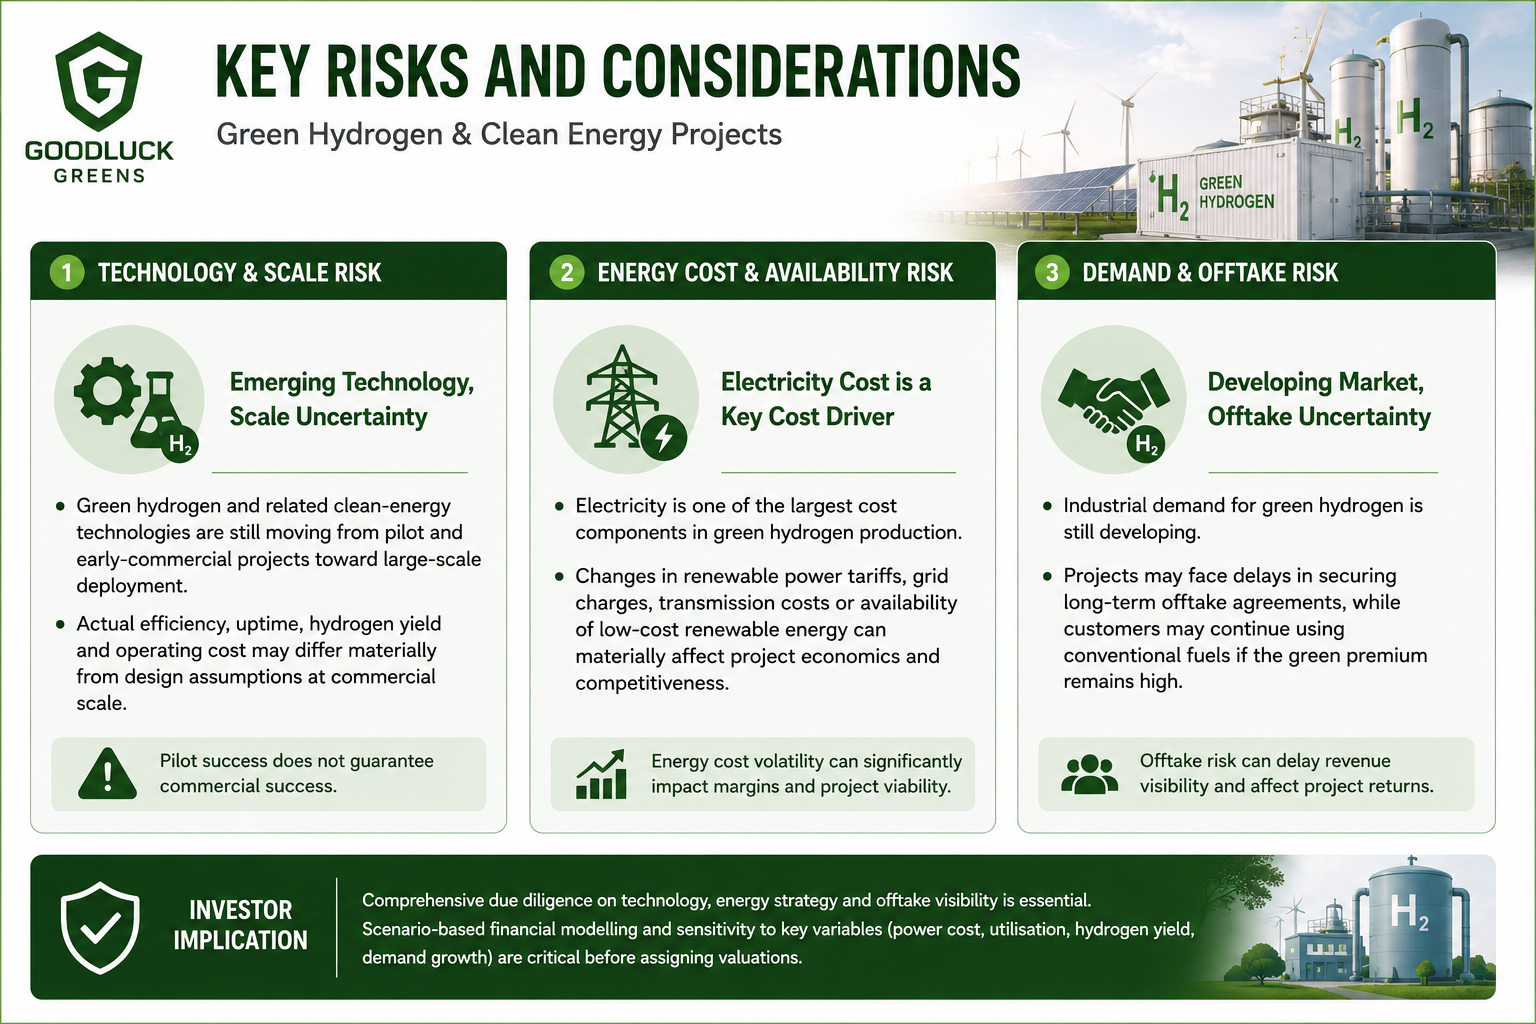
Green hydrogen and related clean-energy technologies are still moving from pilot and early-commercial projects toward large-scale deployment. Actual efficiency, uptime, hydrogen yield and operating cost may differ materially from design assumptions at commercial scale
Electricity is one of the largest cost components in green hydrogen production. Changes in renewable power tariffs, grid charges, transmission costs or availability of low-cost renewable energy can materially affect project economics and competitiveness
Industrial demand for green hydrogen is still developing. Projects may face delays in securing long-term offtake agreements, while customers may continue using conventional fuels if the green premium remains high
Government Policy Support
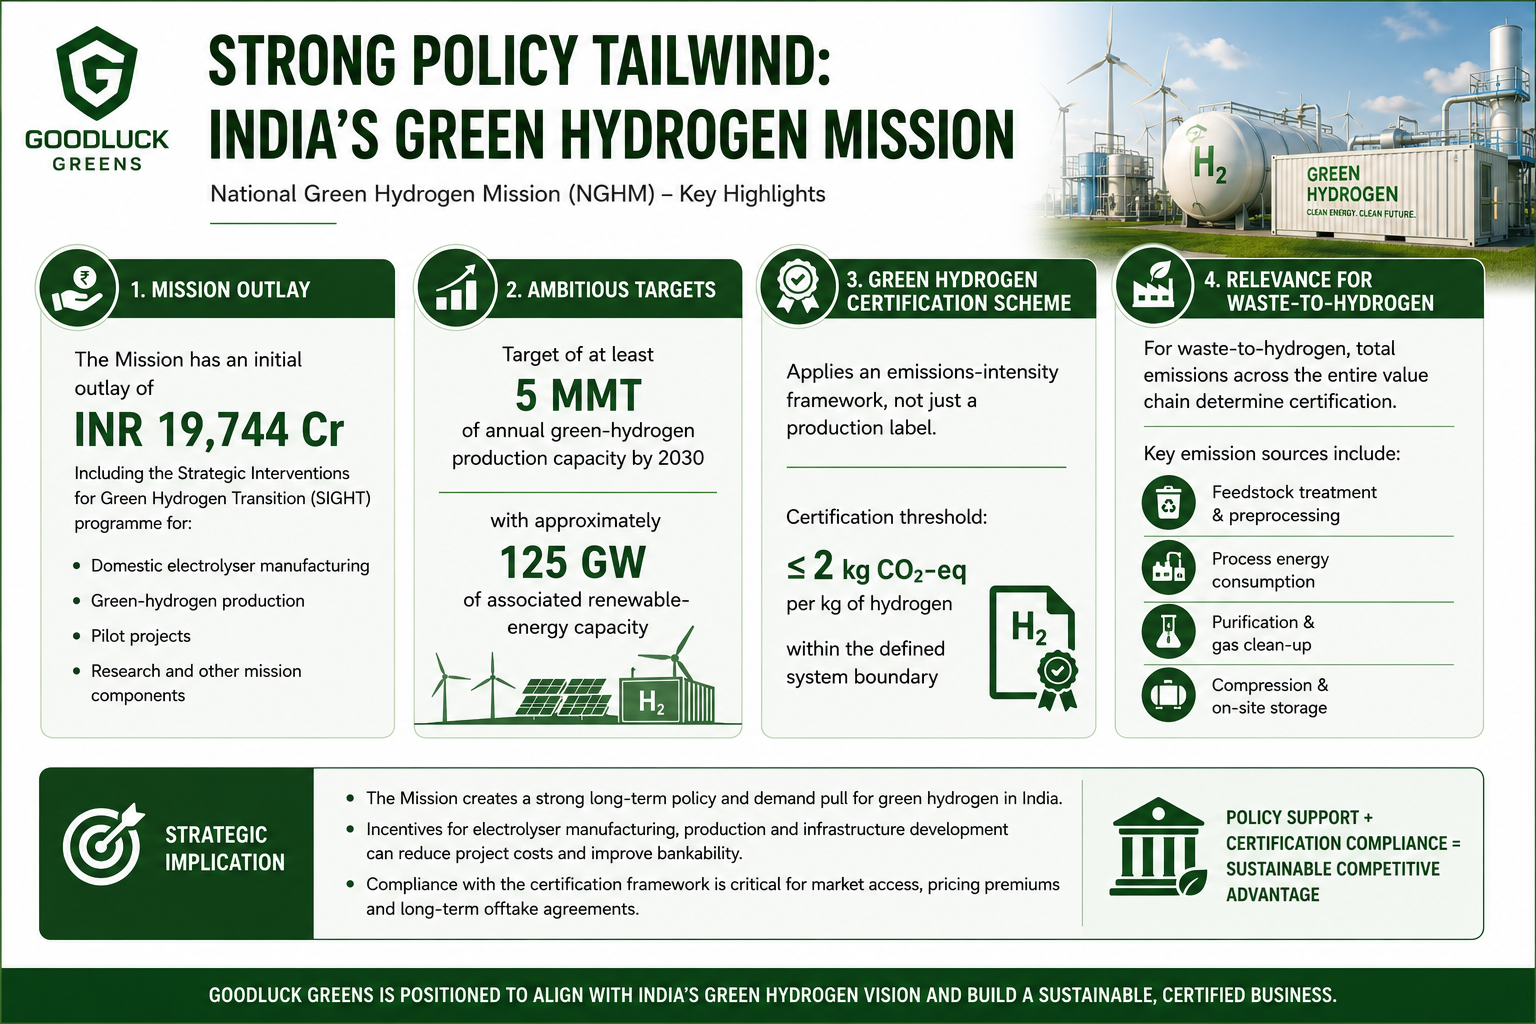
India's National Green Hydrogen Mission provides a strong sector-level policy tailwind. The Mission has an initial outlay of INR 19,744 Cr, including the Strategic Interventions for Green Hydrogen Transition (SIGHT) programme for domestic electrolyser manufacturing and green-hydrogen production, as well as allocations for pilot projects, research and other mission components
The Mission targets at least 5 MMT of annual green-hydrogen production capacity by 2030 with approximately 125 GW of associated renewable-energy capacity
The Green Hydrogen Certification Scheme applies an emissions-intensity framework rather than relying only on the production label. The certification framework uses a threshold of not more than 2 kg CO2-equivalent per kg of hydrogen within the defined system boundary
For a waste-to-hydrogen business, this is important because feedstock treatment, process energy, purification, compression and onsite storage emissions can determine whether output qualifies as certified green hydrogen
- Overview
- Business
- Financial Highlights
- Industry Overview
- Documentation
Get the Preqt App and keep in touch around the clock!
 Monitor your investments in real-time.
- Receive tailored deal suggestions.
- Get real-time updates and alerts.
