

HD Fire Protect
Protecting What MattersEngineering Fire Safety
IPO Summary (PreQT)
HD Fire Protect Limited is a long-established Indian manufacturer of fire protection equipment and suppression systems with vertically integrated manufacturing, international certifications and a diversified domestic/export customer base. FY26 revenue from operations was INR 489.3 Cr, Operating EBITDA was INR 150.5 Cr at a 30.8% margin and PAT was INR 116.8 Cr at a 23.1% margin. The balance sheet is debt-free, while exports contributed 34.7% of FY26 product revenue. The IPO is a pure Offer for Sale of 15.0% of existing equity; therefore, the Company receives no fresh capital and there is no primary dilution. At the announced price band of INR 258-271, the stock is offered at 40.7x P/E , above the lower end of the RHP peer range but supported by high margins, strong return ratios and a certification-led market position.
IPO Review Rating
Above Avg
MainboardDelivering Trusted Fire Protection Solutions Through Engineering and Innovation
HD Fire Protect has one of the stronger operating profiles among the IPOs we have scored: 14.5% revenue CAGR, ~31% EBITDA margin, ~23% PAT margin, 30%+ ROE, 40%+ ROCE, zero fund-based debt, positive operating cash flow and very low customer concentration. The Company's certification portfolio, global presence and exposure to an Indian fire-suppression market expected to grow at 11–13% CAGR further strengthen the business profile.
Valuation is mixed rather than outright expensive. The 40.7x P/E and ~31.5x EV/EBITDA are below the RHP peer benchmarks, but the peer set is imperfect because there are no directly comparable listed Indian fire-protection companies. The 12.6x P/B is high.
The most significant IPO-specific negative is the structure: the entire ₹712 Cr issue is an OFS, so the Company receives no fresh capital. However, the promoter and promoter group will continue to hold approximately 85% post-offer, limiting concerns around a complete promoter exit.
PARAMETER
WEIGHT
SCORE
KEY FACTORS
Financial Performance
40.0%
4.0/5
HD Fire Protect has a strong financial profile characterised by healthy revenue growth, ~31% EBITDA margins, ~23% PAT margins, high return ratios, positive cash generation, zero fund-based debt and low customer concentration. The principal financial monitoring point is the increase in the cash-conversion cycle to 102 days
Show more
Detailed Analysis
The Company's revenue from operations increased from INR 373.0 Cr in FY24 to INR 489.3 Cr in FY26, representing a healthy FY24–FY26 CAGR of approximately 14.5%
The Company generated a strong 30.8% operating EBITDA margin in FY26, compared with 28.6% in FY24, demonstrating high operating profitability despite a slight moderation from 31.9% in FY25
The Company's PAT margin remained strong at 23.1% in FY26, compared with 22.43% in FY24 and 24.4% in FY25
The Company has no fund-based outstanding borrowings, resulting in an effectively debt-free balance sheet and negligible financial leverage
The Company generated a strong 30.2% ROE in FY26, demonstrating efficient utilisation of shareholder capital
The Company generated INR 92.5 Cr of operating cash flow in FY26, compared with PAT of INR 116.8 Cr, while operating cash flow remained positive throughout FY24–FY26
Industry
15.0%
3.0/5
HD Fire operates in a structurally attractive, regulation-driven market with projected double-digit growth and meaningful barriers to entry. Its extensive certifications and international presence strengthen its competitive position.
Show more
Detailed Analysis
India's fire suppression equipment market is projected to grow at 11–13% CAGR between FY26 and FY31, increasing from approximately ₹82 Bn to ₹135–155 Bn
The industry faces substantial certification and compliance requirements involving BIS, NBC, OISD, UL, FM and other standards, creating ongoing compliance costs but also meaningful barriers to entry for established certified players
HD Fire Protect has exported to more than 90 countries and generated approximately 34.7% of FY26 revenue from exports, providing substantial scope for further international expansion
Management
15.0%
4.0/5
HD Fire benefits from experienced promoters, 50% Board independence, no promoter pledge and limited promoter litigation. The main governance deductions arise from significant promoter remuneration and the fact that the IPO is entirely an OFS.
Show more
Detailed Analysis
Chairman and Managing Director Harish Dharamshi has over 41 years of fire-protection industry experience, while Miheer Ghotikar, Anik Dharamshi and Parika Ghotikar each possess over 16 years of relevant experience
Four of the Company's eight Directors are Independent Directors, resulting in 50.0% Board independence, including one woman Independent Director
No promoter shares are pledged or encumbered, and the promoters have no disclosed criminal, material civil, regulatory or tax proceedings, although the Company has limited tax matters and two proceedings involving an Independent Director arising from her role at another company
Related-party operating transactions are largely promoter and management remuneration; FY26 remuneration to the four executive promoter-directors totalled approximately ₹20.0 Cr, which is material relative to the Company's scale and warrants monitoring
Valuation
20.0%
3.0/5
HD Fire's P/E and EV/EBITDA are below the broader industrial peer benchmarks, while its high margins and return ratios provide fundamental support. The major valuation negatives are the very high 12.6x P/B and the absence of any fresh-capital accretion
Show more
Detailed Analysis
HD Fire's 40.7x P/E is approximately 35.4% below the RHP peer average and 20.9% below the peer median, although the comparable set consists of broader industrial-equipment companies rather than direct listed fire-protection peers
HD Fire's approximately 31.5x EV/EBITDA is below the current peer average of ~42.1x and peer median of ~35.3x, providing reasonable relative valuation support
The Company is valued at approximately 12.6x FY26 book value, which is expensive on an absolute book-value basis and receives no post-issue improvement because the transaction contains no fresh capital
The Company generated a strong 31.0% FY26 RoNW, supporting a premium book-value multiple relative to lower-return businesses
Merchant Banker Track Record
10.0%
4.0/5
HD Fire has a strong and experienced three-BRLM consortium. The RHP-disclosed recent issues show an approximately 19.2% average opening gain and 77.3% positive-listing rate across the comparable sample. Historical subscription data is not disclosed in the RHP and is therefore kept pending
Show more
Detailed Analysis
Across the 22 recent IPOs disclosed in the three BRLM RHP tables, the arithmetic average opening-day listing gain is approximately 19.2%, indicating generally favourable historical listing performance
Historical IPO subscription multiples are not disclosed in the RHP's BRLM track-record tables
Approximately 77.3% of the 22 RHP-disclosed recent issues opened above their respective issue prices, with Anand Rathi recording the strongest positive-opening ratio within the disclosed sample
TOTAL
100%
3.6/5
Weighted Composite Score
Issue Price
₹258.0 to ₹271.0
As of 9 Oct 2026
GMP
₹73.0
As of 9 Oct 2026
Estimated Gain / Loss
+27.0%
Lot Size
55.0 Shares
Grey Market Premium (GMPs) are shared for knowledge purpose only. PrEqt doesn’t promote or execute the trades.
| Issue Size (in Cr) | |
|---|---|
| Overall | ₹712.0 Cr |
| Fresh Issue | ₹0.0 Cr |
| Offer for Sale | ₹712.0 Cr |
Minimum Investment
₹14,905.0 / 3,025 shares

Merchant Banker
Ambit Pvt.Ltd., Anand Rathi Advisors, IIFL Capital
Ambit Pvt.Ltd.
Anand Rathi Advisors
IIFL Capital
IPO Document
Offer Start Date
Offer End Date
Valuation
Revenue (FY'26)
PAT (FY'26)
Issue Size (in Cr)
Face Value
₹ 5.0Offer Price
₹ 271.0Lot Size
55.0 sharesSale Type
OFS onlyPAT (FY'26)
₹ 116.8 CrPAT Margin (FY'26)
23.1 %P/E Multiple
40.7xEBITDA (FY'26)
₹ 150.5 CrCAGR Growth 2Y
14.5 %ROE (FY'26)
30.2 %ROCE (FY'26)
40.3 %Price to Book Value
12.6xDebt/Equity
0.0xCompany Website
www.hdfire.comExplore new deals
Overview
Fund Allocation
Total: ₹0 CrSource:Company DRHP
Timeline
IPO Open Date
To Be Announced
IPO Close Date
To Be Announced
Tentative Allotment
To Be Announced
Initiation of Refunds
To Be Announced
Credit of Shares to Demat
To Be Announced
Tentative Listing Date
To Be Announced
Business
Business Model
Geographical Presence
Sales Channel
Key Risk Factors
Financial Highlights
Income Statement
Revenue growth with EBITDA and PAT margins
| Financial Metric | FY 2024 | FY 2025 | FY 2026 |
|---|---|---|---|
| Revenue (₹ Cr) | 373.0 | 432.8 | 489.3 |
| Growth (%) | - | 16.0% | 13.1% |
| EBITDA (₹ Cr) | 106.6 | 138.0 | 150.5 |
| EBITDA Margin (%) | 28.6% | 31.9% | 30.8% |
| PAT (₹ Cr) | 87.9 | 109.7 | 116.8 |
| PAT Margin (%) | 22.4% | 24.4% | 23.1% |
OBSERVATIONS & INSIGHTS
Revenue increased 16.0% in FY25 and 13.1% in FY26, supported by compliance-led domestic demand, stronger distributor penetration and export volumes. Growth moderated in FY26 but remained double-digit
EBITDA rose from INR 106.6 Cr to INR 150.5 Cr over FY24-FY26. Margin expanded to 31.9% in FY25 as scale and operating leverage improved, then moderated to 30.8% in FY26 as purchases of stock-in-trade and other operating costs grew faster than revenue
PAT increased 24.8% in FY25 and 6.4% in FY26. FY26 PAT growth lagged revenue growth because EBITDA margin softened and other income declined, although the debt-free balance sheet kept finance costs immaterial. PAT Margin improved from 22.4% in FY24 to 24.4% in FY25, then eased to 23.1% in FY26, broadly mirroring EBITDA-margin movement
Balance Sheet
| Financial Metric | FY 2024 | FY 2025 | FY 2026 |
|---|---|---|---|
| Net Worth | ₹ 342.2 Cr | ₹ 396.0 Cr | ₹ 375.9 Cr |
| Total Assets | ₹ 392.6 Cr | ₹ 450.1 Cr | ₹ 432.0 Cr |
| Reserves & Surplus | ₹ 332.2 Cr | ₹ 302.6 Cr | ₹ 286.1 Cr |
OBSERVATIONS & INSIGHTS
Net worth: Declined 5.1% to ₹375.9 Cr in FY26 from ₹396.0 Cr. Dividend payments of ₹140.2 Cr, exceeding FY26 PAT of ₹116.8 Cr, explain the reduction
Total assets: Fell 4.0% to ₹432.0 Cr in FY26, but remained 10.0% above FY24. Net worth represents approximately 87.0% of total assets, indicating a strong capital base
Reserves & surplus: Reduced from ₹332.2 Cr in FY24 to ₹286.1 Cr in FY26, reflecting capitalisation of reserves for FY25 bonus issues and dividend distributions
Cash Flow
| Financial Metric | FY 2024 | FY 2025 | FY 2026 |
|---|---|---|---|
CFO in Cr Cash generated from core business operations. | +63.8 Cr | +98.3 Cr | +92.5 Cr |
CFI in Cr Cash used in / generated from investing activities. | -33.0 Cr | -52.6 Cr | +41.0 Cr |
CFF in Cr Cash from / used in financing activities. | -22.9 Cr | -49.2 Cr | -136.1 Cr |
Working Capital
| Efficiency Metric | FY 2023 | FY 2024 | FY 2025 |
|---|---|---|---|
Debtor Days Average number of days taken to collect customer payments. | - | - | - |
Creditor Days Average time taken to pay suppliers and vendors. | - | - | - |
Inventory Days Average number of days inventory remains unsold. | - | - | - |
CCC (Cash Conversion Cycle) (Debtor Days + Inventory Days - Creditor Days) | - | - | - |
Financial Ratios
Measures the company’s leverage relative to shareholder equity.
OBSERVATIONS & INSIGHTS
ROE Improved as PAT growth exceeded the growth in average tangible net worth
Company remained debt-free across all three fiscal years
Interest Coverage declined mechanically as immaterial finance costs rose; still not economically meaningful for a debt-free company
FY25 softened on lower current assets/higher current liabilities; FY26 recovered as current assets expanded faster
ROA improved as PAT growth outpaced average asset growth
Steady improvement reflects higher EBIT generation on a debt-free capital base
Industry Overview
Industry Drivers
Industrial & Infrastructure Capex
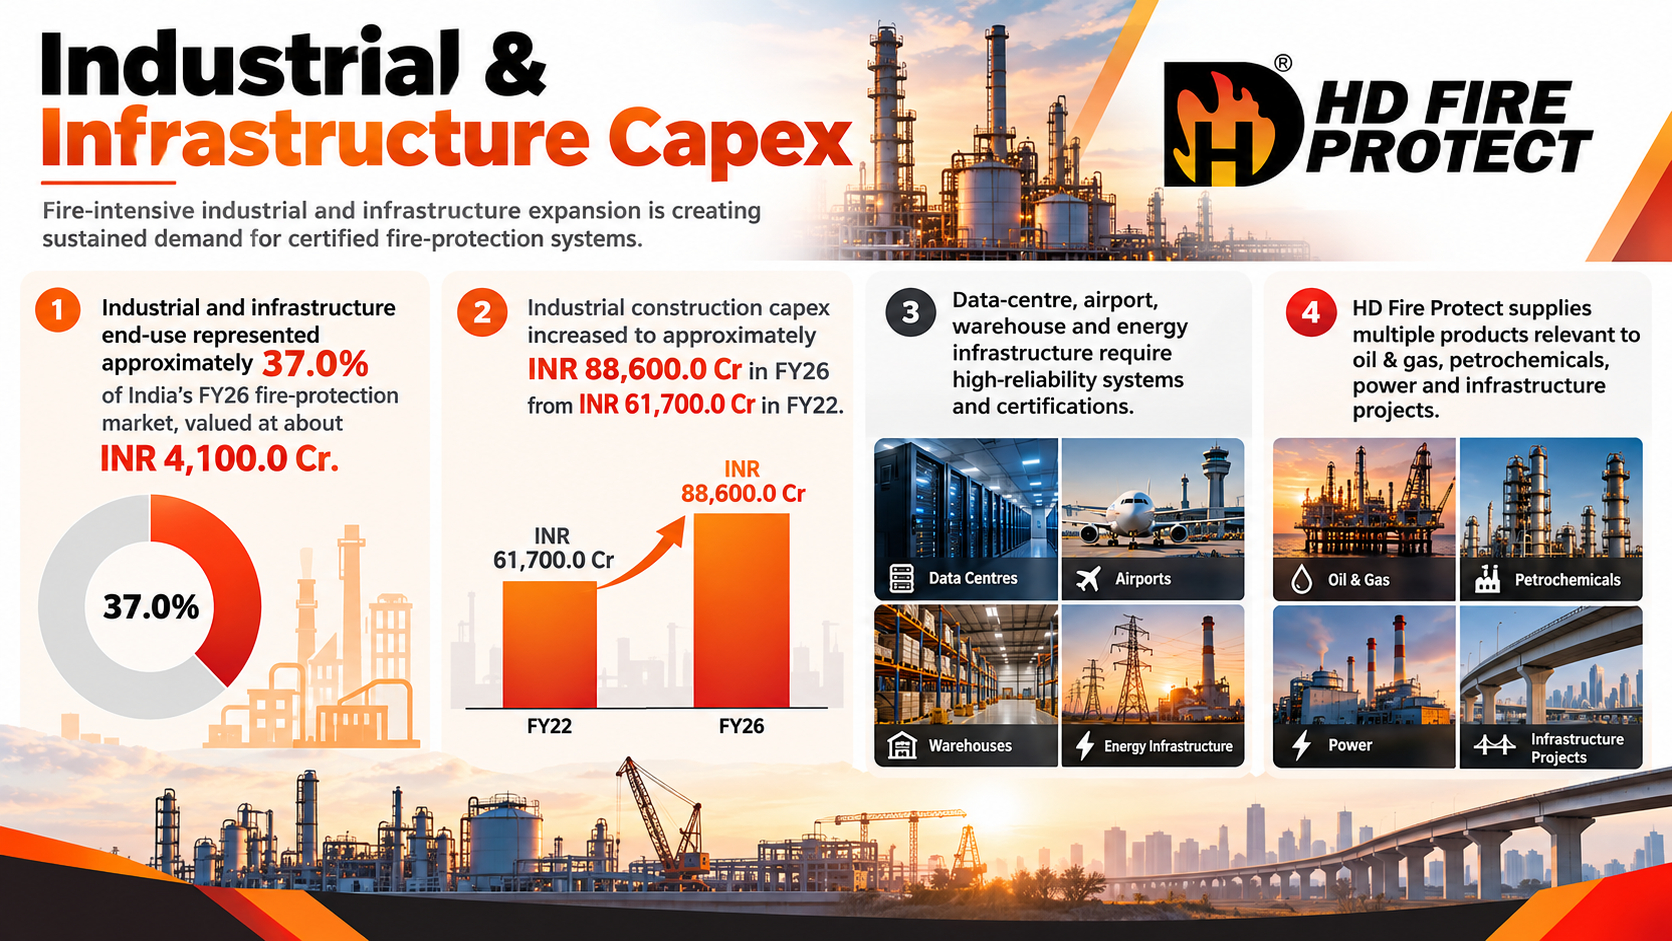
Industrial and infrastructure end-use represented approximately 37.0% of India's FY26 fire-protection market, valued at about INR 4,100.0 Cr. Oil & gas, power, airports, data centres, warehouses, metros and manufacturing capacity additions create fire-intensive installations that require specialised suppression equipment.
The key drivers are:
Industrial construction capex increased to approximately INR 88,600.0 Cr in FY26 from INR 61,700.0 Cr in FY22
Data-centre, airport, warehouse and energy infrastructure require high-reliability systems and certifications
HD Fire Protect supplies multiple products relevant to oil & gas, petrochemicals, power and infrastructure projects
Regulation, Compliance & Insurance
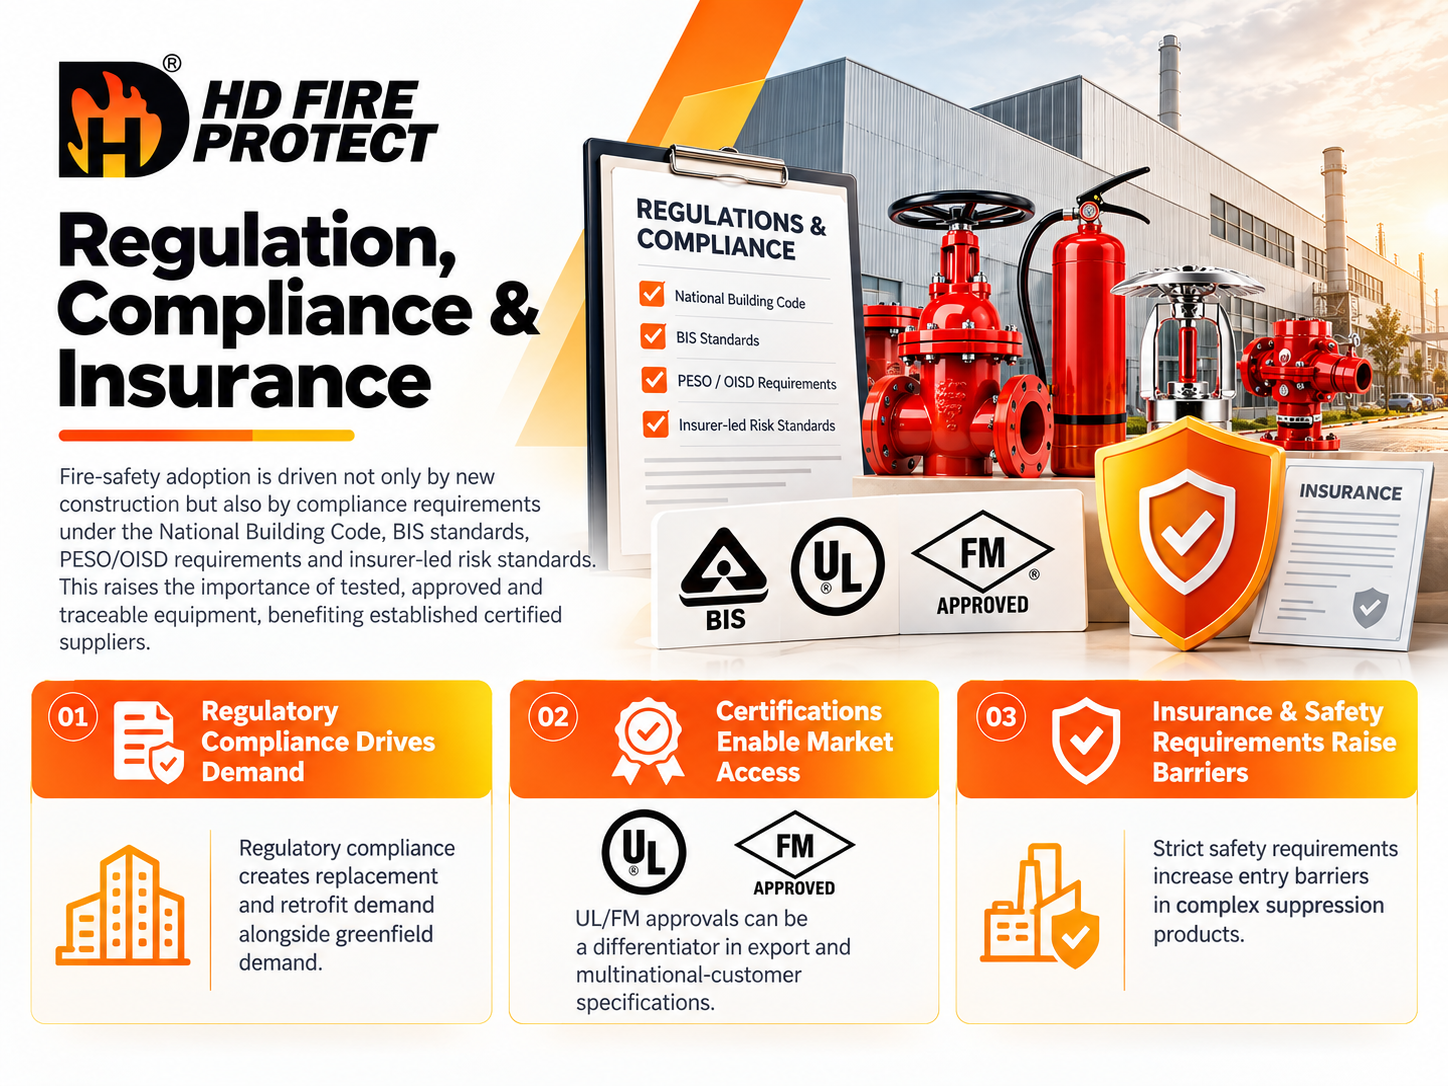
Fire-safety adoption is driven not only by new construction but also by compliance requirements under the National Building Code, BIS standards, PESO/OISD requirements and insurer-led risk standards. This raises the importance of tested, approved and traceable equipment, benefiting established certified suppliers.
The key drivers are:
Regulatory compliance creates replacement and retrofit demand alongside greenfield demand
UL/FM approvals can be a differentiator in export and multinational-customer specifications
Strict safety requirements increase entry barriers in complex suppression products
Import Substitution & Export Opportunity
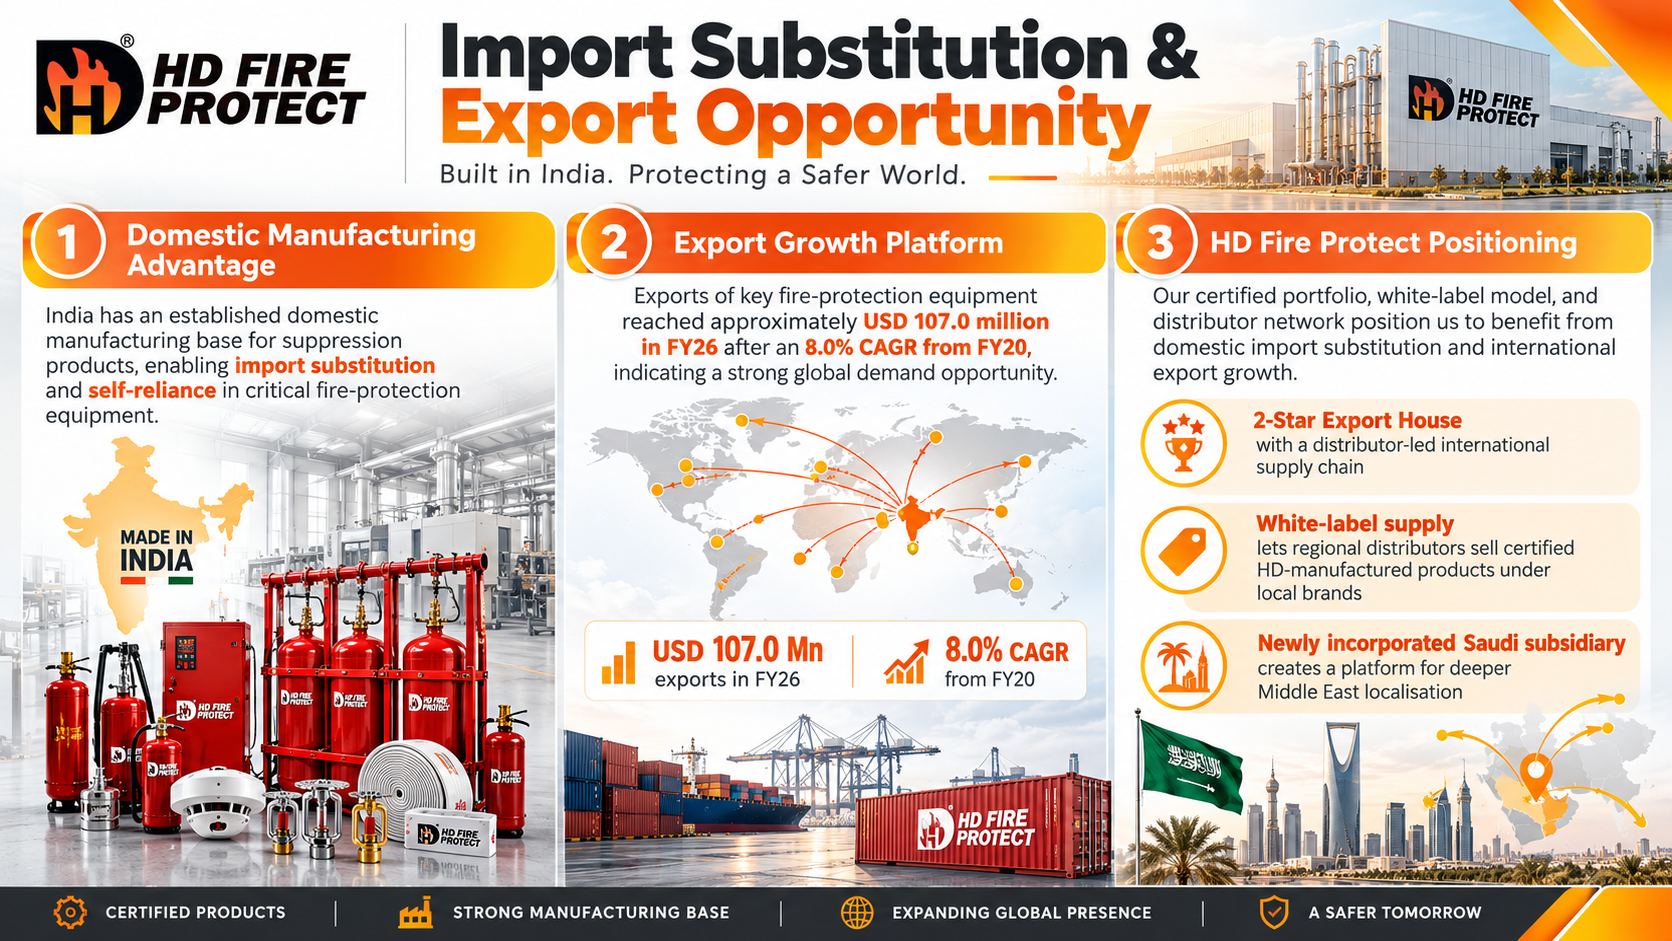
India has an established domestic manufacturing base for suppression products, while exports of key fire-protection equipment reached approximately USD 107.0 million in FY26 after an 8.0% CAGR from FY20. HD Fire Protect's certified portfolio, white-label model and distributor network position it to participate in import substitution domestically and export growth internationally.
The key drivers are:
The Company is a 2-Star Export House and operates a distributor-led international supply chain
White-label supply lets regional distributors sell certified HD-manufactured products under local brands
A newly incorporated Saudi subsidiary provides a platform for deeper Middle East localisation
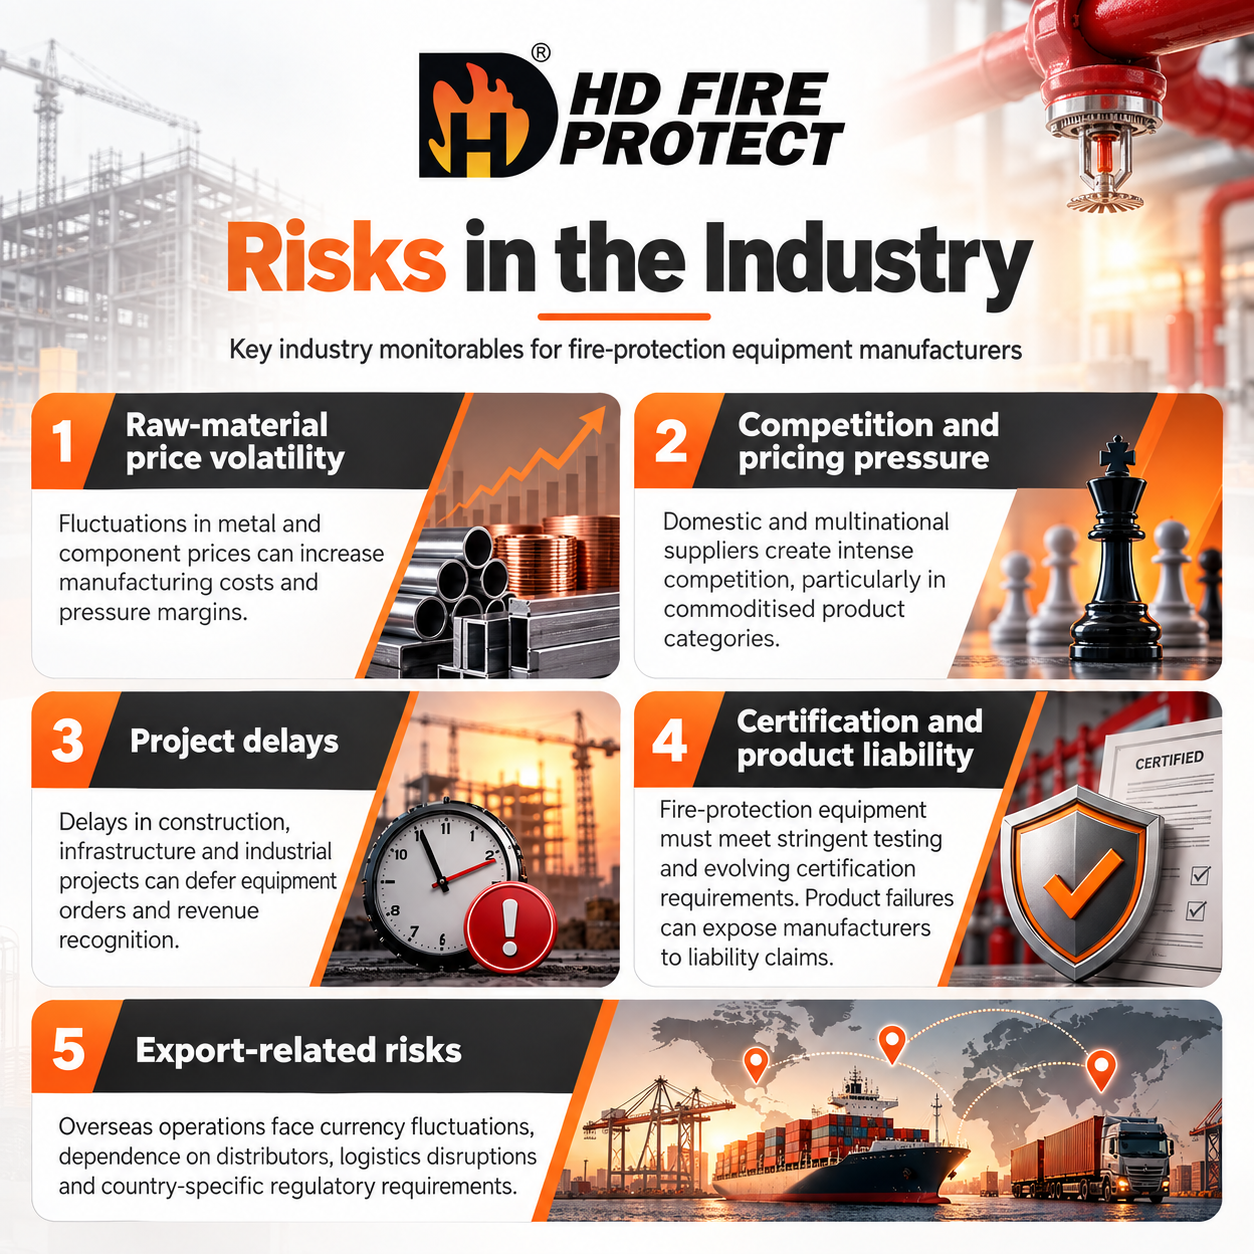
Risks in the Industry
The sector is exposed to raw-material and commodity-price volatility, competition from domestic and multinational suppliers, project and construction-cycle delays, evolving certification requirements and product-liability risk. Complex fire-protection products must meet stringent test standards, while commoditised product categories can face pricing pressure. Export-oriented manufacturers also face currency, distributor, logistics and country-regulatory risks
The key risks are:
Raw-material price volatility: Fluctuations in metal and component prices can increase manufacturing costs and pressure margins
Competition and pricing pressure: Domestic and multinational suppliers create intense competition, particularly in commoditised product categories
Project delays: Delays in construction, infrastructure and industrial projects can defer equipment orders and revenue recognition
Certification and product liability: Fire-protection equipment must meet stringent testing and evolving certification requirements. Product failures can expose manufacturers to liability claims
Export-related risks: Overseas operations face currency fluctuations, dependence on distributors, logistics disruptions and country-specific regulatory requirements
Government Policy Support
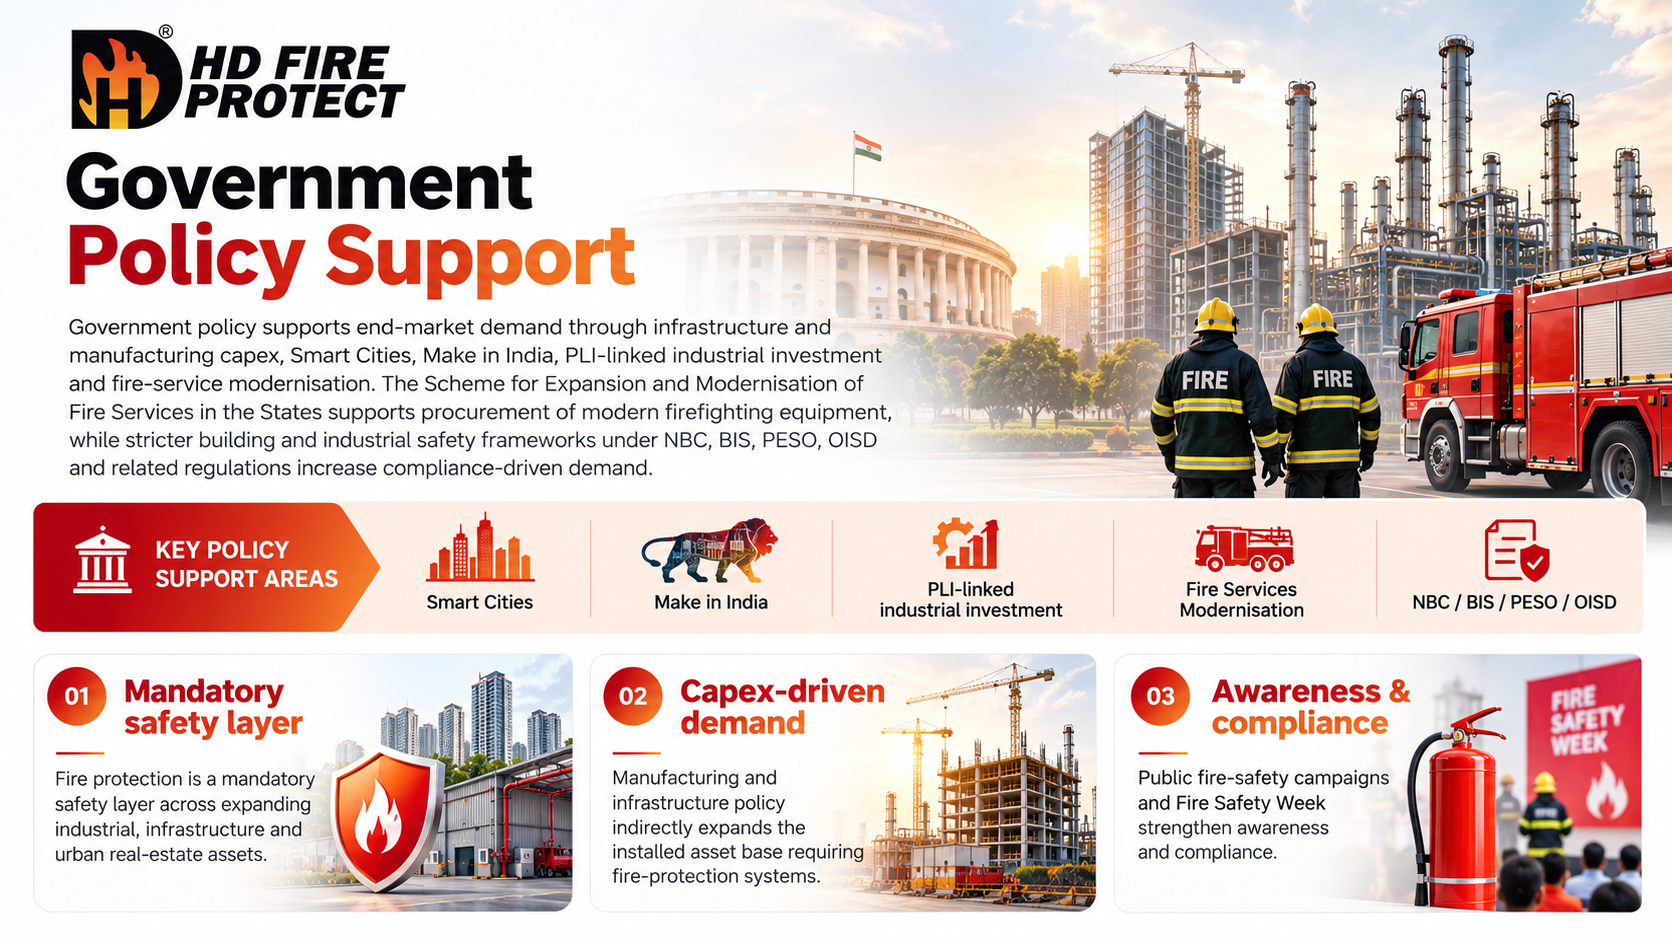
Government policy supports end-market demand through infrastructure and manufacturing capex, Smart Cities, Make in India, PLI-linked industrial investment and fire-service modernisation. The Scheme for Expansion and Modernisation of Fire Services in the States supports procurement of modern firefighting equipment, while stricter building and industrial safety frameworks under NBC, BIS, PESO, OISD and related regulations increase compliance-driven demand.
The key policies are:
Fire protection is a mandatory safety layer across expanding industrial, infrastructure and urban real-estate assets
Manufacturing and infrastructure policy indirectly expands the installed asset base requiring fire-protection systems
Public fire-safety campaigns and Fire Safety Week strengthen awareness and compliance
Fundraise/Future Plans
Shareholding
Pre-issue shareholding
Promoter Holding 0.0%
Post-Issue Shareholding
Promoter Holding 0.0%
Category
Pre-Issue%Post-Issue%
Promoters
Harish Narshi Dharamshi
56.1%51.0%
Kusum Harish Dharamshi
17.8%8.0%
Miheer Sadanand Ghotikar
10.5%10.5%
Parika Miheer Ghotikar
6.6%6.6%
Anik Narendra Dharamshi
4.3%4.3%
Total Promoter Holding
95.3%80.4%
Additional Shareholders
Other Shareholders
4.7%19.6%
Total Additional Holding
4.7%19.6%
Total Shareholding
100.0%100.0%
- Overview
- Business
- Financial Highlights
- Industry Overview
- Fundraise/Future Plans
- Documentation
Get the Preqt App and keep in touch around the clock!
 Monitor your investments in real-time.
- Receive tailored deal suggestions.
- Get real-time updates and alerts.
