


HDFC Securities ltd
Invest with ConfidenceBuilding Financial Confidence
Unlisted Review Rating
Apply
DRHP Not FiledEmpowering Investors Through Trusted Research and Seamless Market Access
HDFC Securities combines strong historical earnings growth, exceptional return ratios, an established banking parentage and an attractive headline P/E discount. The business is also successfully diversifying beyond traditional brokerage into MTF, wealth management, research and financial-product distribution.
PARAMETER
WEIGHT
SCORE
KEY FACTORS
Financial Performance
25.0%
4.0/5
The Company delivered strong revenue growth, high profitability and exceptional ROE
Show more
Detailed Analysis
Total income increased from INR 1,891.6 Cr in FY23 to INR 3,264.6 Cr in FY25, representing a 2-year CAGR of 31.4%. Total income grew by 22.7% in FY25, from INR 2,660.7 Cr in FY24
EBITDA increased from INR 1,935.9 Cr in FY24 to INR 2,350.7 Cr in FY25, representing growth of 21.4%. EBITDA margin moderated from 72.8% to 72.0%
PAT increased from INR 950.9 Cr in FY24 to INR 1,124.5 Cr in FY25, representing growth of 18.3%
Debt securities and other borrowings stood at INR 7,943.8 Cr in FY25, against total equity of INR 3,348.0 Cr, resulting in a debt-to-equity ratio of 2.4x
FY25 PAT of INR 1,124.5 Cr, against average FY24–FY25 equity of INR 2,688.6 Cr, resulted in an ROE of 41.8%. ROE declined from approximately 49.7% in FY24, primarily because of the expansion in equity capital
Operating cash flow improved from negative INR 2,747.0 Cr in FY24 to positive INR 2,381.0 Cr in FY25, representing a cash-flow turnaround of INR 5,127.9 Cr
Industry
25.0%
3.0/5
The long-term financialisation of Indian savings remains favourable. However, growth is likely to be more moderate than during the post-pandemic account-opening boom
Show more
Detailed Analysis
A sample of 41 brokers reported approximately 20.0% growth in net operating income in FY25. Regulatory changes and weaker trading activity subsequently resulted in an estimated 6.0% revenue contraction in H1 FY26, while industry net operating income is expected to recover by approximately 10.0% in FY27
NSE active clients reached 49.2 million in FY25, while the industry is now transitioning from rapid account-led expansion towards monetisation through MTF, wealth management and diversified financial products
The FY25 secretarial-audit disclosures state that SEBI issued warning or action letters, imposed penalties and issued a show-cause notice for certain deficiencies. Broking-sector revenue has also been affected by regulatory measures restricting speculative trading activity
Management
25.0%
4.0/5
Management experience and board independence are credible. Related-party transactions are moderate rather than excessive, despite HDFC Securities being an HDFC Bank subsidiary
Show more
Detailed Analysis
Managing Director and CEO Dhiraj Relli has more than 30.0 years of experience across capital markets, banking, investments and financial services. He continues to lead the Company’s transition from traditional broking towards digital broking, wealth management and diversified financial services
As of March 31, 2025, the board comprised 8.0 directors, including 4.0 independent directors, representing independent participation of 50.0%. The remaining directors comprised two executives and two nominees
SEBI issued a settlement order relating to HDFC Securities in March 2025, while the annual report records penalties, warning or action letters and a show-cause notice. Company-level regulatory matters have therefore been used as a governance-risk proxy
Valuation
25.0%
4.0/5
HDFC Securities appears attractive on the headline P/E measure
Show more
Detailed Analysis
The Company is valued at a P/E multiple of 16.0x, compared with the capital-markets industry P/E of 55.0x, representing a discount of 70.9%
HDFC Securities is valued at approximately 9.3x EV/EBITDA. The selected peer median is also 9.3x
The unlisted share price declined from approximately INR 8,800.0 on July 6, 2026 to INR 8,300.0 on July 23, 2026, representing an observed decline and price range of approximately 5.7%
TOTAL
100%
3.8/5
Weighted Composite Score
Per Share Price
₹8802.0
As of 14 Oct 2026
Lot Size
50.0 Shares
Minimum Investment
₹8,80,200.0 / 100 shares
Market Cap. (₹ Cr)
Revenue FY’25 (in Cr)
PAT FY’25 (in Cr)
P/E Multiple
Face Value
₹ 10.0Lot Size
50.0 sharesSale Type
PrimaryPAT FY’25 (in Cr)
₹ 1,121.0 CrPAT Margin (%)
34.4 %P/E Multiple
16.9xCAGR Growth 3Y
31.4 %ROE (FY’25)
41.8 %ROCE (FY’25)
66.7 %Price to Book Value ratio
4.3xDebt/Equity (FY’25)
2.3xMerchant banker appointed
❌ NoCompany Website
www.hdfcsec.comDisclaimer: Unlisted shares are unregulated & illiquid. This is NOT investment advice. Please do your own due diligence before investing.
Minimum Investment
₹8,80,200.0 / 100 sharesShares Lot 50 X 2
Investment amount
₹8,80,200.0
Overview
Business
Business Model
Geographical Presence
Sales Channel
Financial Highlights
Income Statement
Revenue growth with EBITDA and PAT margins
| Financial Metric | FY 2023 | FY 2024 | FY 2025 |
|---|---|---|---|
| Revenue (₹ Cr) | 1,874.0 | 2,660.1 | 3,263.8 |
| Growth (%) | -5.1% | 40.7% | 22.7% |
| EBITDA (₹ Cr) | 1,395.2 | 1,935.8 | 2,350.6 |
| EBITDA Margin (%) | 73.8% | 72.7% | 72.0% |
| PAT (₹ Cr) | 777.2 | 950.8 | 1,124.4 |
| PAT Margin (%) | 41.1% | 35.7% | 34.4% |
OBSERVATIONS & INSIGHTS
Total income increased from ₹1,891.63 Cr in FY23 to ₹3,264.55 Cr in FY25, reflecting strong scale-up across broking, interest income and fee-based lines.
PAT increased from ₹777.22 Cr in FY23 to ₹1,124.46 Cr in FY25, although PAT margin moderated from 41.1% to 34.4% due to higher finance costs and operating expenses.
EBITDA increased from ₹1,395.23 Cr in FY23 to ₹2,350.66 Cr in FY25, with EBITDA margin remaining high at around 72%.
FY25 performance was supported by higher equity turnover, product expansion and deeper digital adoption across investing platforms.
Balance Sheet
| Financial Metric | FY 2023 | FY 2024 | FY 2025 |
|---|---|---|---|
| EQUITY & LIABILITIES | ₹ 8,267.7 Cr | ₹ 14,102.8 Cr | ₹ 14,030.4 Cr |
| Net Worth | ₹ 1,797.0 Cr | ₹ 2,029.1 Cr | ₹ 3,347.9 Cr |
| Share Capital | ₹ 15.8 Cr | ₹ 15.9 Cr | ₹ 17.7 Cr |
| Reserves & Surplus | ₹ 1,781.2 Cr | ₹ 2,013.2 Cr | ₹ 3,330.2 Cr |
| Total Liabilities | ₹ 6,470.7 Cr | ₹ 12,073.7 Cr | ₹ 10,682.5 Cr |
| Current Liabilities | ₹ 6,399.4 Cr | ₹ 12,010.1 Cr | ₹ 10,611.7 Cr |
| Borrowings | ₹ 5,254.1 Cr | ₹ 9,532.5 Cr | ₹ 7,943.7 Cr |
| Trade Payables | ₹ 981.9 Cr | ₹ 2,174.5 Cr | ₹ 2,396.2 Cr |
| Other Current Liabilities | ₹ 163.4 Cr | ₹ 303.1 Cr | ₹ 271.8 Cr |
| Non-Current Liabilities | ₹ 71.3 Cr | ₹ 63.6 Cr | ₹ 70.8 Cr |
| Borrowings | ₹ 0.0 Cr | ₹ 0.0 Cr | ₹ 0.0 Cr |
| Other Non-Current Liabilities | ₹ 71.3 Cr | ₹ 63.6 Cr | ₹ 70.8 Cr |
| ASSETS | ₹ 8,267.8 Cr | ₹ 14,102.8 Cr | ₹ 14,030.5 Cr |
| Current Assets | ₹ 7,187.1 Cr | ₹ 12,863.9 Cr | ₹ 12,574.4 Cr |
| Trade Receivables | ₹ 371.5 Cr | ₹ 1,286.5 Cr | ₹ 1,176.5 Cr |
| Inventory | ₹ 0.0 Cr | ₹ 0.0 Cr | ₹ 0.0 Cr |
| Cash & Cash Equivalents | ₹ 3,509.5 Cr | ₹ 5,300.5 Cr | ₹ 5,687.3 Cr |
| Other Current Assets | ₹ 3,306.1 Cr | ₹ 6,276.9 Cr | ₹ 5,710.6 Cr |
| Non-Current Assets | ₹ 1,080.7 Cr | ₹ 1,238.9 Cr | ₹ 1,456.1 Cr |
| Fixed Assets | ₹ 206.8 Cr | ₹ 227.1 Cr | ₹ 247.3 Cr |
| Other Non-Current Assets | ₹ 873.9 Cr | ₹ 1,011.8 Cr | ₹ 1,208.8 Cr |
OBSERVATIONS & INSIGHTS
Net worth increased from ₹1,797.14 Cr in FY23 to ₹3,348.02 Cr in FY25, supported by retained earnings and capital issuance.
Total assets expanded from ₹8,268.01 Cr in FY23 to ₹14,030.66 Cr in FY25, mainly reflecting growth in bank balances, loans, receivables and investments.
Current assets remain significantly high because broking and funded products require liquidity, bank balances and short-tenor financial assets.
Current borrowings primarily consist of debt securities / commercial papers and other borrowings used to fund business activity.
Non-current liabilities remain low relative to the balance sheet, indicating limited long-term liability intensity outside leases and provisions.
Cash Flow
| Financial Metric | FY 2023 | FY 2024 | FY 2025 |
|---|---|---|---|
CFO (₹ Cr) Cash generated from core business operations. | +370.8 Cr | -2,746.9 Cr | +2,380.9 Cr |
CFI (₹ Cr) Cash used for investments and long-term assets. | -973.4 Cr | +207.0 Cr | -138.1 Cr |
CFF (₹ Cr) Cash flow related to funding and borrowings. | -323.2 Cr | +2,945.9 Cr | -2,209.9 Cr |
Financial Ratios
Measures the company’s leverage relative to shareholder equity.
OBSERVATIONS & INSIGHTS
ROE remained strong across FY23-FY25, supported by high profitability and relatively asset-light operating economics.
Debt/equity reduced to 2.37x in FY25 from 4.70x in FY24 as net worth increased materially and borrowings declined.
Interest coverage declined from 4.52x in FY23 to 2.90x in FY25 due to higher finance costs, which should be monitored given the growth in funded products such as MTF.
Current ratio remained above 1.0x across FY23-FY25 based on maturity-analysis current assets and liabilities.
Industry Overview
Industry Drivers
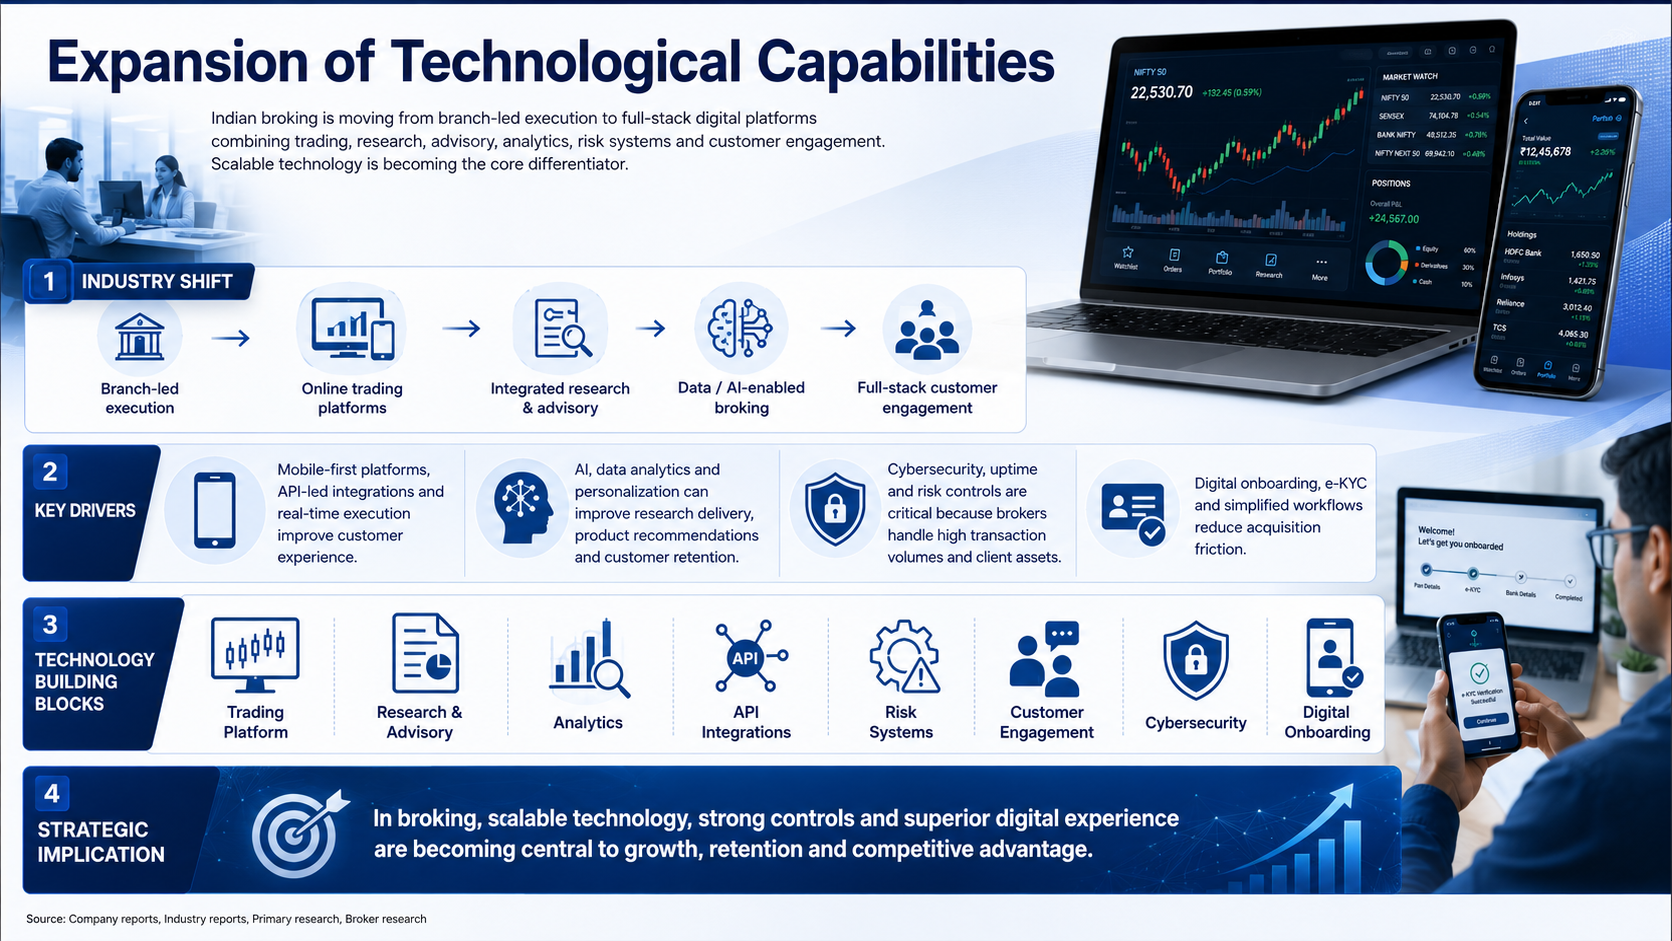
Expansion of Technological Capabilities
Expansion of Technological Capabilities
Indian broking is moving from branch-led execution to full-stack digital platforms combining trading, research, advisory, analytics, risk systems and customer engagement. Scalable technology is becoming the core differentiator.
Key Drivers:
Mobile-first platforms, API-led integrations and real-time execution improve customer experience.
AI, data analytics and personalization can improve research delivery, product recommendations and customer retention.
Cybersecurity, uptime and risk controls are critical because brokers handle high transaction volumes and client assets.
Digital onboarding, e-KYC and simplified workflows reduce acquisition friction
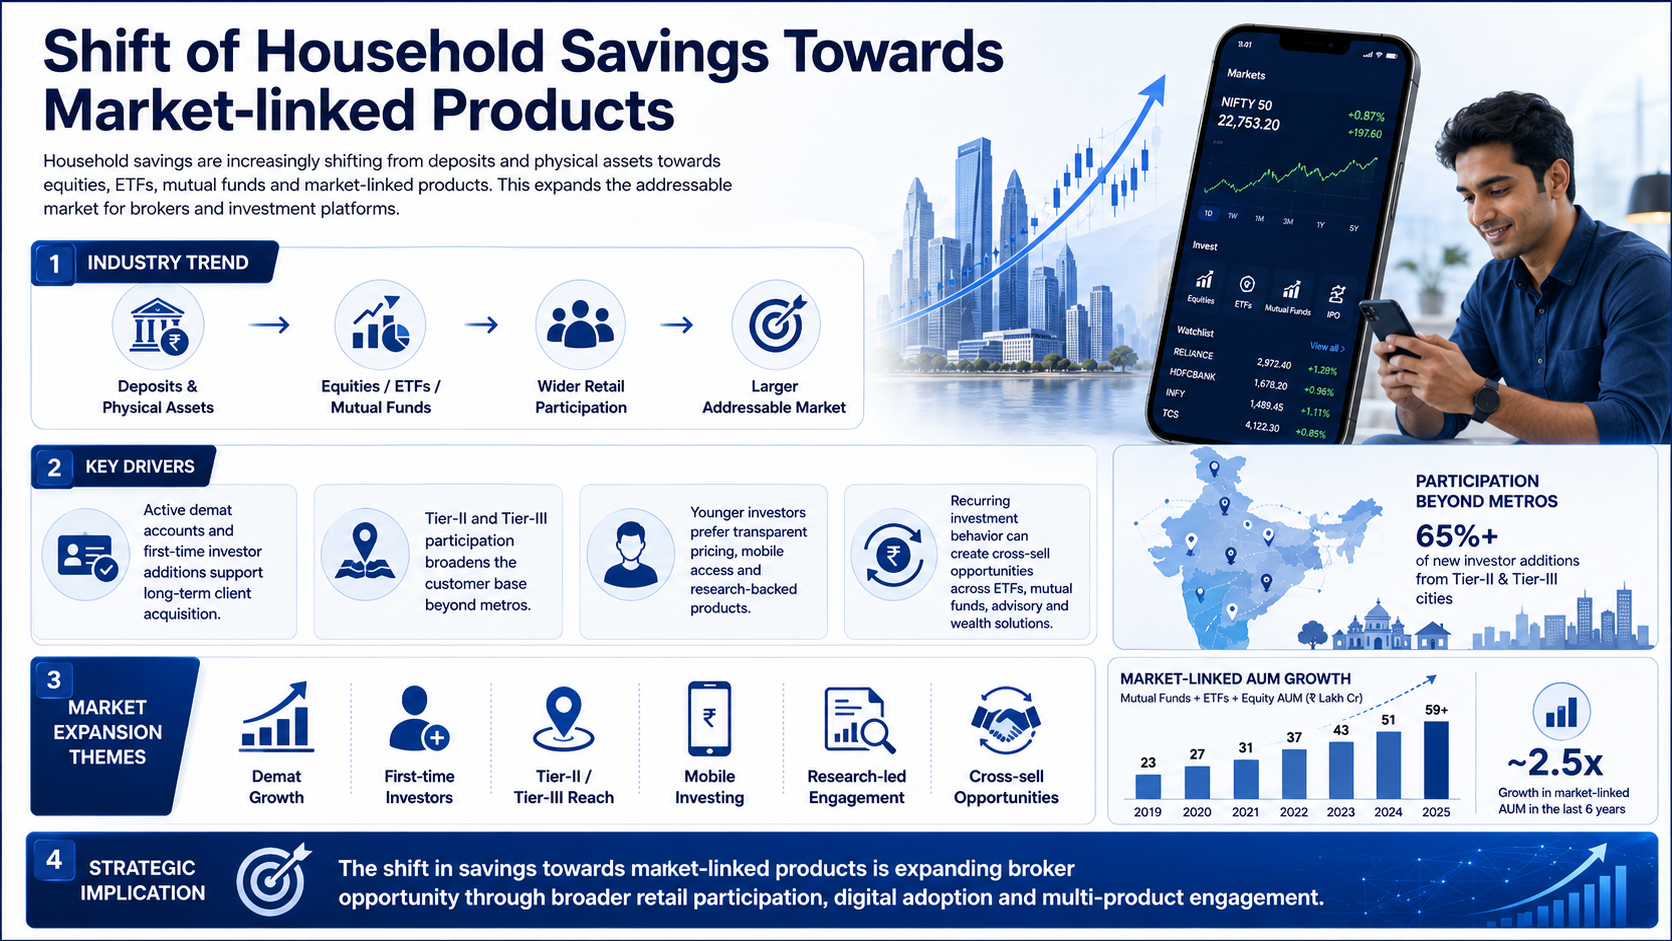
Retail Participation and Financialization of Savings
Household savings are increasingly shifting from deposits and physical assets towards equities, ETFs, mutual funds and market-linked products. This expands the addressable market for brokers and investment platforms.
Key Drivers:
Active demat accounts and first-time investor additions support long-term client acquisition.
Tier-II and Tier-III participation broadens the customer base beyond metros.
Younger investors prefer transparent pricing, mobile access and research-backed products.
Recurring investment behavior can create cross-sell opportunities across ETFs, mutual funds, advisory and wealth solutions.
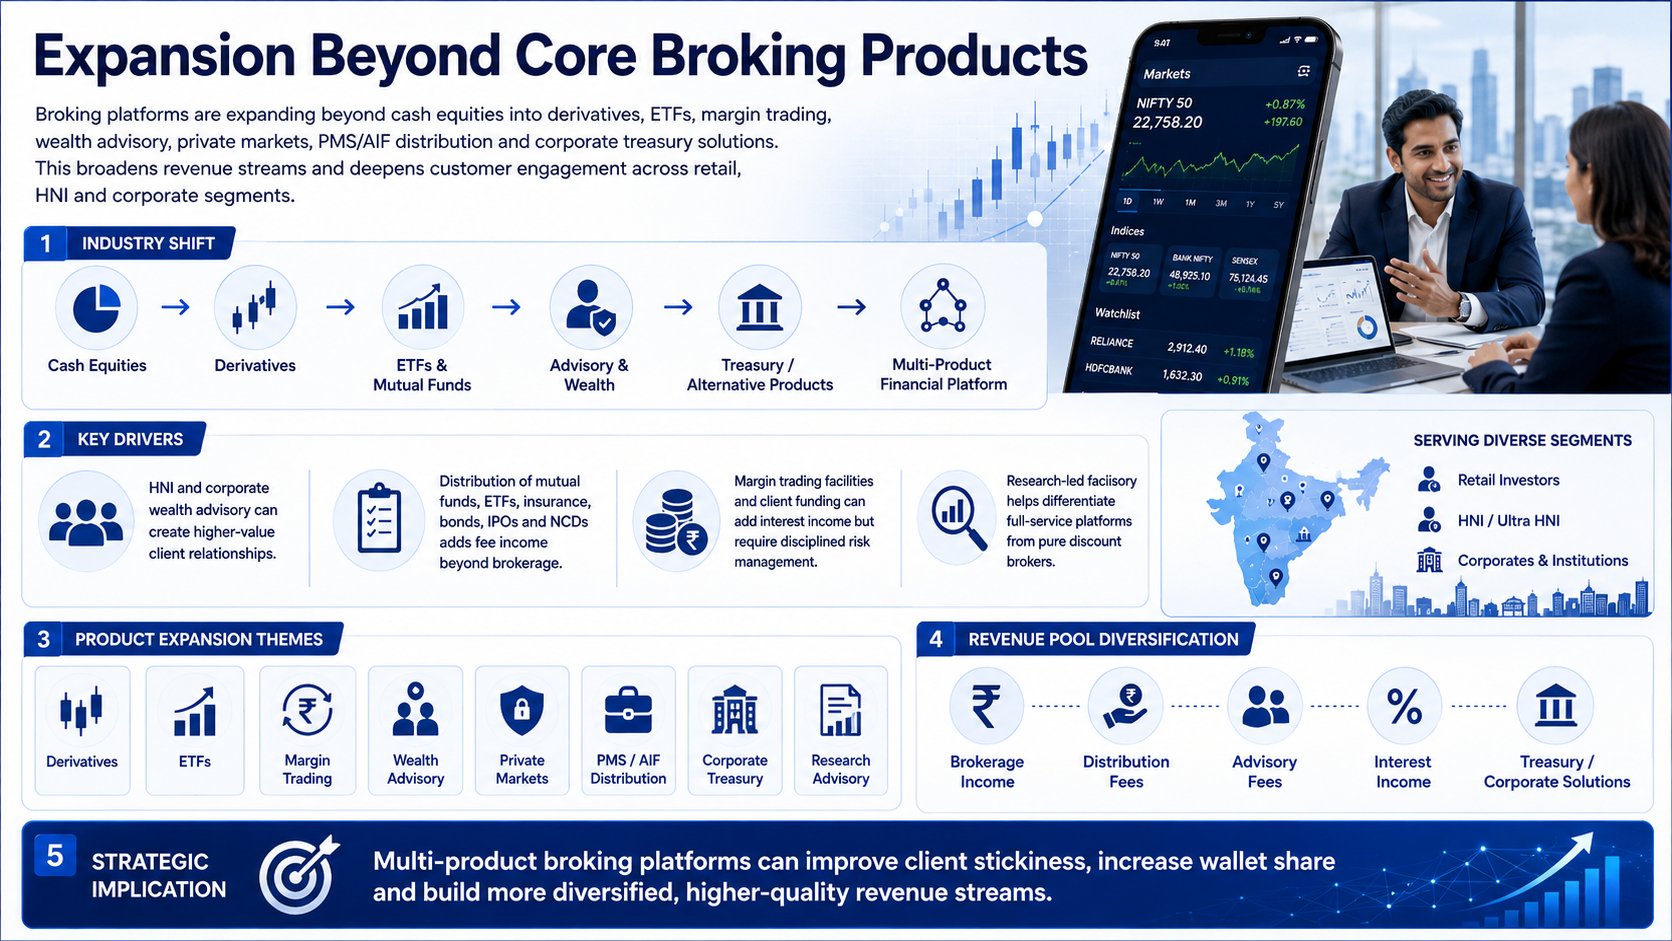
Product Diversification and Wealth Advisory
Broking platforms are expanding beyond cash equities into derivatives, ETFs, margin trading, wealth advisory, private markets, PMS/AIF distribution and corporate treasury solutions.
Key Drivers:
HNI and corporate wealth advisory can create higher-value client relationships.
Distribution of mutual funds, ETFs, insurance, bonds, IPOs and NCDs adds fee income beyond brokerage.
Margin trading facilities and client funding can add interest income but require disciplined risk management.
Research-led advisory helps differentiate full-service platforms from pure discount brokers.
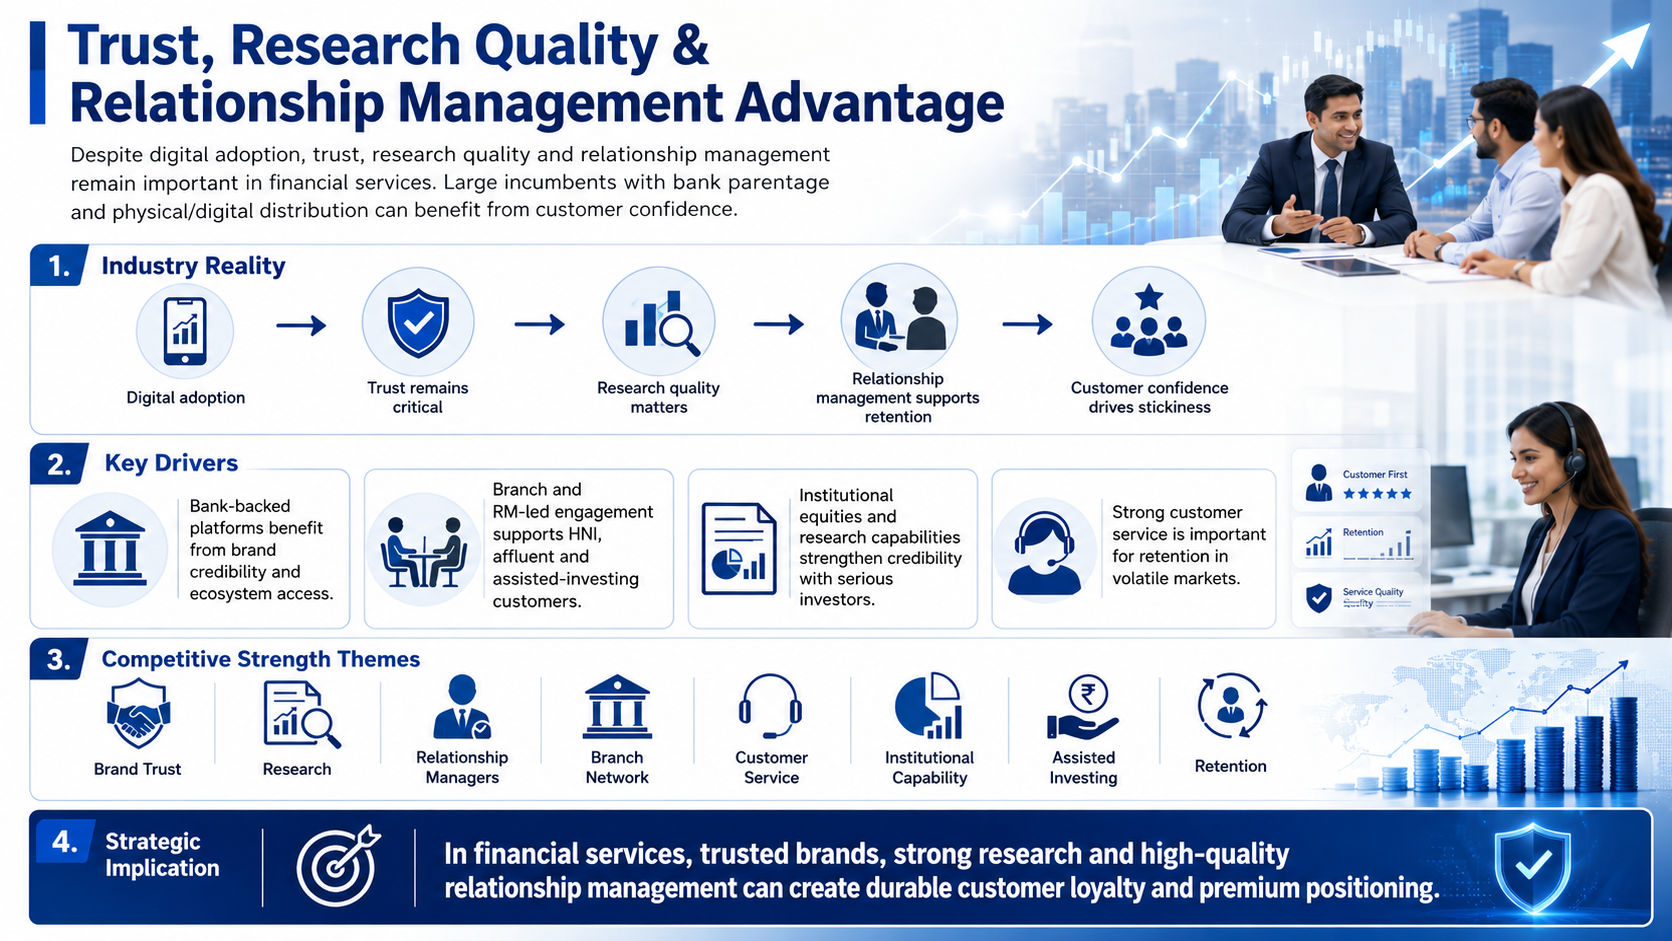
Distribution Reach and Brand Trust
Despite digital adoption, trust, research quality and relationship management remain important in financial services. Large incumbents with bank parentage and physical/digital distribution can benefit from customer confidence.
Key Drivers:
Bank-backed platforms benefit from brand credibility and ecosystem access.
Branch and RM-led engagement supports HNI, affluent and assisted-investing customers.
Institutional equities and research capabilities strengthen credibility with serious investors.
Strong customer service is important for retention in volatile markets.
Government Policy Support
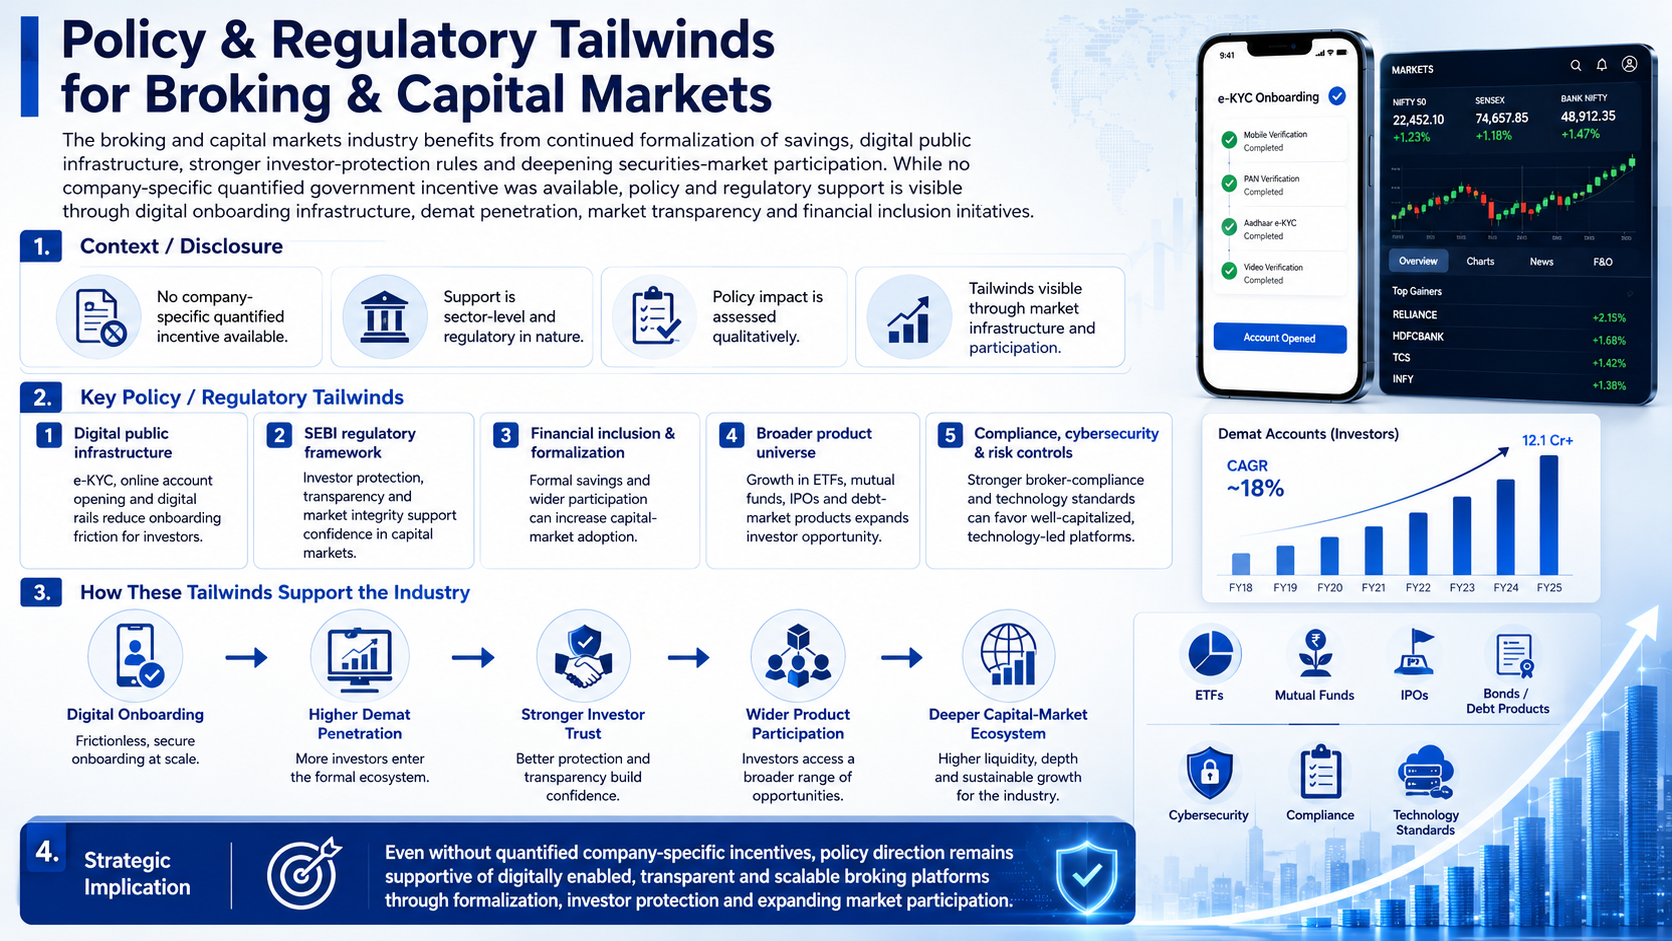
The broking and capital markets industry benefits from the continued formalization of savings, digital public infrastructure, stronger investor protection rules and deepening securities-market participation. While no company-specific quantified government incentive was available, policy and regulatory support is visible through digital onboarding infrastructure, demat penetration, market transparency and financial inclusion initiatives.
Digital public infrastructure, e-KYC and online account opening reduce onboarding friction for investors.
SEBI’s regulatory framework supports investor protection, transparency and market integrity.
Financial inclusion and formalization can increase participation in capital-market products.
Growth in ETFs, mutual funds, IPOs and debt-market products expands the product universe available to investors.
Stronger cybersecurity, risk-management and broker-compliance requirements can favor well-capitalized and technology-led platforms.
- Overview
- Business
- Financial Highlights
- Industry Overview
- Documentation
Get the Preqt App and keep in touch around the clock!
 Monitor your investments in real-time.
- Receive tailored deal suggestions.
- Get real-time updates and alerts.
