

Hella Infra Market
Building India smarterPowering construction growth
IPO Review and Rating
Risky
Overall Recommendation
Revenue increased from INR 11,846.6 Cr in FY23 to INR 18,471.9 Cr in FY25, representing a 24.9% 2-year CAGR, while FY25 EBITDA grew 27.7% to INR 1,556.4 Cr. However, EBITDA margin remained modest at 8.4%, PAT declined 41.9% to INR 219.7 Cr, PAT margin stood at only 1.2%, D/E remained relatively high at 0.96x, and ROE fell to approximately 4.5%, although CFO remained positive at INR 516.3 Cr. The Indian building-materials market is projected to grow at 9.6% CAGR, but remains highly fragmented with approximately 14,000 players
PARAMETER
WEIGHT
SCORE
KEY FACTORS
Financial Performance
25.0%
2.8/5
Revenue recorded a 24.9% 2-year CAGR
Show more
Detailed Analysis
Revenue increased from INR 11,846.6 Cr in FY23 to INR 14,530.2 Cr in FY24 and INR 18,471.9 Cr in FY25, representing a 24.9% FY23-FY25 2-year CAGR; FY25 revenue grew 27.1% YoY
Mechanical EBITDA increased from approximately INR 1,219.0 Cr in FY24 to INR 1,556.4 Cr in FY25, +27.7% YoY; EBITDA margin remained broadly flat at 8.4% in FY25 vs 8.4% in FY24
Consolidated PAT declined from INR 378.0 Cr in FY24 to INR 219.7 Cr in FY25, -41.9% YoY; FY25 PAT margin stood at only 1.2%
FY25 financial borrowings stood at approximately INR 6,056.1 Cr against total equity of INR 6,297.1 Cr, resulting in conventional D/E of 0.96x; including lease liabilities, leverage is approximately 1.04x
FY25 PAT of INR 219.7 Cr against average FY24-FY25 consolidated equity of approximately INR 4,847.7 Cr resulted in estimated ROE of 4.5%
Industry
25.0%
2.1/5
India's building-materials market is projected to grow at 9.6% CAGR to USD 166 Bn by FY30
Show more
Detailed Analysis
India's building-materials market is projected to increase from approximately USD 105 Bn in FY25 to USD 166 Bn by FY30, representing a 9.6% CAGR
The Indian construction-materials market has approximately 14,000 players and remains highly fragmented across regional manufacturers and distributors
The Group has overseas subsidiaries in Singapore and Dubai, and its disclosures explicitly classify sales to customers outside India; international exposure exists but remains secondary to the Indian business
Management
25.0%
3.0/5
Founder experience stands at approximately 10 years
Show more
Detailed Analysis
Hella Infra Market was founded in 2016 by Aaditya Sharda and Souvik Sengupta, giving the founders approximately 10 years of operating experience with the platform
Public corporate records show 8 directors around the relevant period, including founders, investor nominee directors and other non-executive directors
FY25 recurring RPTs were primarily approximately INR 4.0 Cr of KMP remuneration, equivalent to only about 0.02% of FY25 revenue
Valuation Metrics
25.0%
2.2/5
The Company is valued at 43.2x P/E
Show more
Detailed Analysis
The Company is valued at 43.2x P/E against the stated industry P/E of 15.0x, representing a 188.0% premium
Estimated FY25 enterprise value is approximately INR 18,115.7 Cr against FY25 EBITDA of INR 1,556.4 Cr, giving 11.6x EV/EBITDA. Current selected peer median is approximately 22.7x, implying a 48.7% discount
The P/B is valued at 7.3x but audited consolidated owner equity implies a much lower 2.3x P/B
TOTAL
100%
2.5/5
Weighted Composite Score
Per Share Price
₹115000.0
As of 14 Oct 2026
Lot Size
50.0 Shares
Minimum Investment
₹57,50,000.0 / 50 shares
Market Cap. (₹ Cr)
Revenue FY’25
PAT FY’25
P/E Multiple
Face Value
₹ 10.0Lot Size
50.0 sharesPAT FY’25
₹ 219.7 CrPAT Margin (%)
1.2 %P/E Multiple
43.2xCAGR Growth 2Y
24.9 %ROE (FY’25)
4.5 %ROCE (FY’25)
11.3 %Price to Book Value ratio
8.0xDebt/Equity (FY’25)
1.0xMerchant banker appointed
❌ NoCompany Website
infra.marketDisclaimer: Unlisted shares are unregulated & illiquid. This is NOT investment advice. Please do your own due diligence before investing.
Minimum Investment
₹57,50,000.0 / 50 sharesShares Lot 50 X 1
Investment amount
₹57,50,000.0
Overview
Business
Products
Business Model
Geographical Presence
Sales Channel
Financial Highlights
Income Statement
Revenue growth with EBITDA and PAT margins
| Financial Metric | FY 2023 | FY 2024 | FY 2025 |
|---|---|---|---|
| Revenue (₹ Cr) | 11,846.5 | 14,830.2 | 18,471.9 |
| Growth (%) | 0.0% | 22.7% | 27.1% |
| EBITDA (₹ Cr) | 790.9 | 1,219.0 | 1,556.6 |
| EBITDA Margin (%) | 6.7% | 8.4% | 8.4% |
| PAT (₹ Cr) | 155.3 | 378.0 | 219.7 |
| PAT Margin (%) | 1.3% | 2.6% | 1.2% |
OBSERVATIONS & INSIGHTS
Revenue from operations increased from INR 11,846.5 Cr in FY23 to INR 14,530.2 Cr in FY24 and INR 18,471.9 Cr in FY25
Growth accelerated from 22.7% in FY24 to 27.1% in FY25, resulting in a two-year revenue CAGR of approximately 24.9%
EBITDA increased from approximately INR 790.9 Cr in FY23 to INR 1,219.0 Cr in FY24 and INR 1,556.6 Cr in FY25
EBITDA margin improved from 6.7% in FY23 to 8.4% in FY24 and remained broadly stable at 8.4% in FY25, indicating that scale has not yet translated into further margin expansion
PAT improved sharply to INR 378.0 Cr in FY24 from INR 155.3 Cr in FY23, but fell to INR 219.7 Cr in FY25 despite strong revenue growth
PAT margin consequently compressed from 2.6% in FY24 to 1.2% in FY25
The divergence between revenue growth and PAT in FY25 reflects higher finance cost, depreciation / amortisation and operating-cost intensity
Balance Sheet
| Financial Metric | FY 2023 | FY 2024 | FY 2025 |
|---|---|---|---|
| EQUITY & LIABILITIES | ₹ 7,285.6 Cr | ₹ 10,741.7 Cr | ₹ 16,540.2 Cr |
| Net Worth | ₹ 2,522.1 Cr | ₹ 3,398.3 Cr | ₹ 6,297.2 Cr |
| Share Capital | ₹ 0.4 Cr | ₹ 0.4 Cr | ₹ 0.4 Cr |
| Reserves & Surplus | ₹ 2,521.7 Cr | ₹ 3,397.9 Cr | ₹ 6,296.8 Cr |
| Total Liabilities | ₹ 4,763.5 Cr | ₹ 7,343.4 Cr | ₹ 10,243.0 Cr |
| Current Liabilities | ₹ 4,102.8 Cr | ₹ 5,460.4 Cr | ₹ 8,060.2 Cr |
| Borrowings | ₹ 2,108.9 Cr | ₹ 2,499.9 Cr | ₹ 4,388.6 Cr |
| Trade Payables | ₹ 1,700.6 Cr | ₹ 2,521.1 Cr | ₹ 2,779.3 Cr |
| Other Current Liabilities | ₹ 293.3 Cr | ₹ 439.4 Cr | ₹ 892.3 Cr |
| Non-Current Liabilities | ₹ 660.7 Cr | ₹ 1,883.0 Cr | ₹ 2,182.8 Cr |
| Borrowings | ₹ 534.7 Cr | ₹ 1,459.8 Cr | ₹ 1,667.5 Cr |
| Other Non-Current Liabilities | ₹ 126.0 Cr | ₹ 423.2 Cr | ₹ 515.3 Cr |
| ASSETS | ₹ 7,285.5 Cr | ₹ 10,741.6 Cr | ₹ 16,540.0 Cr |
| Current Assets | ₹ 5,358.0 Cr | ₹ 7,088.1 Cr | ₹ 9,473.1 Cr |
| Trade Receivables | ₹ 3,922.1 Cr | ₹ 5,239.4 Cr | ₹ 6,244.7 Cr |
| Inventory | ₹ 263.2 Cr | ₹ 489.6 Cr | ₹ 958.4 Cr |
| Cash & Cash Equivalents | ₹ 249.4 Cr | ₹ 326.9 Cr | ₹ 740.5 Cr |
| Other Current Assets | ₹ 923.3 Cr | ₹ 1,032.2 Cr | ₹ 1,529.5 Cr |
| Non-Current Assets | ₹ 1,927.5 Cr | ₹ 3,653.5 Cr | ₹ 7,066.9 Cr |
| Fixed Assets | ₹ 942.9 Cr | ₹ 2,323.2 Cr | ₹ 4,652.4 Cr |
| Other Non-Current Assets | ₹ 984.6 Cr | ₹ 1,330.3 Cr | ₹ 2,414.5 Cr |
OBSERVATIONS & INSIGHTS
Total assets expanded from approximately INR 7,285.5 Cr in FY23 to INR 10,741.7 Cr in FY24 and INR 16,540.1 Cr in FY25. The rapid expansion reflects acquisitions, manufacturing capacity, goodwill / intangibles and a larger working-capital base
Net worth increased from approximately INR 2,522.0 Cr in FY23 to INR 3,398.3 Cr in FY24 and INR 6,297.1 Cr in FY25. The stronger equity base has helped keep Debt / Equity around 1x despite significant absolute borrowing growth
Total borrowings increased from approximately INR 2,643.6 Cr in FY23 to INR 3,959.7 Cr in FY24 and INR 6,056.3 Cr in FY25. This funding growth has supported expansion, but also contributed to finance cost rising to about INR 804.8 Cr in FY25
Current assets rose materially to approximately INR 9,473.2 Cr in FY25, driven particularly by trade receivables of INR 6,244.7 Cr and inventories of INR 958.4 Cr. Receivables alone represent a substantial portion of the operating asset base and remain the most important balance-sheet monitorable
Cash Flow
| Financial Metric | FY 2024 | FY 2025 |
|---|---|---|
CFO (₹ Cr) Cash generated from core business operations. | +444.4 Cr | +516.3 Cr |
CFI (₹ Cr) Cash used for investments and long-term assets. | -935.0 Cr | -1,820.6 Cr |
CFF (₹ Cr) Cash flow related to funding and borrowings. | +445.9 Cr | +1,743.8 Cr |
Working Capital
| Efficiency Metric | FY 2023 | FY 2024 | FY 2025 |
|---|---|---|---|
Debtor Days Average number of days taken to collect customer payments. | - | - | - |
Creditor Days Average time taken to pay suppliers and vendors. | - | - | - |
Inventory Days Average number of days inventory remains unsold. | - | - | - |
CCC (Cash Conversion Cycle) (Debtor Days + Inventory Days - Creditor Days) | - | - | - |
Financial Ratios
Measures the company’s leverage relative to shareholder equity.
OBSERVATIONS & INSIGHTS
ROE improved from approximately 6.6% in FY23 to 12.8% in FY24 before declining sharply to 4.5% in FY25. The FY25 decline reflects lower PAT alongside a materially larger equity base following capital additions and consolidation changes
Debt / Equity remained around 1x across the period, moving from 1.05x in FY23 to 1.17x in FY24 and improving to 0.96x in FY25. The leverage level is manageable on headline equity, but absolute borrowings increased substantially as the business scaled
Interest Coverage weakened from approximately 1.81x in FY23-FY24 to 1.38x in FY25. This is an important monitorable because finance cost of about INR 804.8 Cr in FY25 consumed a significant portion of operating earnings
The Current Ratio remained close to 1.3x in FY23-FY24 but declined to approximately 1.17x in FY25, indicating a tighter short-term liquidity cushion as borrowings and other current liabilities increased with the expansion in working capital
Industry Overview
Industry Drivers
Sustained Infrastructure and Construction Activity
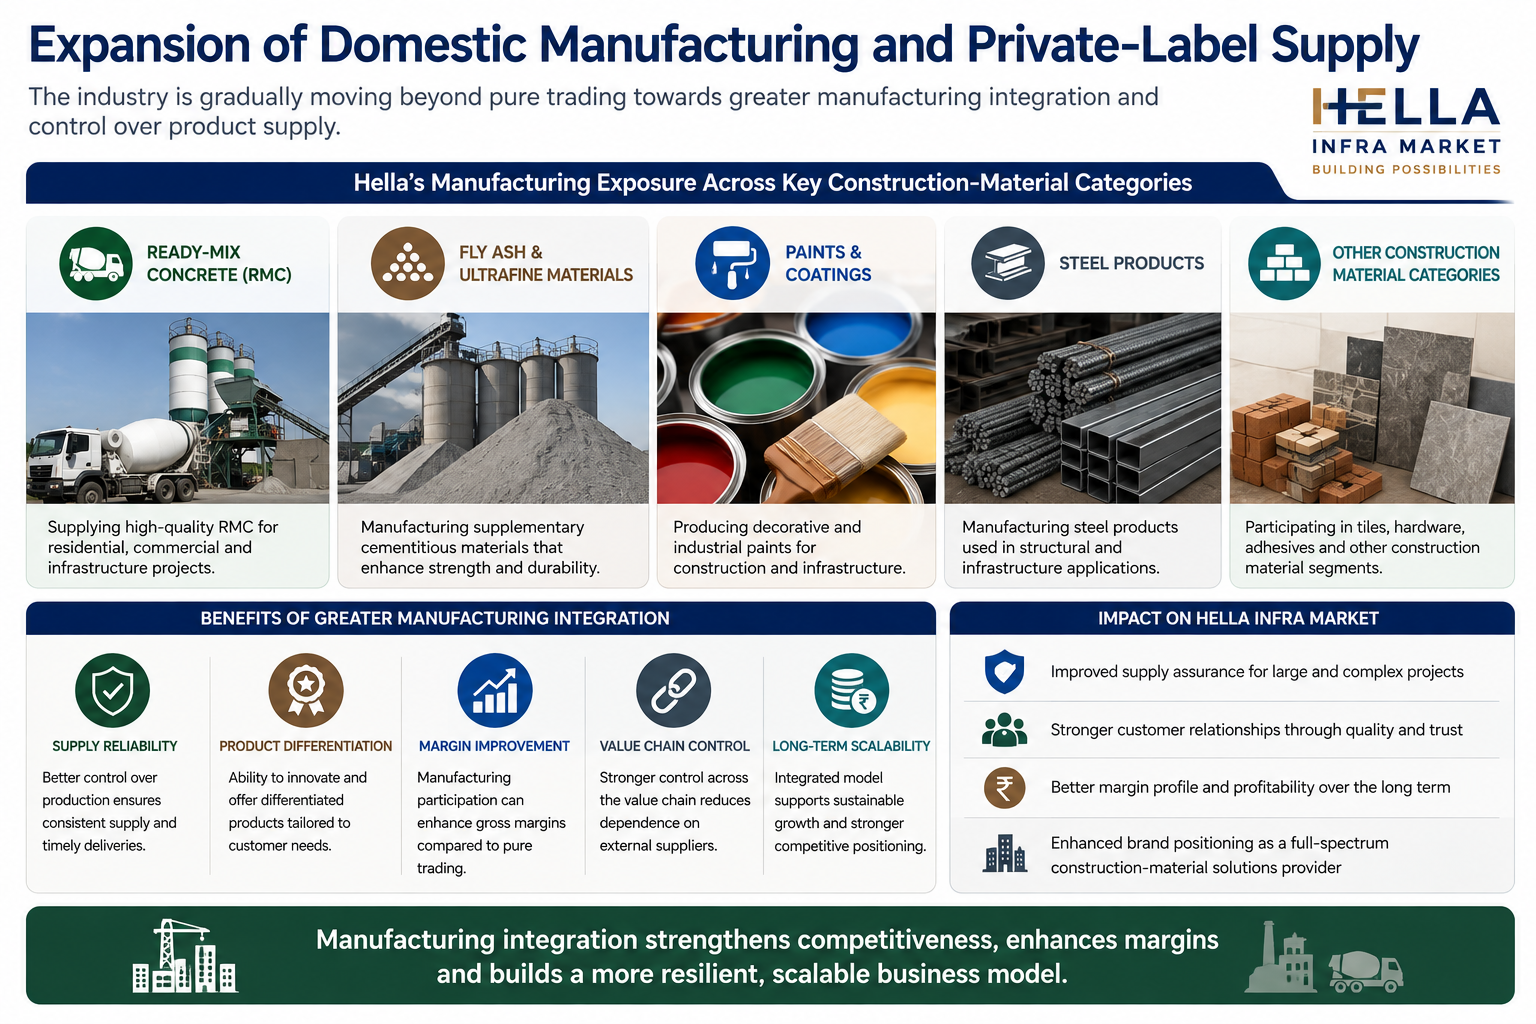
Demand for construction materials is structurally linked to activity across residential housing, commercial real estate, industrial projects, integrated townships and large infrastructure projects
Hella Infra Market participates across these end-markets through the supply and distribution of construction materials as well as infrastructure-support services, making continued construction activity a key underlying demand driver
Shift Towards Organised and Integrated Procurement
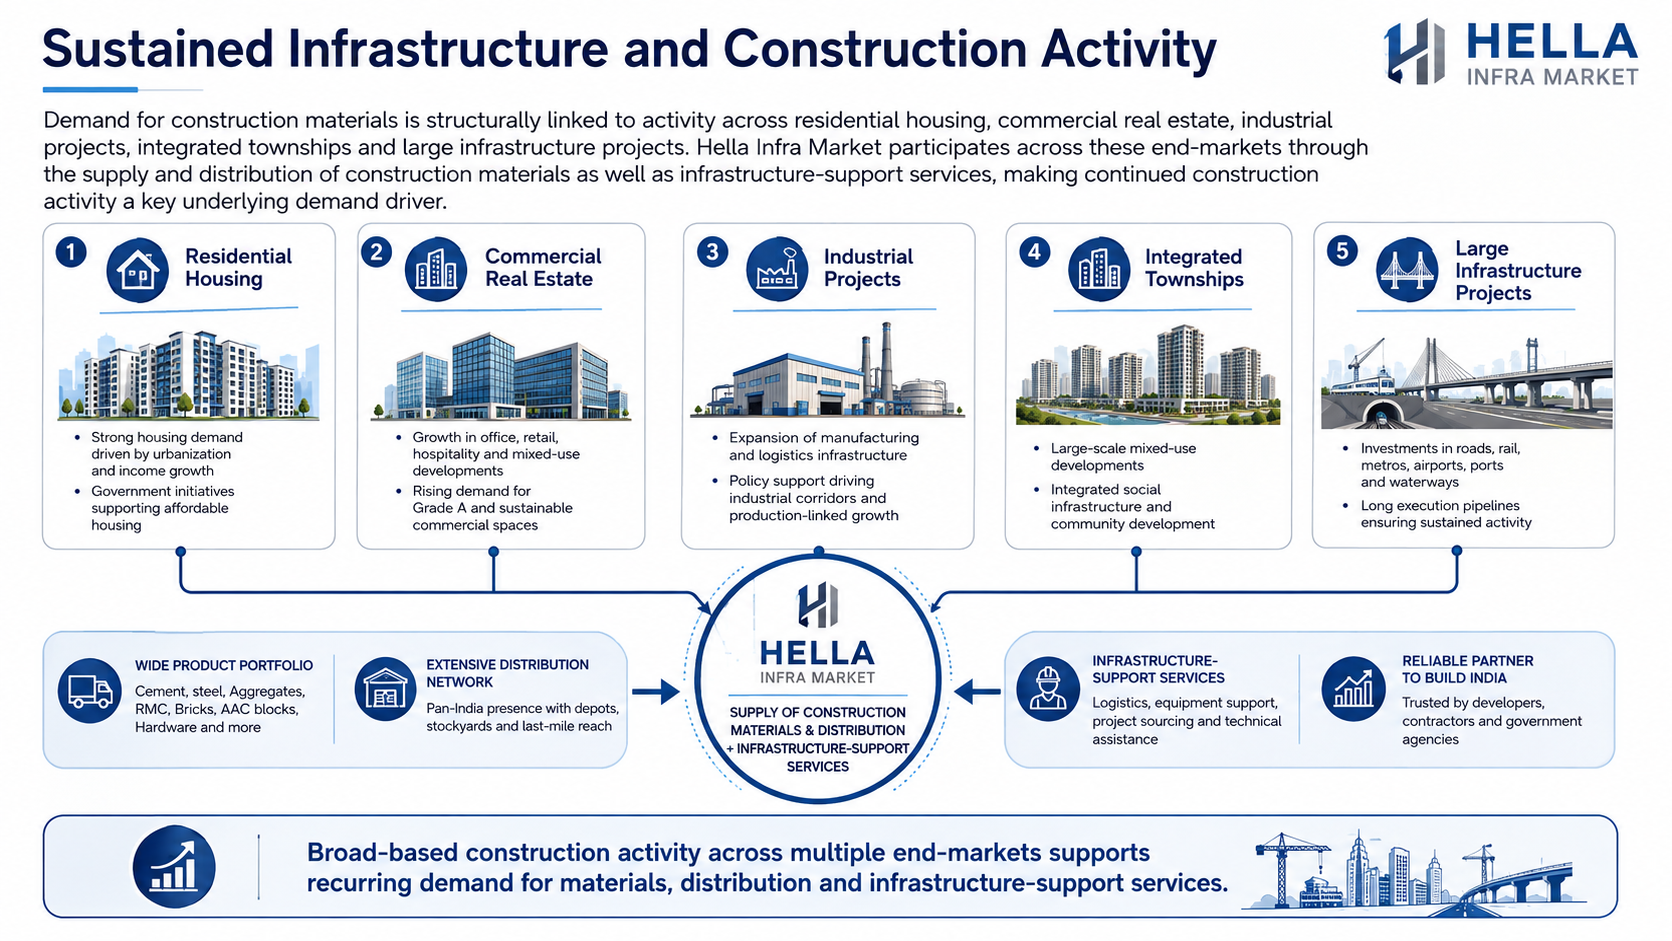
The construction-materials market traditionally involves a fragmented network of manufacturers, distributors and dealers across multiple product categories
Large contractors and developers increasingly benefit from dealing with scaled suppliers capable of providing multiple materials through a single procurement relationship, improving sourcing efficiency, product availability and execution visibility
Hella’s presence across trading, contract manufacturing and manufacturing positions it to benefit from this shift
Expansion of Domestic Manufacturing and Private-Label Supply
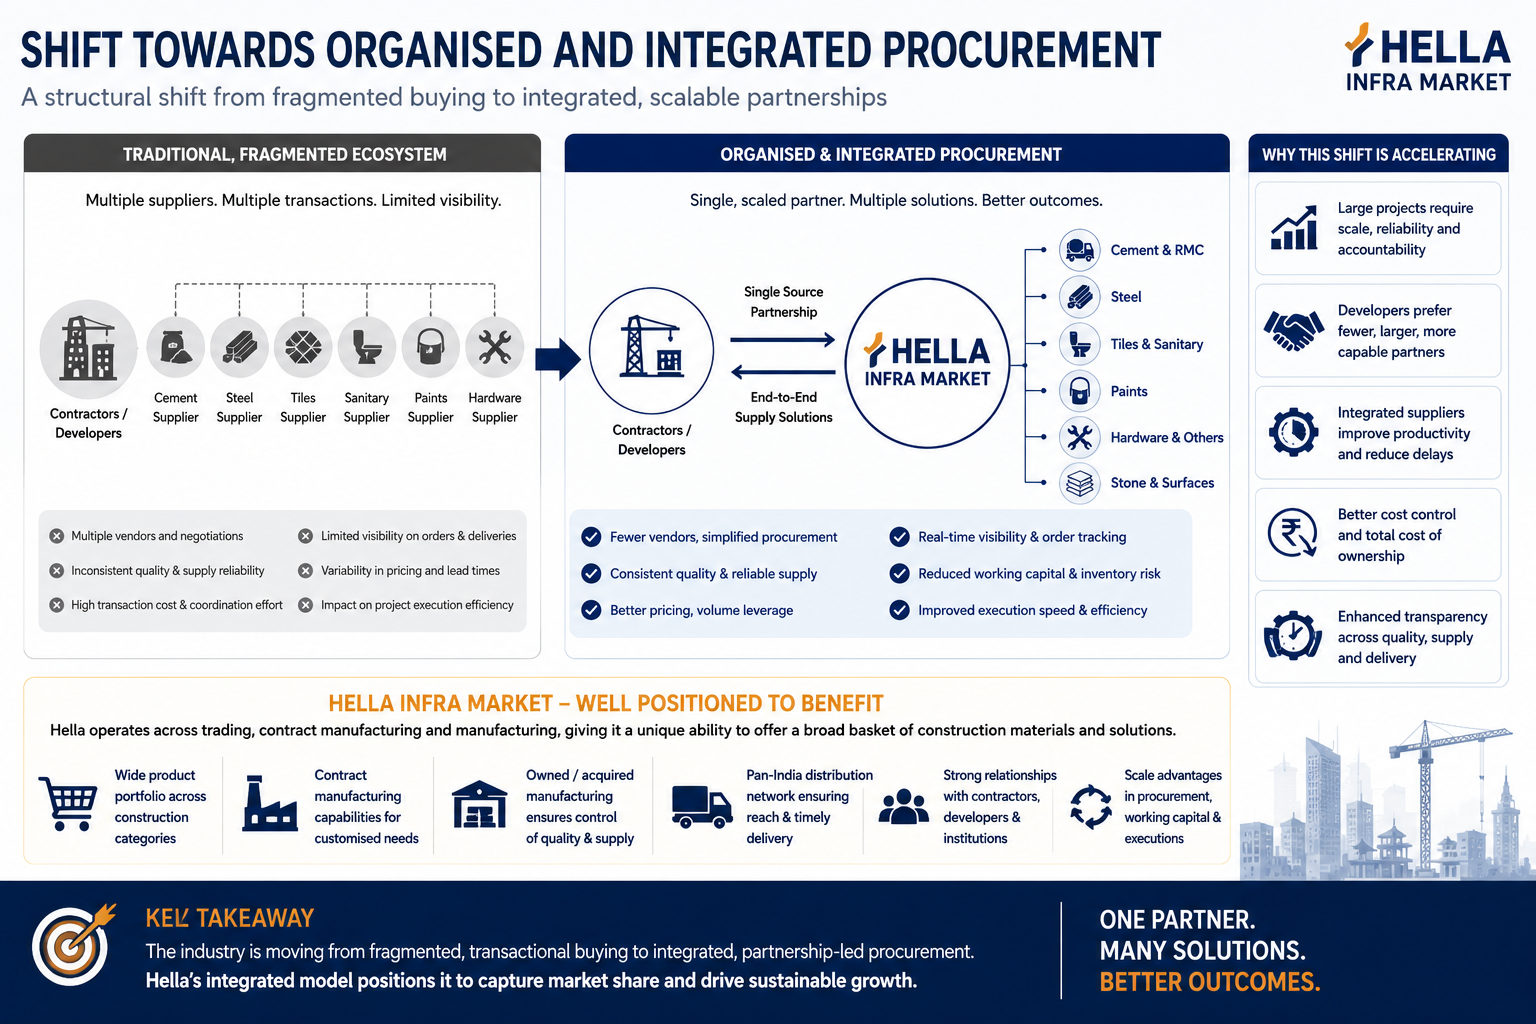
The industry is gradually moving beyond pure trading towards greater manufacturing integration and control over product supply
Hella’s manufacturing exposure spans ready-mix concrete, fly ash and ultrafine materials, paints and coatings, steel products and other construction-material categories
Greater manufacturing participation can improve supply reliability, product differentiation and potentially gross margins compared with a pure distribution model
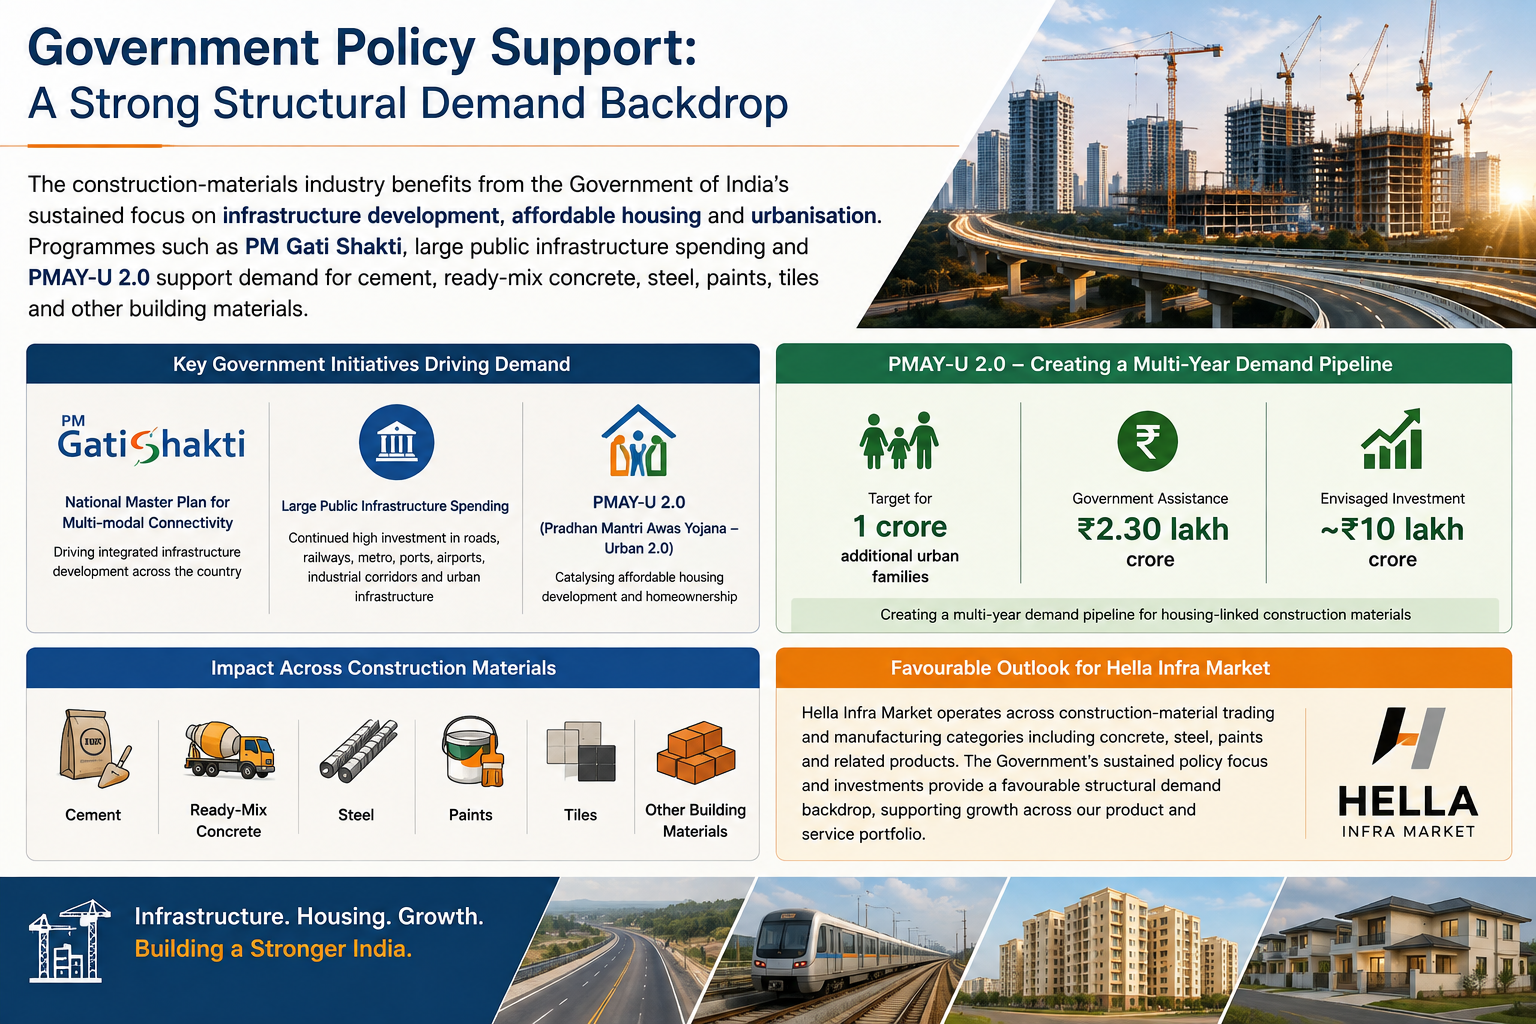
Government Policy Support
The construction-materials industry benefits from the Government of India’s sustained focus on infrastructure development, affordable housing and urbanisation
Programmes such as PM Gati Shakti, large public infrastructure spending and PMAY-U 2.0 support demand for cement, ready-mix concrete, steel, paints, tiles and other building materials
PMAY-U 2.0 alone targets support for 1 crore additional urban families, with government assistance of ₹2.30 lakh crore and envisaged investment of about ₹10 lakh crore, creating a multi-year demand pipeline for housing-linked construction materials
For Hella Infra Market, which operates across construction-material trading and manufacturing categories including concrete, steel, paints and related products, these policy-led investments provide a favourable structural demand backdrop
- Overview
- Business
- Financial Highlights
- Industry Overview
- Documentation
Get the Preqt App and keep in touch around the clock!
 Monitor your investments in real-time.
- Receive tailored deal suggestions.
- Get real-time updates and alerts.
