


Hero Fincorp Ltd.
Financing Everyday AspirationsSimple and Reliable Credit
Unlisted Review and Rating
Speculative
DRHP ApprovedOverall Recommendation
Hero FinCorp possesses a valuable Hero franchise, diversified lending platform, improving NPAs, strong board composition and credible AA+ funding access. However, FY26 parent AUM was almost flat, credit costs remained near 5%, NIM compressed, capital headroom was modest and adjusted ROA/ROE remained extremely weak. Even after removing the CCPS accounting charge, valuation is roughly 40× adjusted earnings, with future CCPS dilution and unlisted liquidity risk still unresolved.
PARAMETER
WEIGHT
SCORE
KEY FACTORS
Financial Performance
25.0%
2.0/5
Improving NPAs are outweighed by flat AUM, high credit costs, compressed margins, weak returns and limited capital headroom
Show more
Detailed Analysis
Parent AUM increased from ₹46,488 crore in FY24 to INR 51,248 crore in FY26, only about 5.0% CAGR, and grew just 1% in FY26. Consolidated FY26 AUM was INR 58,663 crore
Consolidated net-interest-income proxy was approximately INR 4,489 crore, or 8.3% of average loans, but compressed from roughly 9.2% in FY25
FY26 impairment expense remained exceptionally high at INR 2,521.86 crore, approximately 4.7% of average consolidated loans
Reported returns were negative, even after the CCPS adjustment, disclosed parent ROA was only 0.5% and ROE 2.6%
Industry
25.0%
3.0/5
Structural credit demand and healthy sector conditions are tempered by intense competition, funding sensitivity and stringent regulation
Show more
Detailed Analysis
CRISIL expects Indian NBFC AUM to grow approximately 18–19%, supported by retail, vehicle and MSME credit demand
Capital, provisioning, unsecured lending, governance, liquidity and customer practices remain extensively regulated by RBI
RBI describes the NBFC sector as financially sound, with strong capitalisation and improving asset quality
Management
25.0%
4.5/5
Experienced promoters and strong board independence support governance, while related-party lending and ordinary-course contingencies warrant monitoring
Show more
Detailed Analysis
Hero FinCorp has operated since 1991 and benefits from the Hero Group’s brand, distribution reach and vehicle ecosystem
Five of ten directors were independent, including two independent women directors, producing strong 50% independence
Disclosed operating RPTs, related-party loans and remuneration remained below approximately 4% of revenue, although ₹180 crore of new related-party loans requires monitoring
Valuation Metrics
25.0%
2.0/5
Valuation remains demanding at 2.2× book and approximately 41.6× adjusted earnings despite the moderate 0.2× market-cap-to-AUM ratio.
Show more
Detailed Analysis
Reported P/E is unusable, the optimistic CCPS-adjusted P/E is still approximately 41.6×, above several profitable listed NBFC peers
Supplied P/B is approximately 2.2× despite only 2.6–3.5% adjusted ROE, making the book multiple demanding relative to returns
Market capitalisation equals approximately 0.2× consolidated AUM, which appears moderate but reflects weak profitability and high credit costs
TOTAL
100%
2.9/5
Weighted Composite Score
Per Share Price
₹999.0
As of 14 Oct 2026
Lot Size
50.0 Shares
Minimum Investment
₹49,950.0 / 50 shares
Market Cap. (₹ Cr)
Revenue FY’26
PAT FY’26
P/E Multiple
Face Value
₹ 10.0Lot Size
50.0 sharesSale Type
Secondary SalePAT FY’26
₹ -226.0 CrPAT Margin (%)
-2.4 %P/E Multiple
-87.0xCAGR Growth 3Y
7.5 %ROE (FY’26)
-3.8 %ROCE (FY’26)
59.9 %Price to Book Value ratio
2.2xMerchant banker appointed
✅ YesCompany Website
www.herofincorp.comDisclaimer: Unlisted shares are unregulated & illiquid. This is NOT investment advice. Please do your own due diligence before investing.
Minimum Investment
₹49,950.0 / 50 sharesShares Lot 50 X 1
Investment amount
₹49,950.0
Overview
Business
Business Model
Geographical Presence
Sales Channel
Key Risk Factor
Financial Highlights
Income Statement
Revenue growth with EBITDA and PAT margins
| Financial Metric | FY 2024 | FY 2025 | FY 2026 |
|---|---|---|---|
| Revenue (₹ Cr) | 8,290.9 | 9,832.7 | 9,583.3 |
| Growth (%) | 29.5% | 18.6% | -2.5% |
| EBITDA (₹ Cr) | 4,123.9 | 4,179.8 | 3,766.1 |
| EBITDA Margin (%) | 49.7% | 42.5% | 39.3% |
| PAT (₹ Cr) | 637.1 | 110.0 | -226.0 |
| PAT Margin (%) | 7.7% | 1.1% | -2.4% |
OBSERVATIONS & INSIGHTS
Revenue from operations increased 18.6% in FY25 but declined 2.5% in FY26 as interest income and other charges softened during the shift toward a more secured portfolio
The two-year revenue CAGR was 7.5%, but FY26 growth was nearly flat because consolidated loans increased only 0.9% to ₹54,322.7 Cr
Reported PAT deteriorated from ₹637.1 Cr in FY24 to ₹110.0 Cr in FY25 and ₹(226.0) Cr in FY26, with both credit costs and CCPS fair-value movements affecting the trajectory
The consolidated auditors issued an unmodified opinion, but identified ECL, IT general controls and Level 3 CCPS valuation as key audit matters because each involves material judgement or systems dependence
Balance Sheet
| Financial Metric | FY 2024 | FY 2025 | FY 2026 |
|---|---|---|---|
| EQUITY & LIABILITIES | ₹ 53,204.6 Cr | ₹ 60,042.5 Cr | ₹ 60,191.6 Cr |
| Net Worth | ₹ 5,772.0 Cr | ₹ 5,760.8 Cr | ₹ 5,910.4 Cr |
| Share Capital | ₹ 127.3 Cr | ₹ 127.4 Cr | ₹ 129.6 Cr |
| Reserves & Surplus | ₹ 5,644.7 Cr | ₹ 5,633.4 Cr | ₹ 5,780.8 Cr |
| Total Liabilities | ₹ 47,432.6 Cr | ₹ 54,281.7 Cr | ₹ 54,281.2 Cr |
| Current Liabilities | ₹ 20,414.1 Cr | ₹ 24,449.0 Cr | ₹ 23,378.1 Cr |
| Borrowings | ₹ 19,389.4 Cr | ₹ 23,317.6 Cr | ₹ 21,927.9 Cr |
| Trade Payables | ₹ 439.0 Cr | ₹ 532.2 Cr | ₹ 572.2 Cr |
| Other Current Liabilities | ₹ 585.7 Cr | ₹ 599.2 Cr | ₹ 878.0 Cr |
| Non-Current Liabilities | ₹ 27,018.5 Cr | ₹ 29,832.7 Cr | ₹ 30,903.1 Cr |
| Borrowings | ₹ 26,780.0 Cr | ₹ 29,637.0 Cr | ₹ 30,722.5 Cr |
| Other Non-Current Liabilities | ₹ 238.5 Cr | ₹ 195.7 Cr | ₹ 180.6 Cr |
| ASSETS | ₹ 53,204.8 Cr | ₹ 60,042.4 Cr | ₹ 60,191.6 Cr |
| Current Assets | ₹ 24,591.8 Cr | ₹ 28,162.8 Cr | ₹ 25,029.0 Cr |
| Trade Receivables | ₹ 10.1 Cr | ₹ 27.4 Cr | ₹ 42.2 Cr |
| Inventory | ₹ 0.0 Cr | ₹ 0.0 Cr | ₹ 0.0 Cr |
| Cash & Cash Equivalents | ₹ 98.8 Cr | ₹ 1,964.6 Cr | ₹ 416.0 Cr |
| Other Current Assets | ₹ 24,482.9 Cr | ₹ 26,170.8 Cr | ₹ 24,570.8 Cr |
| Non-Current Assets | ₹ 28,613.0 Cr | ₹ 31,879.6 Cr | ₹ 35,162.6 Cr |
| Fixed Assets | ₹ 327.2 Cr | ₹ 378.0 Cr | ₹ 401.5 Cr |
| Other Non-Current Assets | ₹ 28,285.8 Cr | ₹ 31,501.6 Cr | ₹ 34,761.1 Cr |
OBSERVATIONS & INSIGHTS
Total assets increased 12.9% in FY25 but only 0.2% in FY26, confirming the deliberate slowdown in balance-sheet expansion
Loans represented 90.3% of FY26 total assets, making underwriting, collections, collateral realisation and ECL assumptions the principal determinants of value
Investments increased 24.2% to ₹3,173.6 Cr in FY26 and partly compensated for the decline in cash balances
Subordinated liabilities rose 22.5% to ₹6,123.6 Cr, including ₹3,361.6 Cr of CCPS measured at fair value through profit or loss
Total reported equity increased only 2.6% to ₹5,910.4 Cr despite fresh equity proceeds, because reported losses and other movements absorbed much of the capital addition
Other financial assets nearly doubled to ₹1,055.5 Cr, largely reflecting higher derivative assets associated with the Group's funding and hedging structure
The concentration of funding in banks and financial institutions gives scale and cost advantages but leaves the franchise sensitive to lender appetite, ratings and refinancing conditions
Cash Flow
| Financial Metric | FY 2024 | FY 2025 | FY 2026 |
|---|---|---|---|
CFO (₹ Cr) Cash generated from core business operations. | -9,238.8 Cr | -3,913.7 Cr | +85.5 Cr |
CFI (₹ Cr) Cash used for investments and long-term assets. | -129.8 Cr | -593.2 Cr | -493.1 Cr |
CFF (₹ Cr) Cash flow related to funding and borrowings. | +8,717.3 Cr | +6,372.6 Cr | -1,140.9 Cr |
Financial Ratios
Measures the company’s leverage relative to shareholder equity.
OBSERVATIONS & INSIGHTS
Profitability weakened substantially across the period, with ROE declining from 11.0% in FY24 to 1.9% in FY25 and turning negative at 3.8% in FY26. ROA followed the same trend, falling from 1.2% to negative 0.4
Reported debt-to-equity increased from 8.0x in FY24 to 9.2x in FY25 before moderating to 8.9x in FY26. Leverage remains elevated, partly because ₹3,361.6 Cr of CCPS is classified as subordinated liabilities under Ind AS
ROCE declined consistently from 12.4% in FY24 to 11.5% in FY25 and 10.0% in FY26. The reduction indicates weakening returns from the Group’s capital base as earnings declined while total assets remained elevated
The current ratio remained above 1.0x throughout the period but declined from 1.2x in FY24 and FY25 to 1.1x in FY26. Short-term assets continued to cover short-term liabilities, although the available liquidity headroom narrowed
Industry Overview
Industry Drivers
Growth in Vehicle and Secured Retail Credit
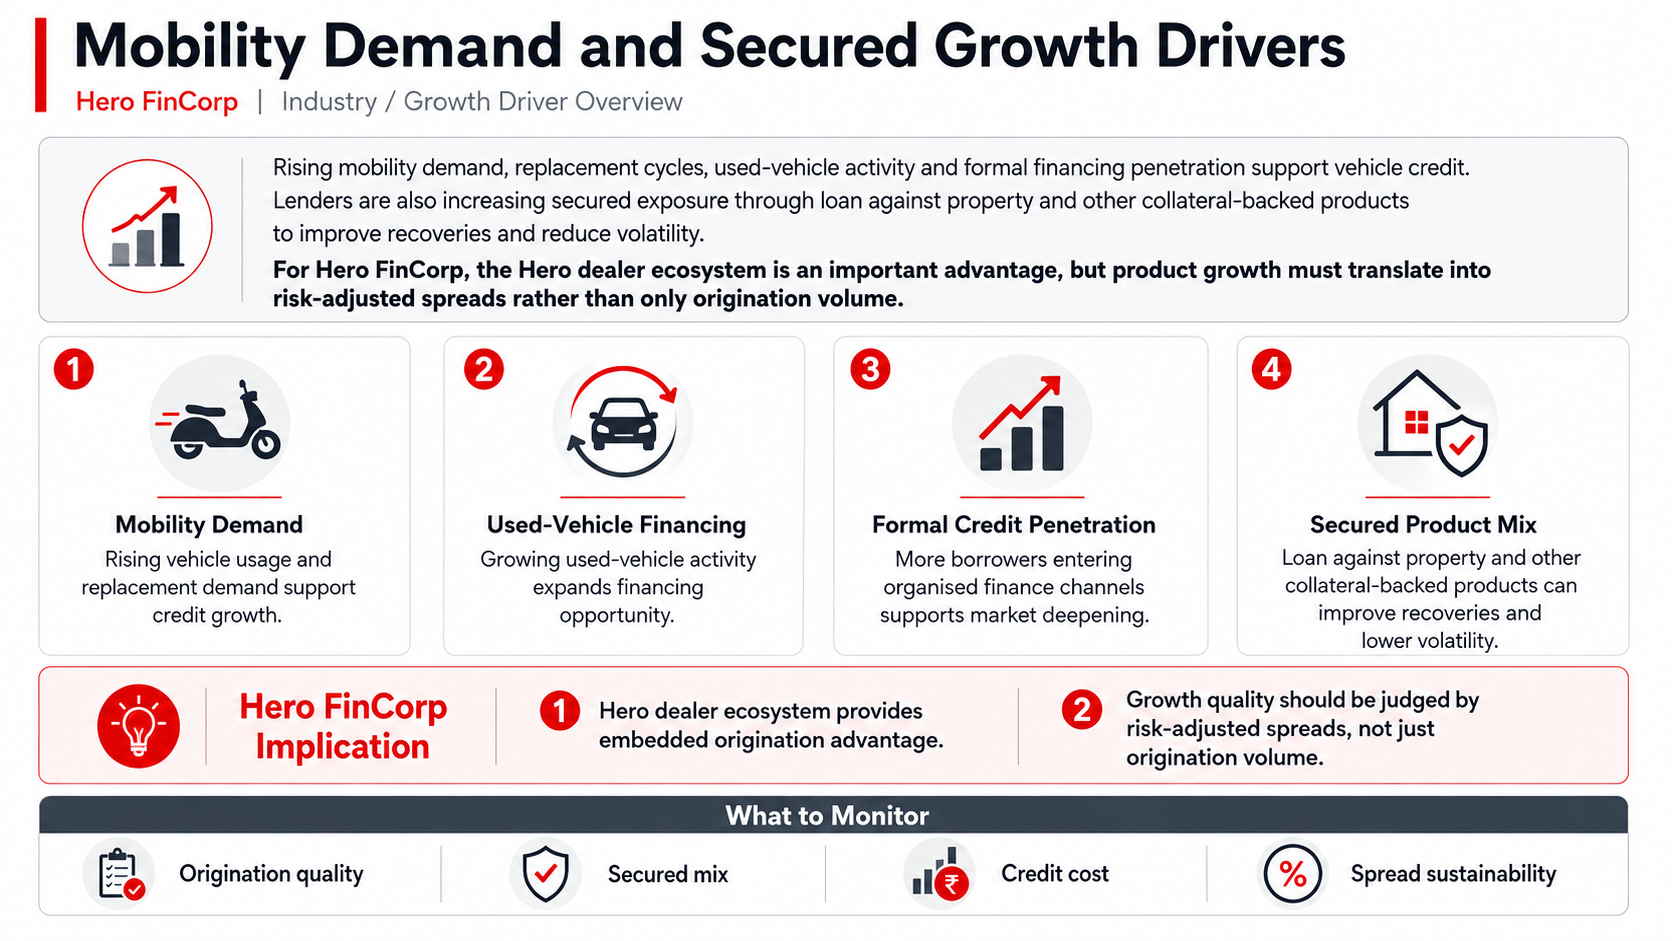
Rising mobility demand, replacement cycles, used-vehicle activity and formal financing penetration support vehicle credit. Lenders are also increasing secured exposure through loan against property and other collateral-backed products to improve recoveries and reduce volatility
For Hero FinCorp, the Hero dealer ecosystem is an important advantage, but product growth must translate into risk-adjusted spreads rather than only origination volume
MSME Formalisation and Credit Demand
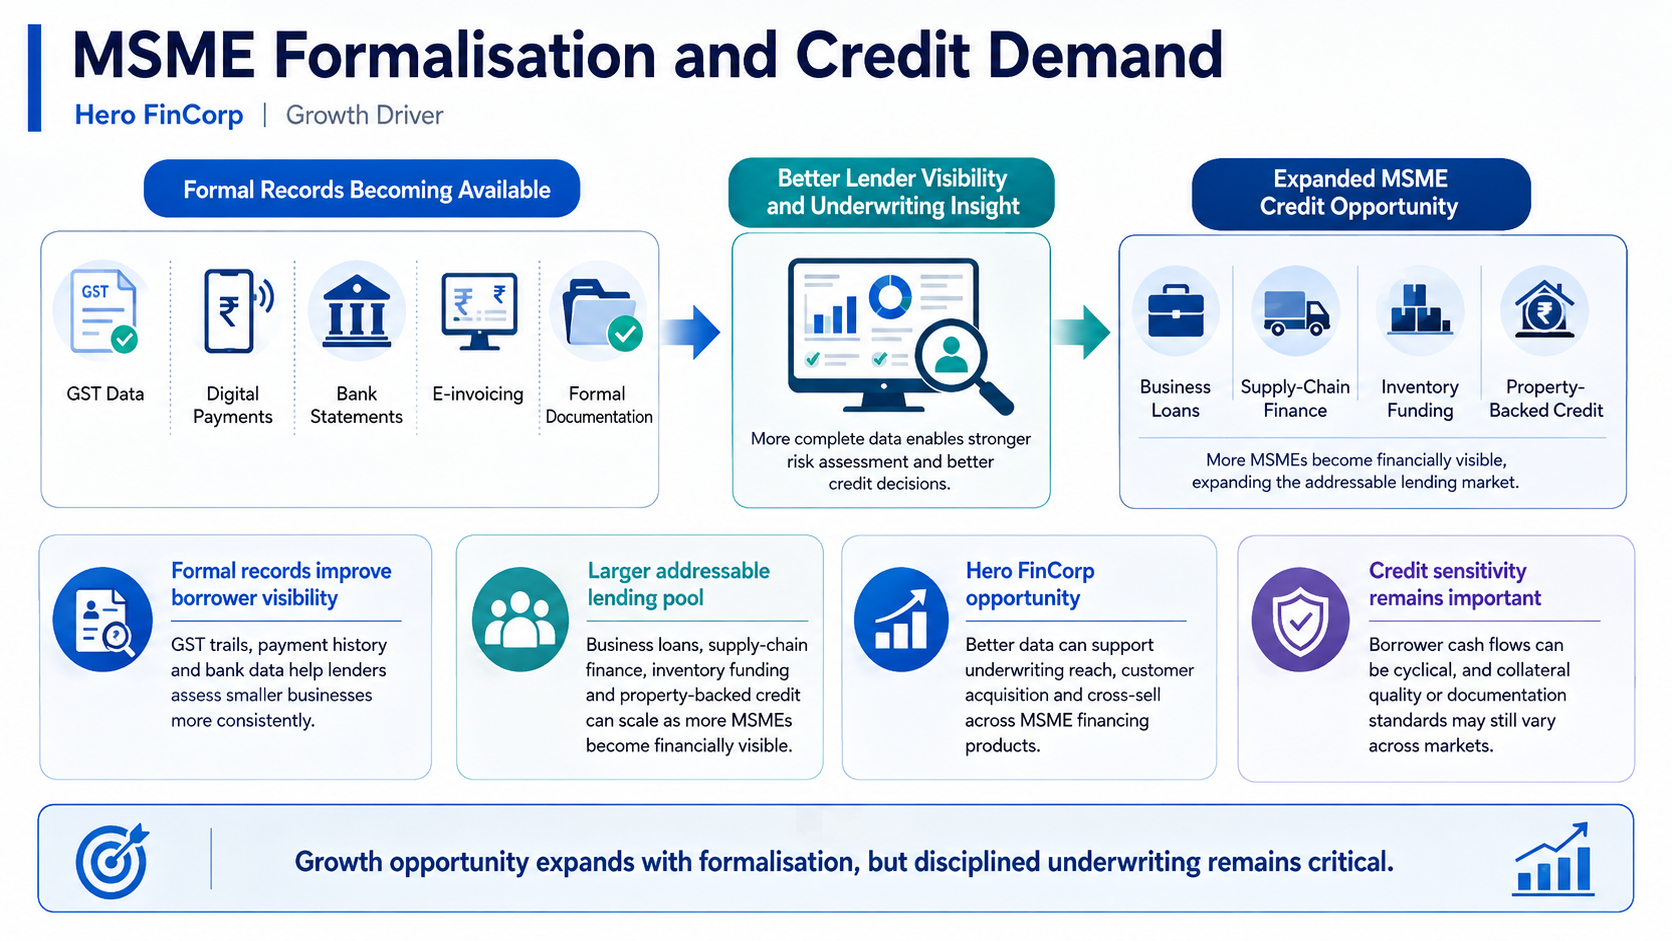
GST data, digital payments, bank statements, e-invoicing and other formal records are making smaller businesses more visible to lenders. This expands the addressable pool for business loans, supply-chain finance, inventory funding and property-backed credit
The opportunity remains credit-sensitive because borrower cash flows can be cyclical and collateral quality or documentation may vary across markets
Digital Underwriting and Artificial Intelligence
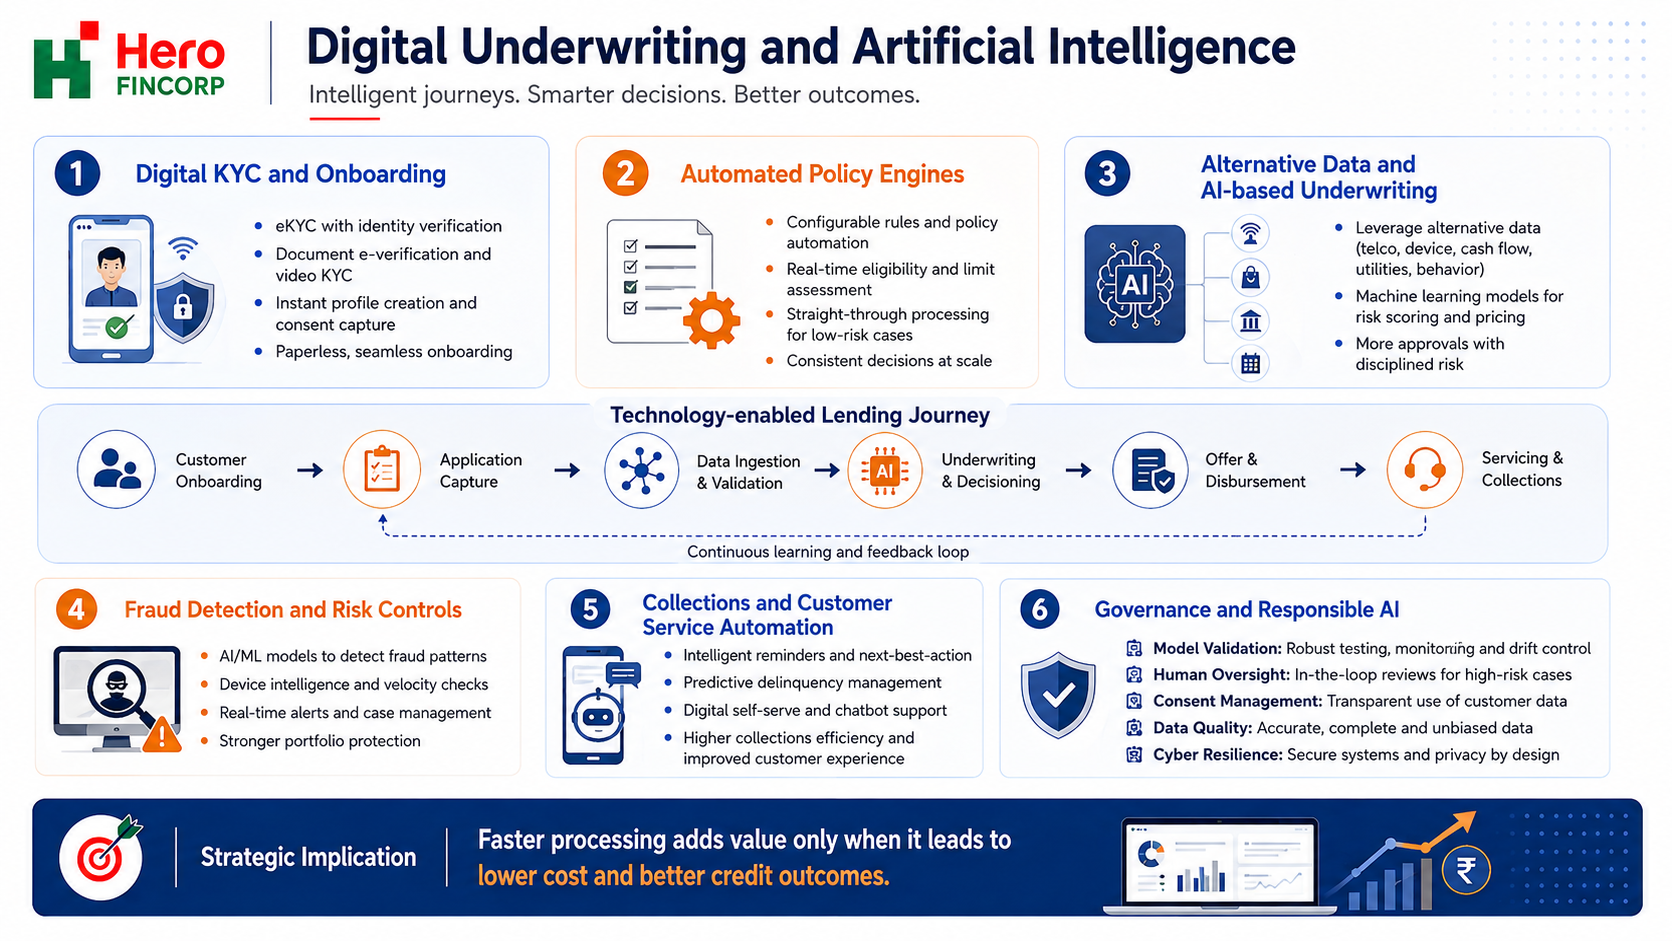
Digital KYC, automated policy engines, alternative data and AI can improve turnaround time, fraud detection, collections and customer service. Hero FinCorp is deploying agentic AI and digitised journeys across multiple products
The benefit depends on model validation, human oversight, data quality, consent management, cyber resilience and the ability to convert faster processing into lower cost and better credit outcomes
Government Policy Support
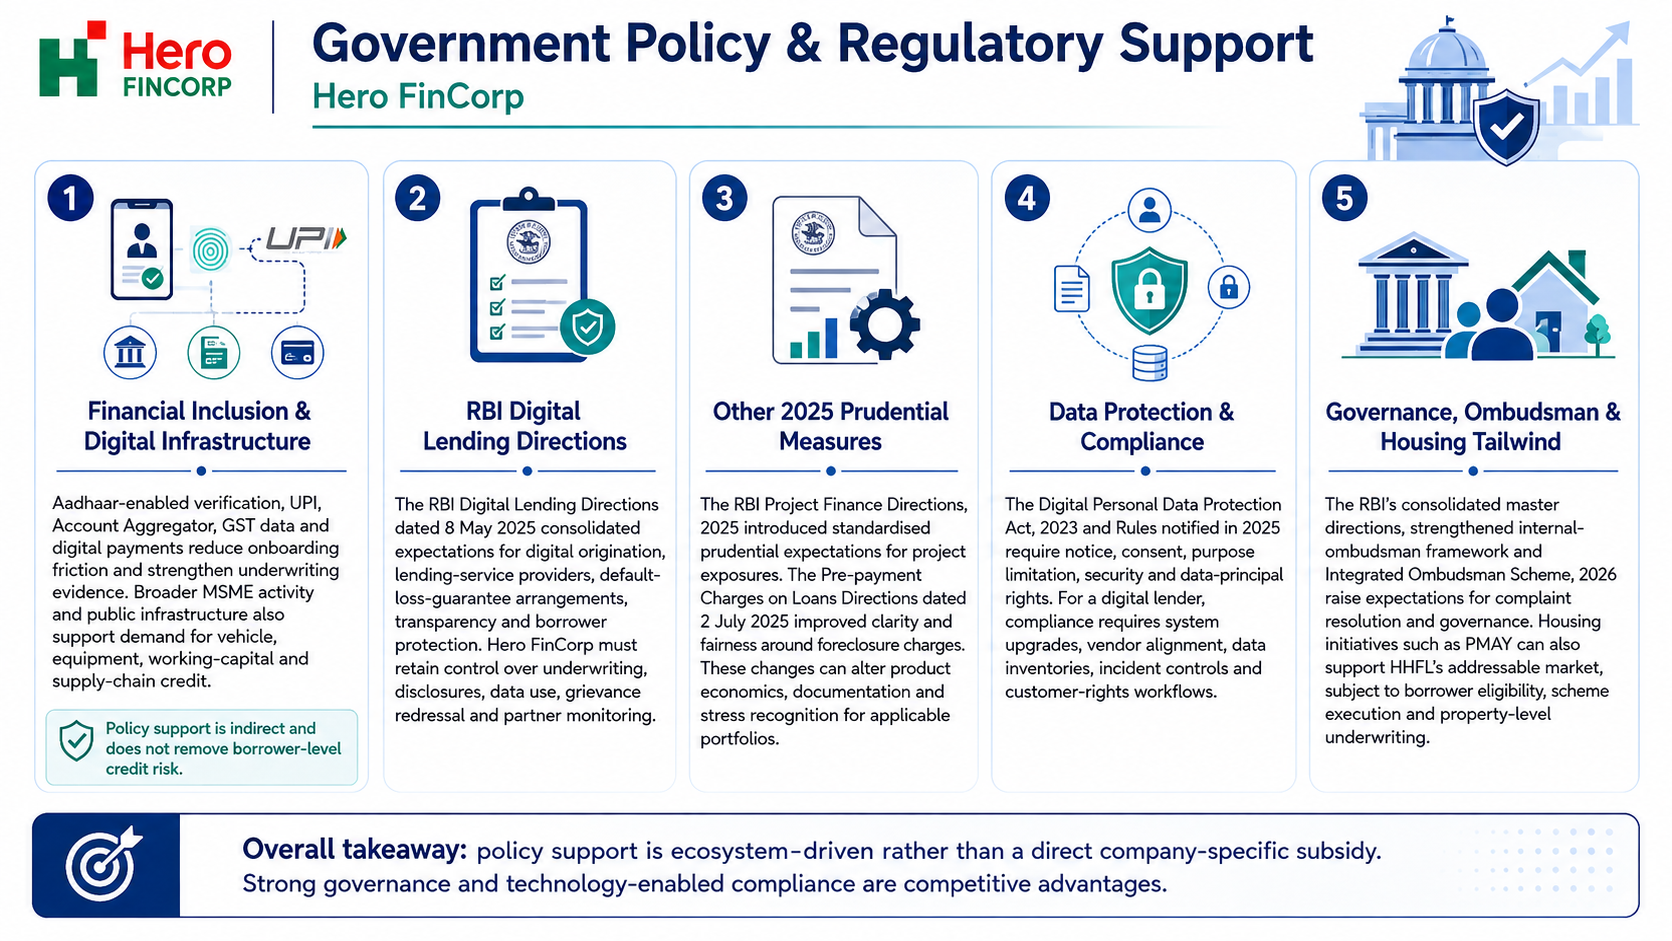
Financial inclusion, formalisation and digital public infrastructure provide indirect policy support to NBFC growth. Aadhaar-enabled verification, UPI, account aggregation, GST data and digital payments can reduce customer-acquisition friction and strengthen underwriting evidence. Public infrastructure and MSME activity also create vehicle, equipment, working-capital and supply-chain credit demand, although policy support does not eliminate borrower-level credit risk
The RBI's Digital Lending Directions dated 8 May 2025 consolidated expectations for digital origination, lending-service providers, default-loss-guarantee arrangements, transparency and borrower protection. These directions can improve trust and discipline across fintech partnerships, but they require regulated entities such as Hero FinCorp to retain control over underwriting, customer disclosures, data use, grievance redressal and partner monitoring
The RBI's Project Finance Directions, 2025 introduced standardised prudential expectations for project exposures, while the Pre-payment Charges on Loans Directions dated 2 July 2025 increased clarity and fairness around foreclosure charges. These measures improve comparability and borrower protection but can alter product economics, documentation and recognition of stress for applicable portfolios
The Digital Personal Data Protection Act, 2023 and Rules notified in 2025 establish requirements for notice, consent, purpose limitation, security and data-principal rights. For a digital lender, compliance requires systems changes, vendor-contract alignment, data inventories, incident controls and customer-rights workflows. Strong compliance can support trust, while failures can create regulatory, reputational and operational costs
The RBI's consolidated master directions, strengthened internal-ombudsman framework and Integrated Ombudsman Scheme, 2026 aim to improve regulatory clarity and complaint resolution. These reforms favour lenders with mature governance and technology, but increase the cost of weak controls. Housing initiatives such as PMAY can also support HHFL's addressable market, subject to borrower eligibility, scheme execution and property-level underwriting
- Overview
- Business
- Financial Highlights
- Industry Overview
- Documentation
Get the Preqt App and keep in touch around the clock!
 Monitor your investments in real-time.
- Receive tailored deal suggestions.
- Get real-time updates and alerts.
