


Hindon Mercantile Limited
IPO Review and Rating
Watchlist
Overall Recommendation
Hindon has achieved strong two-year revenue growth, improving profitability, a rapidly expanding loan book and comparatively sound board composition. However, parent-attributable ROE remains below 10%, leverage is elevated, FY24 operating cash flow turned deeply negative, and standalone asset quality weakened. The attached 104.2x diluted P/E and 7.5x P/B offer limited valuation comfort
PARAMETER
WEIGHT
SCORE
KEY FACTORS
Financial Performance
25.0%
3.0/5
Profitability improved, but modest shareholder ROE, high leverage and negative FY24 operating cash flow constrain financial quality
Show more
Detailed Analysis
Operating revenue increased from INR 77.7 crore in FY22 to INR 111.06 crore in FY24, representing a 19.5% CAGR
Mechanical EBITDA margin is 64.5%, but EBITDA is unsuitable for lenders; the more relevant pre-provision operating margin is approximately 22.8% PAT of ₹12.90 crore represents a 10.7% margin; the reported INR 18.51 crore includes minority shareholders’ profit
Consolidated debt of approximately INR 683 crore against total equity of INR 269.4 crore produces elevated leverage of 2.5x
Operating cash flow was positive INR 88.8 crore in FY23 but negative INR 402.4 crore in FY24 due primarily to loan-book expansion
Industry
25.0%
2.6/5
Rapid green-finance growth supports expansion, while intense competition, domestic concentration and stringent RBI oversight elevate execution risk
Show more
Detailed Analysis
The RBI reported 16.1% NBFC credit growth in FY23, including 14.6% vehicle-loan growth
The market is fragmented, with strong competition from banks, established NBFCs and specialised fintech lenders
The group operates across NBFC lending, P2P, account aggregation and prepaid instruments, all subject to extensive RBI regulation
The group reported nil foreign-currency income and remains almost entirely dependent on domestic credit demand
Management
25.0%
4.2/5
Experienced promoters and a 50% independent board support governance
Show more
Detailed Analysis
Kapil Garg’s disclosed professional history indicates over 20 years in finance, accounting and fintech-related activities
Three of the six FY24 directors were independent, producing an independent-director representation of 50%
No promoter-share pledge was disclosed, while the auditor reported no pending litigation materially affecting the group’s financial position
Recurring operating related-party dealings remained below 5% of income; advances and warrant subscriptions were separately disclosed as financing transactions
Valuation Metrics
25.0%
2.2/5
Shareholder-based P/E and P/B remain extremely expensive
Show more
Detailed Analysis
The diluted P/E of 104.19x represents an extreme premium to the median industry P/E of 30
EV/EBITDA is not meaningful for an NBFC because borrowings and finance costs are operating inputs
The 7.5x P/B is substantially high
TOTAL
100%
3.0/5
Weighted Composite Score
Per Share Price
₹815.0
As of 14 Oct 2026
Lot Size
100.0 Shares
Minimum Investment
₹81,500.0 / 100 shares
Market Cap. (₹ Cr)
Revenue FY’24
PAT FY’24
P/E Multiple
Face Value
₹ 10.0Lot Size
100.0 sharesPAT FY’24
₹ 18.5 CrPAT Margin (%)
15.4 %P/E Multiple
104.0xCAGR Growth 2Y
19.5 %ROE (FY’24)
9.0 %ROCE (FY’24)
10.7 %Price to Book Value ratio
7.5xDebt/Equity (FY’24)
2.5xMerchant banker appointed
❌ NoCompany Website
hindon.coDisclaimer: Unlisted shares are unregulated & illiquid. This is NOT investment advice. Please do your own due diligence before investing.
Minimum Investment
₹81,500.0 / 100 sharesShares Lot 100 X 1
Investment amount
₹81,500.0
Overview
Business
Business Model
Geographical Presence
Sales Channel
Financial Highlights
Income Statement
Revenue growth with EBITDA and PAT margins
| Financial Metric | FY 2022 | FY 2023 | FY 2024 |
|---|---|---|---|
| Revenue (₹ Cr) | 81.5 | 115.6 | 120.4 |
| Growth (%) | 0.0% | 41.8% | 4.1% |
| EBITDA (₹ Cr) | 7.4 | 20.1 | 30.1 |
| EBITDA Margin (%) | 9.1% | 17.4% | 25.0% |
| PAT (₹ Cr) | 5.2 | 12.3 | 18.5 |
| PAT Margin (%) | 6.4% | 10.7% | 15.4% |
OBSERVATIONS & INSIGHTS
Operating revenue grew at a 19.5% CAGR from FY22 to FY24, although FY24 growth slowed to 1.2%; stronger other income lifted total-income growth to 4.2%
The financing-margin proxy improved from 9.1% to 25.0%, while PAT margin rose from 6.4% to 15.4%. FY24 PAT grew 50.2% despite modest top-line growth
FY24 standalone total income fell to ₹20.2 Cr from ₹80.1 Cr after loan-book restructuring, while consolidated income reached ₹120.4 Cr. The group outcome therefore depends heavily on Mufin Green Finance and other subsidiaries
FY24 group PAT was ₹18.5 Cr, but ₹12.9 Cr was attributable to Hindon owners and ₹5.6 Cr to non-controlling interests
Balance Sheet
| Financial Metric | FY 2022 | FY 2023 | FY 2024 |
|---|---|---|---|
| EQUITY & LIABILITIES | ₹ 513.8 Cr | ₹ 466.6 Cr | ₹ 1,000.7 Cr |
| Net Worth | ₹ 102.0 Cr | ₹ 177.2 Cr | ₹ 269.4 Cr |
| Share Capital | ₹ 12.8 Cr | ₹ 14.8 Cr | ₹ 14.8 Cr |
| Reserves & Surplus | ₹ 89.2 Cr | ₹ 162.4 Cr | ₹ 254.6 Cr |
| Total Liabilities | ₹ 411.8 Cr | ₹ 289.4 Cr | ₹ 731.3 Cr |
| Current Liabilities | ₹ 110.2 Cr | ₹ 132.2 Cr | ₹ 150.3 Cr |
| Borrowings | ₹ 0.0 Cr | ₹ 0.0 Cr | ₹ 0.0 Cr |
| Trade Payables | ₹ 101.6 Cr | ₹ 117.3 Cr | ₹ 128.2 Cr |
| Other Current Liabilities | ₹ 8.6 Cr | ₹ 14.9 Cr | ₹ 22.1 Cr |
| Non-Current Liabilities | ₹ 301.6 Cr | ₹ 157.2 Cr | ₹ 581.0 Cr |
| Borrowings | ₹ 300.9 Cr | ₹ 149.6 Cr | ₹ 554.8 Cr |
| Other Non-Current Liabilities | ₹ 0.7 Cr | ₹ 7.6 Cr | ₹ 26.2 Cr |
| ASSETS | ₹ 513.6 Cr | ₹ 466.5 Cr | ₹ 1,000.6 Cr |
| Current Assets | ₹ 478.6 Cr | ₹ 364.6 Cr | ₹ 658.2 Cr |
| Trade Receivables | ₹ 1.2 Cr | ₹ 0.5 Cr | ₹ 0.8 Cr |
| Inventory | ₹ 0.0 Cr | ₹ 0.0 Cr | ₹ 0.0 Cr |
| Cash & Cash Equivalents | ₹ 11.2 Cr | ₹ 31.7 Cr | ₹ 99.3 Cr |
| Other Current Assets | ₹ 466.2 Cr | ₹ 332.4 Cr | ₹ 558.1 Cr |
| Non-Current Assets | ₹ 35.0 Cr | ₹ 101.9 Cr | ₹ 342.4 Cr |
| Fixed Assets | ₹ 3.0 Cr | ₹ 4.3 Cr | ₹ 14.1 Cr |
| Other Non-Current Assets | ₹ 32.0 Cr | ₹ 97.6 Cr | ₹ 328.3 Cr |
OBSERVATIONS & INSIGHTS
Total assets increased 114.5% to ₹1,000.7 Cr, driven by ₹366.6 Cr growth in loans, ₹121.2 Cr growth in bank balances and ₹67.6 Cr growth in cash
Shareholders' wealth rose 52.0% to ₹269.4 Cr in FY24, supported by subsidiary capital issuance, retained earnings and higher non-controlling interest
Total debt increased from ₹266.9 Cr in FY23 to ₹683.0 Cr in FY24. Non-current borrowings of ₹554.8 Cr represented the largest liability category
Consolidated loans reached ₹657.4 Cr, equal to 65.7% of total assets. Underwriting, collections, expected credit-loss assumptions and loan seasoning are therefore the principal balance-sheet risk
Cash Flow
| Financial Metric | FY 2022 | FY 2023 | FY 2024 |
|---|---|---|---|
CFO (₹ Cr) Cash generated from core business operations. | -78.0 Cr | +88.9 Cr | -402.4 Cr |
CFI (₹ Cr) Cash used for investments and long-term assets. | -85.7 Cr | +5.1 Cr | -14.7 Cr |
CFF (₹ Cr) Cash flow related to funding and borrowings. | +112.8 Cr | -73.6 Cr | +484.7 Cr |
Financial Ratios
Measures the company’s leverage relative to shareholder equity.
OBSERVATIONS & INSIGHTS
Debt / equity fell to 1.5x in FY23 after portfolio restructuring, then increased to 2.5x as total debt rose to ₹683.0 Cr in FY24
ROE eased to 9.0% even as PAT increased because parent shareholders' equity rose 35.5% in FY24 and a larger share of group earnings accrued to non-controlling investors
The 4.4x current ratio appears strong, but unrestricted cash, pledged deposits, collection timing and loan delinquencies are more informative than the headline ratio for an NBFC
Industry Overview
Industry Drivers
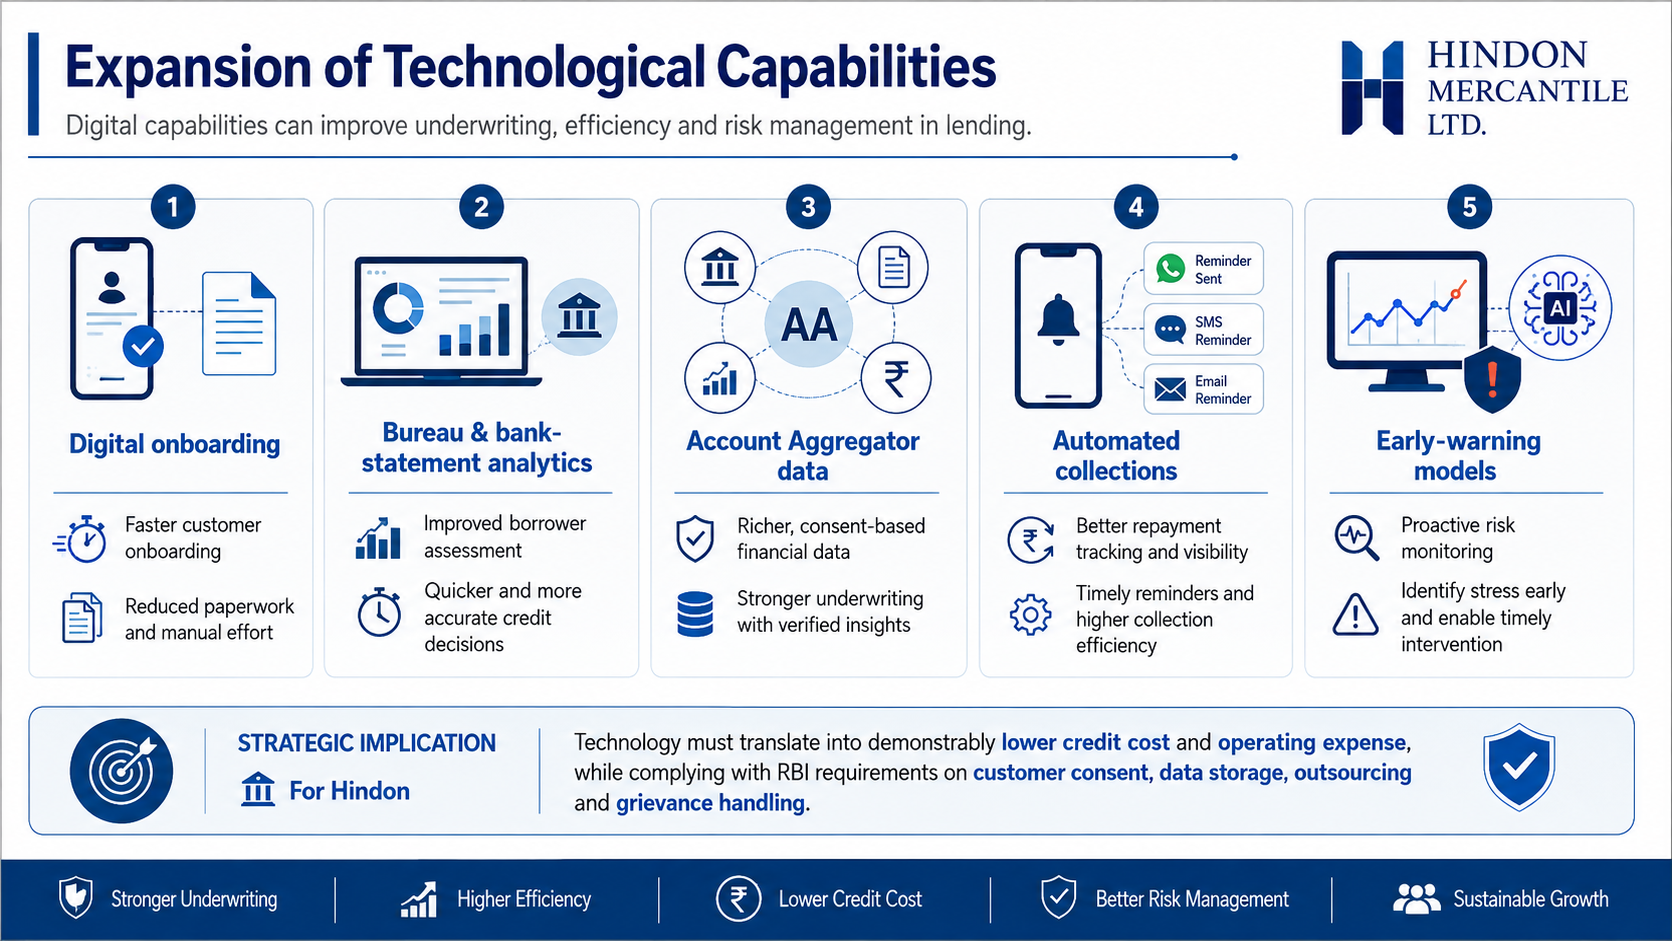
Expansion of Technological Capabilities
Digital onboarding, bureau and bank-statement analytics, account-aggregator data, automated collections and early-warning models can lower turnaround time and improve risk selection
For Hindon, technology must translate into demonstrably lower credit cost and operating expense, while meeting RBI requirements on customer consent, data storage, outsourcing and grievance handling
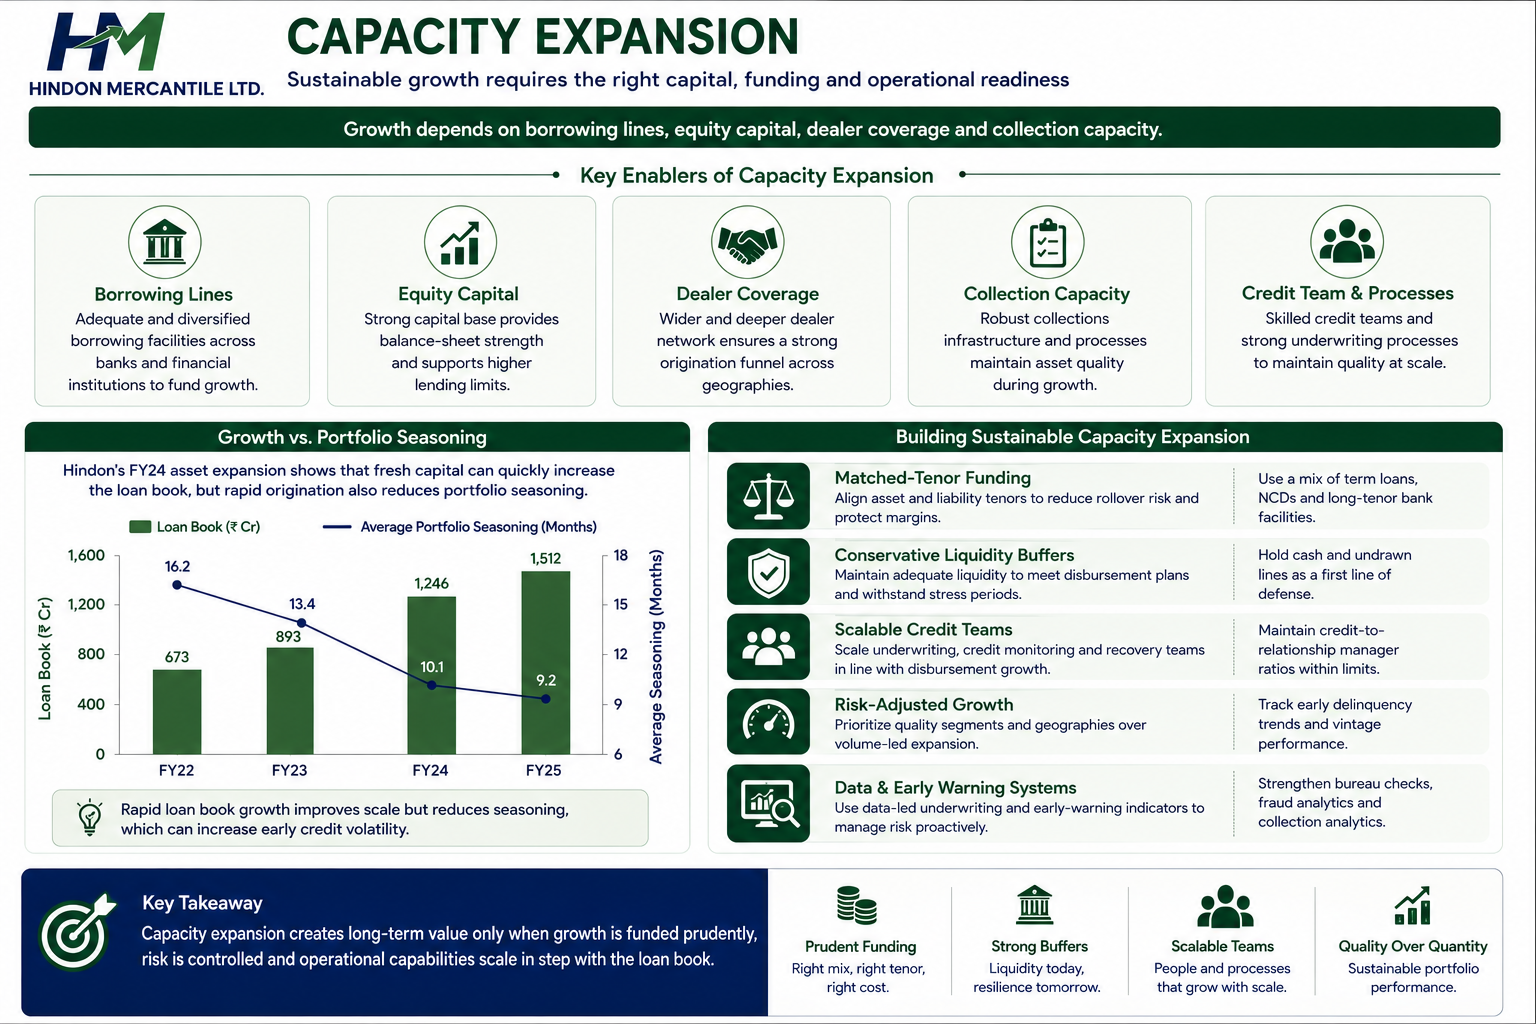
Capacity Expansion
Growth depends on borrowing lines, equity capital, dealer coverage and collection capacity
Hindon's FY24 asset expansion shows that fresh capital can quickly increase the loan book, but rapid origination also reduces portfolio seasoning
Sustainable capacity expansion requires matched-tenor funding, conservative liquidity buffers and credit teams that scale with disbursements
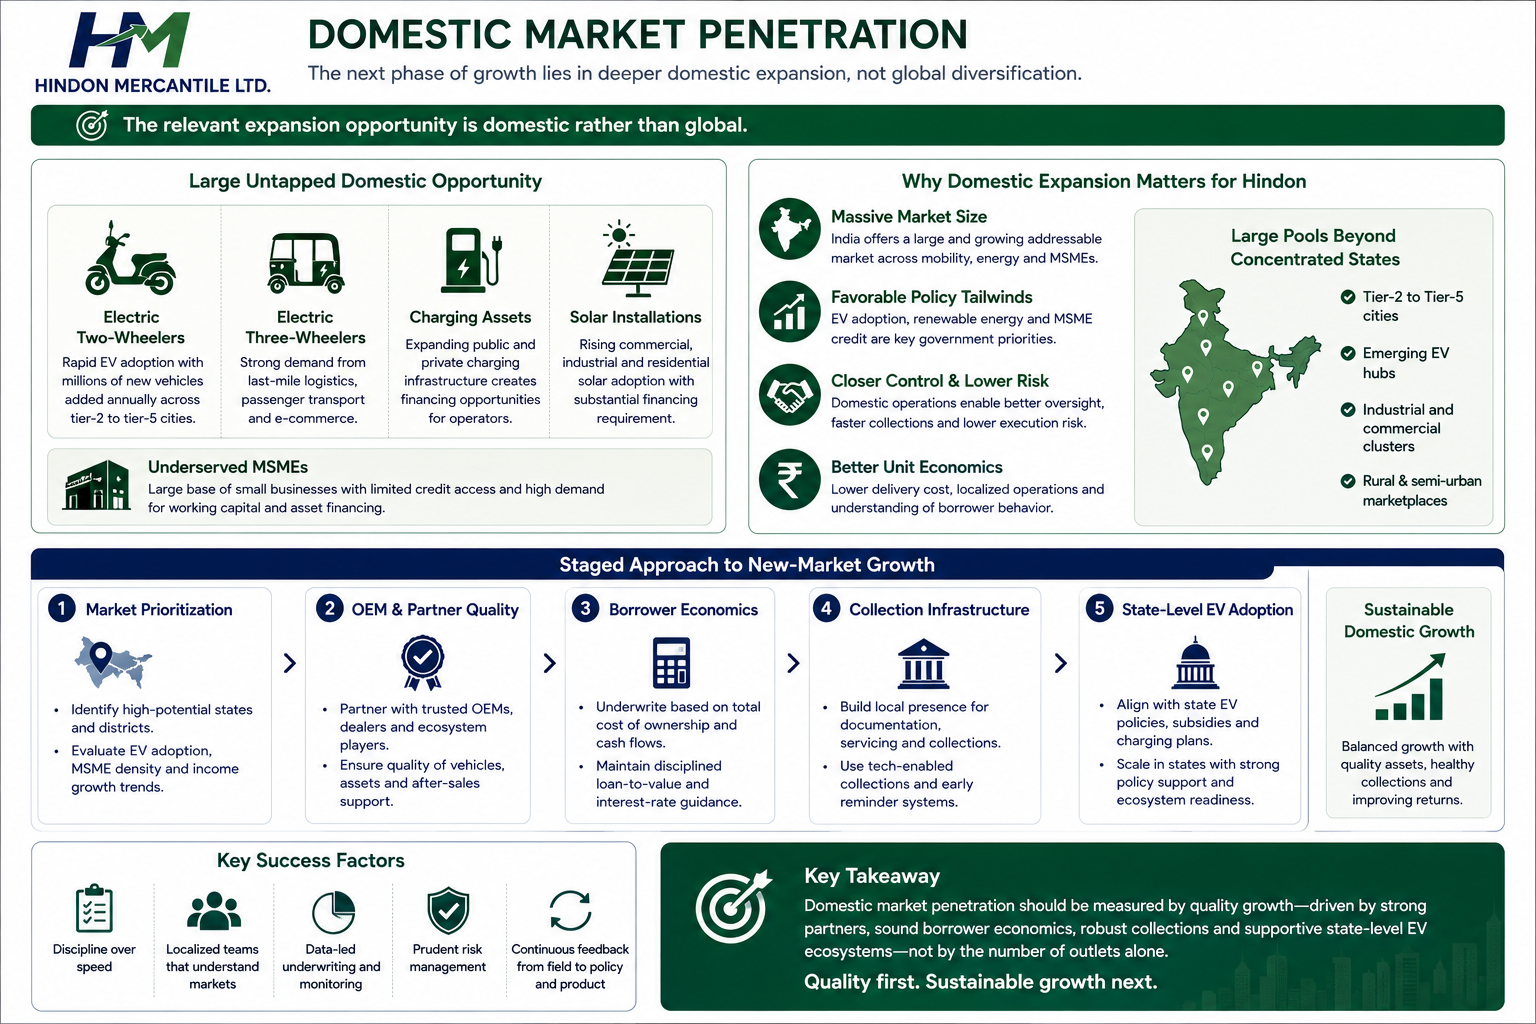
Domestic Market Penetration
The relevant expansion opportunity is domestic rather than global
Electric two- and three-wheelers, charging assets, solar installations and underserved MSMEs offer large pools beyond the group's concentrated states
New-market growth should be staged around OEM quality, borrower economics, collection infrastructure and state-level EV adoption rather than outlet count alone
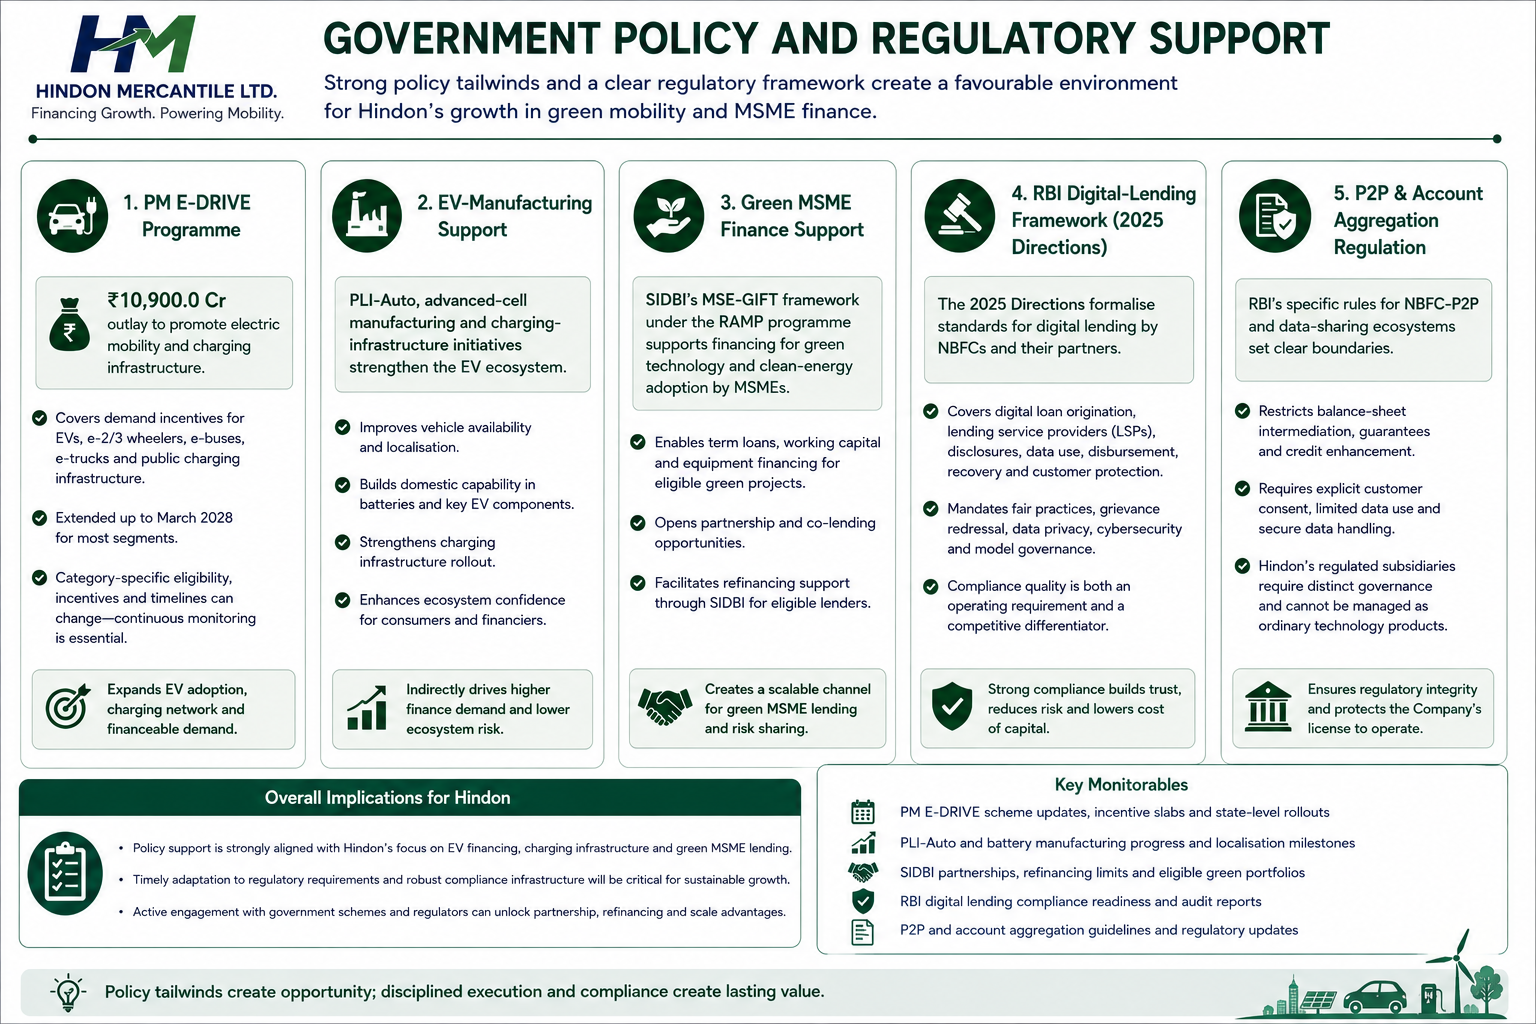
Government Policy Support
The Government's ₹10,900.0 Cr programme supports electric mobility and charging infrastructure and has been extended to March 2028 for most segments, although category-specific eligibility and timelines can change
SIDBI's MSE-GIFT framework under the RAMP programme supports financing for green technology and clean-energy adoption by MSMEs, creating partnership and refinancing opportunities for eligible lender
The 2025 Directions formalise requirements for digital loan origination, lending-service providers, disclosures, data use, disbursement, recovery and customer protection. Compliance quality is both an operating requirement and a competitive differentiator
- Overview
- Business
- Financial Highlights
- Industry Overview
- Documentation
Get the Preqt App and keep in touch around the clock!
 Monitor your investments in real-time.
- Receive tailored deal suggestions.
- Get real-time updates and alerts.
