


Hinduja Leyland Finance Ltd
Bharat’s Vehicle Financier
IPO Review Rating
Overall Recommendation
PARAMETER
WEIGHT
SCORE
KEY FACTORS
TOTAL
100%
0.0/5
Weighted Composite Score
Per Share Price
₹235.0
As of 14 Oct 2026
Lot Size
500.0 Shares
Minimum Investment
₹1,17,50,000.0 / 50,000 shares
Market Cap. (₹ Cr)
Revenue FY’25
PAT FY’25 (in Cr)
P/E Multiple
Face Value
₹ 10.0Lot Size
500.0 sharesSale Type
PrimaryPAT FY’25 (in Cr)
₹ 773.8 CrPAT Margin (%)
12.3 %P/E Multiple
16.3xCAGR Growth 3Y
31.2 %Price to Book Value ratio
1.5xMerchant banker appointed
❌ NoCompany Website
www.hindujaleylandfinance.comDisclaimer: Unlisted shares are unregulated & illiquid. This is NOT investment advice. Please do your own due diligence before investing.
Minimum Investment
₹1,17,50,000.0 / 50,000 sharesShares Lot 500 X 100
Investment amount
₹1,17,50,000.0
Overview
Business
Business Model
Geographical Presence
Sales Channel
Clients
Financial Highlights
Income Statement
Revenue growth with EBITDA and PAT margins
| Financial Metric | FY 2023 | FY 2024 | FY 2025 |
|---|---|---|---|
| Revenue (₹ Cr) | 3,452.1 | 4,571.9 | 6,133.7 |
| Growth (%) | 11.1% | 33.1% | 34.8% |
| EBITDA (₹ Cr) | 2,393.2 | 3,449.1 | 4,667.2 |
| EBITDA Margin (%) | 68.3% | 74.0% | 74.3% |
| PAT (₹ Cr) | 489.9 | 636.4 | 773.8 |
| PAT Margin (%) | 14.0% | 13.7% | 12.3% |
OBSERVATIONS & INSIGHTS
Consolidated total revenue increased from ₹3,501.55 Cr in FY23 to ₹6,280.51 Cr in FY25, implying a 3-year CAGR of approximately 33.9%.
EBITDA increased from ₹2,393.21 Cr in FY23 to ₹4,667.20 Cr in FY25, while EBITDA margin improved from 68.3% to 74.3%, supported by higher revenue and operating scale, though finance cost remains a major cost component for the NBFC model.
PAT increased from ₹489.99 Cr in FY23 to ₹773.80 Cr in FY25, although PAT margin moderated from approximately 14.0% to 12.3%.
AUM increased from ₹30,239 Cr in FY23 to ₹47,872 Cr in FY25, indicating strong loan book expansion.
FY25 disbursements stood at ₹22,163 Cr, compared with ₹16,134 Cr in FY23.
Balance Sheet
| Financial Metric | FY 2023 | FY 2024 | FY 2025 |
|---|---|---|---|
| EQUITY & LIABILITIES | ₹ 32,419.4 Cr | ₹ 44,877.3 Cr | ₹ 56,532.4 Cr |
| Net Worth | ₹ 5,598.5 Cr | ₹ 6,810.7 Cr | ₹ 8,694.8 Cr |
| Share Capital | ₹ 535.0 Cr | ₹ 535.2 Cr | ₹ 545.2 Cr |
| Reserves & Surplus | ₹ 5,063.5 Cr | ₹ 6,275.5 Cr | ₹ 8,149.6 Cr |
| Total Liabilities | ₹ 26,820.9 Cr | ₹ 38,066.6 Cr | ₹ 47,837.6 Cr |
| Current Liabilities | ₹ 9,453.0 Cr | ₹ 12,265.1 Cr | ₹ 12,782.3 Cr |
| Borrowings | ₹ 8,899.9 Cr | ₹ 11,497.4 Cr | ₹ 11,887.0 Cr |
| Trade Payables | ₹ 32.6 Cr | ₹ 30.2 Cr | ₹ 85.3 Cr |
| Other Current Liabilities | ₹ 520.5 Cr | ₹ 737.5 Cr | ₹ 810.0 Cr |
| Non-Current Liabilities | ₹ 17,367.9 Cr | ₹ 25,801.5 Cr | ₹ 35,055.3 Cr |
| Borrowings | ₹ 17,035.4 Cr | ₹ 25,204.9 Cr | ₹ 34,006.5 Cr |
| Other Non-Current Liabilities | ₹ 332.5 Cr | ₹ 596.6 Cr | ₹ 1,048.8 Cr |
| ASSETS | ₹ 32,419.4 Cr | ₹ 44,877.3 Cr | ₹ 56,531.9 Cr |
| Current Assets | ₹ 10,970.6 Cr | ₹ 15,204.6 Cr | ₹ 19,895.9 Cr |
| Trade Receivables | ₹ 0.0 Cr | ₹ 0.0 Cr | ₹ 0.0 Cr |
| Inventory | ₹ 0.0 Cr | ₹ 0.0 Cr | ₹ 0.0 Cr |
| Cash & Cash Equivalents | ₹ 1,046.8 Cr | ₹ 2,909.5 Cr | ₹ 3,182.4 Cr |
| Other Current Assets | ₹ 9,923.8 Cr | ₹ 12,295.1 Cr | ₹ 16,713.5 Cr |
| Non-Current Assets | ₹ 21,448.8 Cr | ₹ 29,672.7 Cr | ₹ 36,636.0 Cr |
| Fixed Assets | ₹ 158.3 Cr | ₹ 424.6 Cr | ₹ 534.3 Cr |
| Other Non-Current Assets | ₹ 21,290.5 Cr | ₹ 29,248.1 Cr | ₹ 36,101.7 Cr |
OBSERVATIONS & INSIGHTS
Total assets increased from ₹32,419.38 Cr in FY23 to ₹56,532.03 Cr in FY25, mainly driven by expansion in the loan book.
Current assets increased from ₹10,970.57 Cr in FY23 to ₹19,895.99 Cr in FY25, while non-current assets increased from ₹21,448.81 Cr to ₹36,636.04 Cr.
Net worth increased from ₹5,598.51 Cr in FY23 to ₹8,694.87 Cr in FY25, supported by retained earnings and capital raising.
Borrowings are the largest liability line, which is typical for a growing NBFC; current borrowings were ₹11,887.03 Cr and non-current borrowings were ₹34,006.51 Cr in FY25.
Cash and cash equivalents increased from ₹1,046.77 Cr in FY23 to ₹3,182.44 Cr in FY25, supporting liquidity management.
Cash Flow
| Financial Metric | FY 2023 | FY 2024 | FY 2025 |
|---|---|---|---|
CFO (₹ Cr) Cash generated from core business operations. | -6,173.9 Cr | -8,364.6 Cr | -7,218.5 Cr |
CFI (₹ Cr) Cash used for investments and long-term assets. | -830.1 Cr | -421.5 Cr | -1,736.2 Cr |
CFF (₹ Cr) Cash flow related to funding and borrowings. | +7,240.1 Cr | +10,647.7 Cr | +9,227.6 Cr |
Financial Ratios
Measures the company’s leverage relative to shareholder equity.
OBSERVATIONS & INSIGHTS
ROE remained broadly stable around 10% over FY23-FY25, reflecting steady profitability on a growing equity base.
Interest coverage ratio moderated from 1.38x in FY23 to 1.29x in FY25, reflecting the increase in finance costs as the borrowing base expanded.
Debt/equity increased from approximately 4.6x in FY23 to 5.3x in FY25, consistent with a balance-sheet lending business.
ROA moderated from 1.7% in FY23 to 1.5% in FY25 as the asset base expanded faster than net profit.
Capital adequacy stood at 19.29% in FY25, above the 15% regulatory minimum applicable to NBFCs on a standalone basis.
Industry Overview
Industry Drivers
Vehicle Finance and Asset-Backed Lending Demand
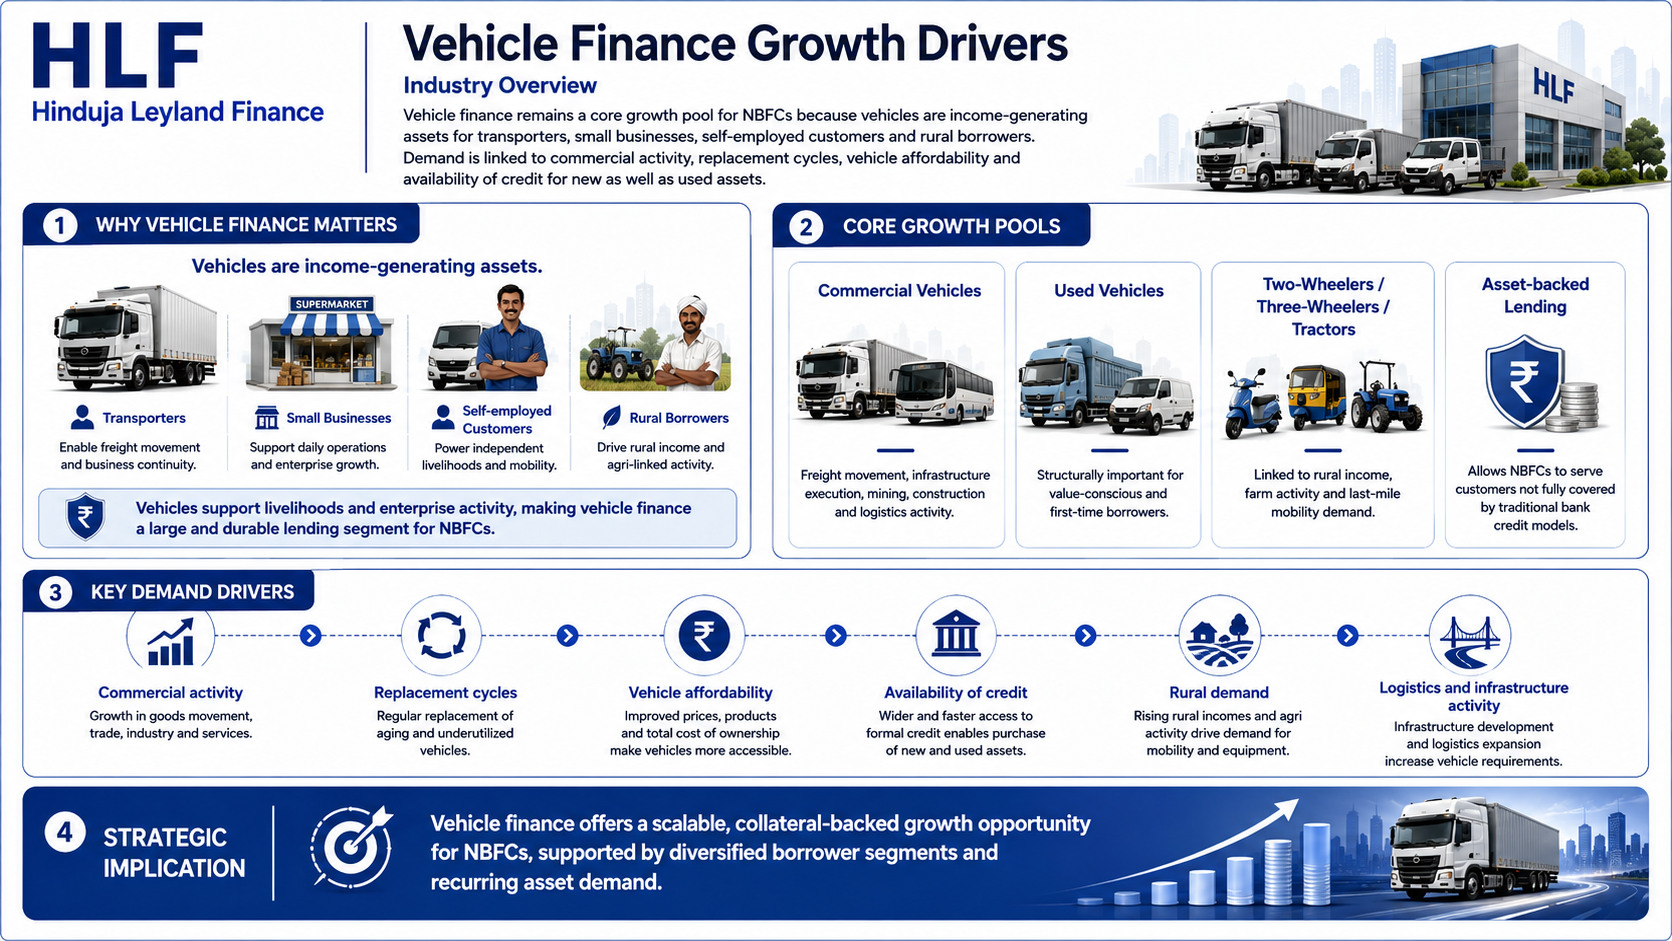
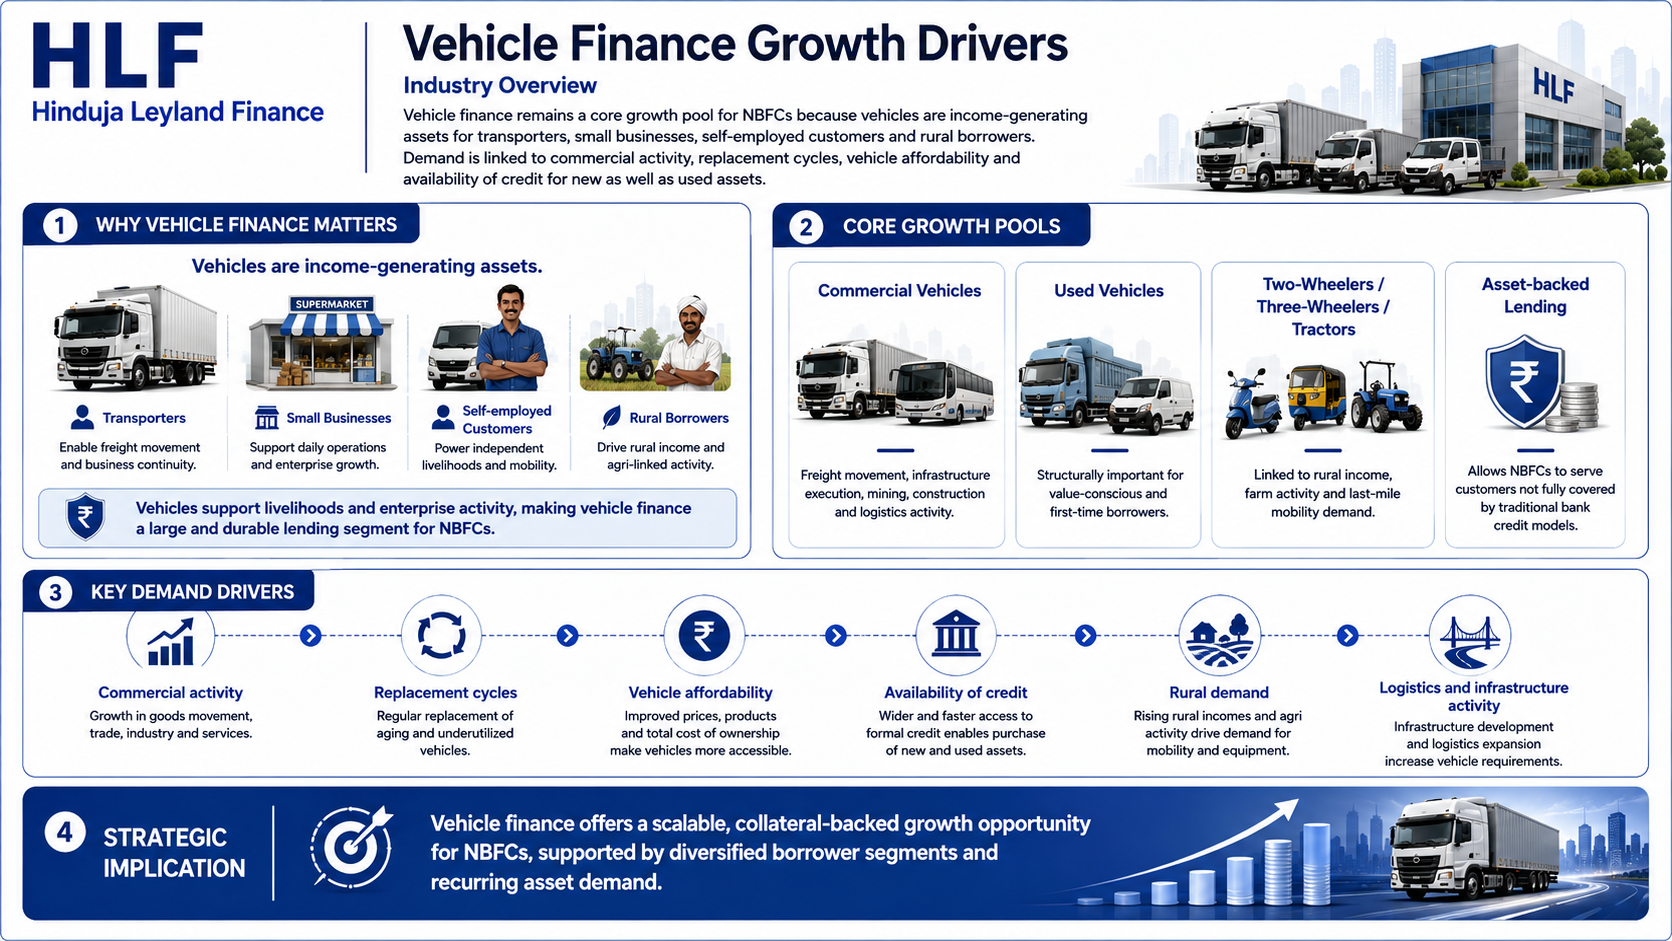
Vehicle finance remains a core growth pool for NBFCs because vehicles are income-generating assets for transporters, small businesses, self-employed customers and rural borrowers. Demand is linked to commercial activity, replacement cycles, vehicle affordability and availability of credit for new as well as used assets.
Key Drivers:
Commercial vehicle demand is supported by freight movement, infrastructure execution, mining, construction and logistics activity.
Used vehicle financing remains structurally important because it serves value-conscious and first-time borrowers.
Two-wheeler, three-wheeler and tractor finance benefit from rural income, farm activity and last-mile mobility demand.
Asset-backed lending allows NBFCs to serve customers who may not be fully covered by traditional bank credit models.
Expansion of Technological Capabilities
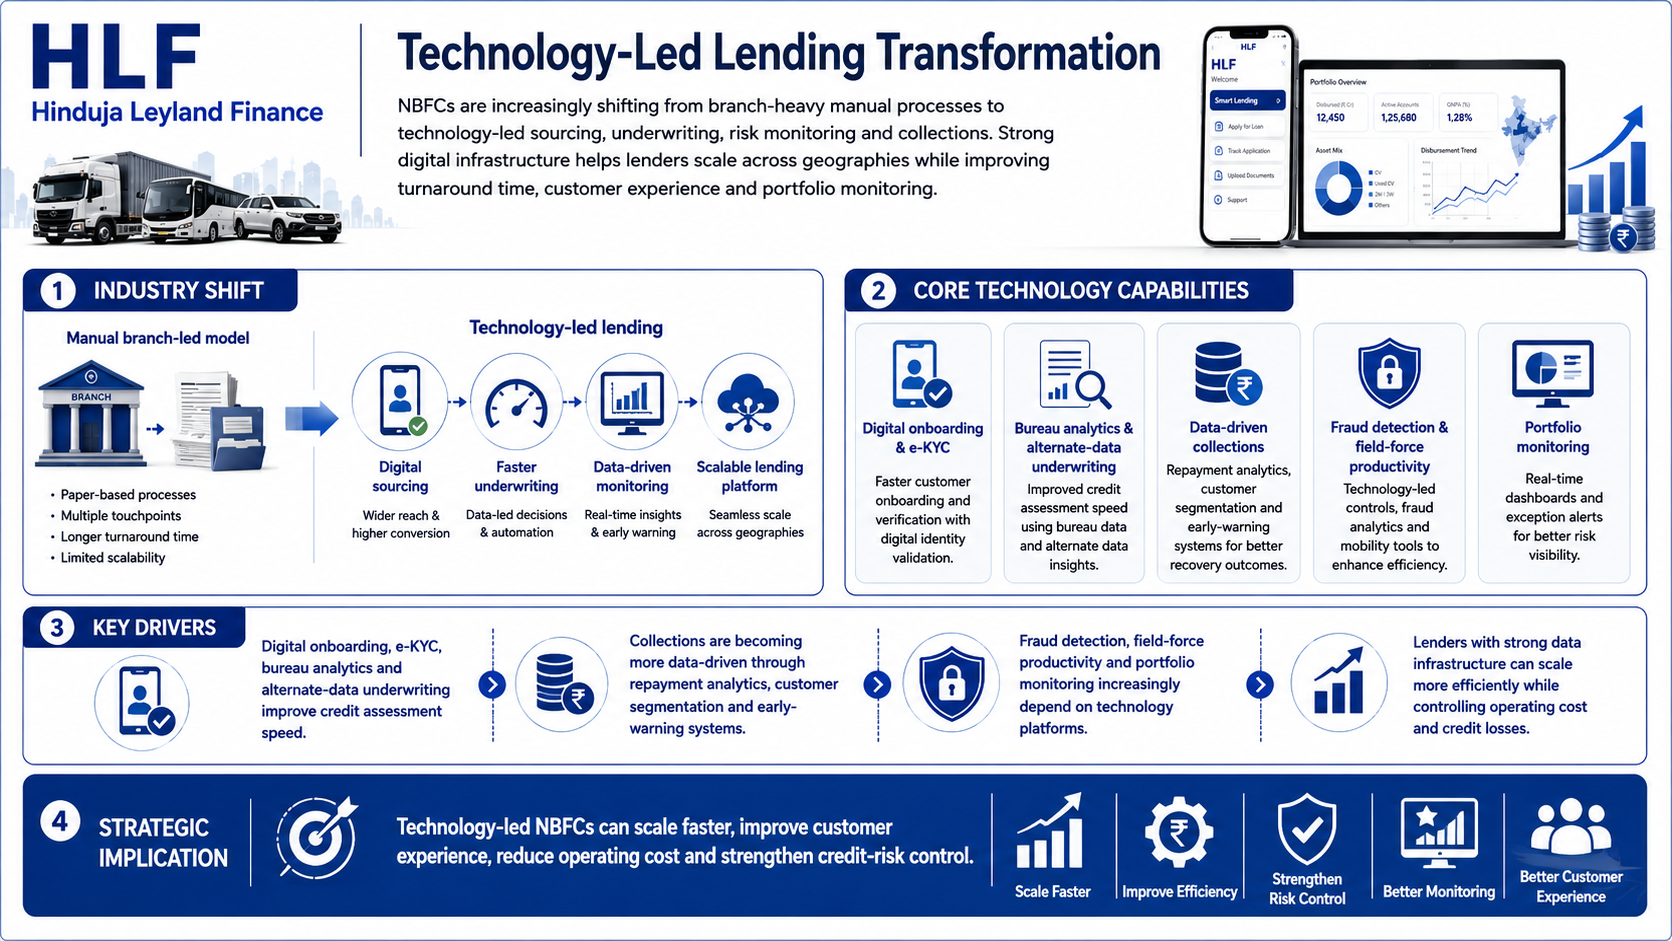
NBFCs are increasingly shifting from branch-heavy manual processes to technology-led sourcing, underwriting, risk monitoring and collections. Strong digital infrastructure helps lenders scale across geographies while improving turnaround time, customer experience and portfolio monitoring.
Key Drivers:
Digital onboarding, e-KYC, bureau analytics and alternate-data underwriting improve credit assessment speed.
Collections are becoming more data-driven through repayment analytics, customer segmentation and early-warning systems.
Fraud detection, field-force productivity and portfolio monitoring increasingly depend on technology platforms.
Lenders with strong data infrastructure can scale more efficiently while controlling operating cost and credit losses.
Distribution Reach and Ecosystem-Based Sourcing
Vehicle finance is a high-touch business where local presence, dealer relationships and field execution remain critical. NBFCs with large branch networks and vehicle ecosystem linkages can source granular borrowers, underwrite local risk better and improve collection discipline.
Key Drivers:
Dealer, OEM and used-vehicle ecosystem relationships help improve sourcing depth and customer access.
Presence across semi-urban and rural markets supports origination in underpenetrated credit segments.
Field collections and local relationship management remain important for asset-backed lending.
Cross-sell opportunities can emerge across vehicle finance, housing finance, insurance and other secured products.
Risks in the Industry
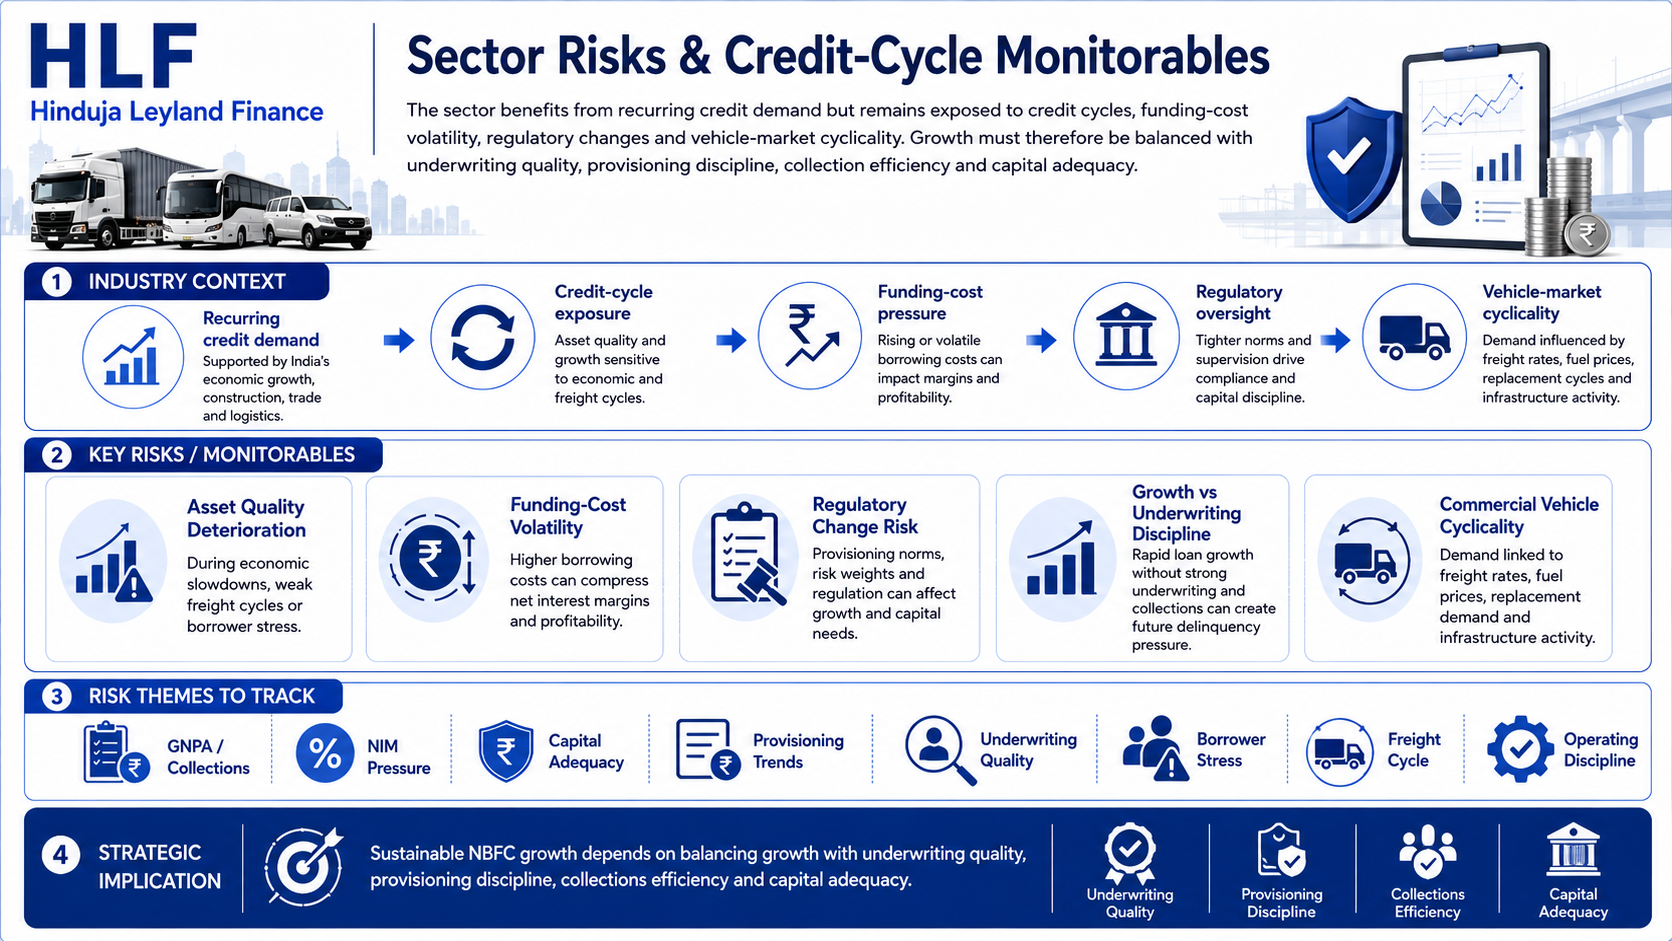
The sector benefits from recurring credit demand but remains exposed to credit cycles, funding-cost volatility, regulatory changes and vehicle-market cyclicality. Growth must therefore be balanced with underwriting quality, provisioning discipline, collection efficiency and capital adequacy.
Key Drivers:
Asset quality can deteriorate during economic slowdowns, weak freight cycles or borrower stress.
Funding cost volatility can compress net interest margins and profitability.
Regulatory changes, provisioning norms and risk-weight changes can affect growth and capital requirements.
Rapid loan growth without strong underwriting and collections can create future delinquency pressure.
Commercial vehicle demand is cyclical and linked to freight rates, fuel prices, replacement demand and infrastructure activity.
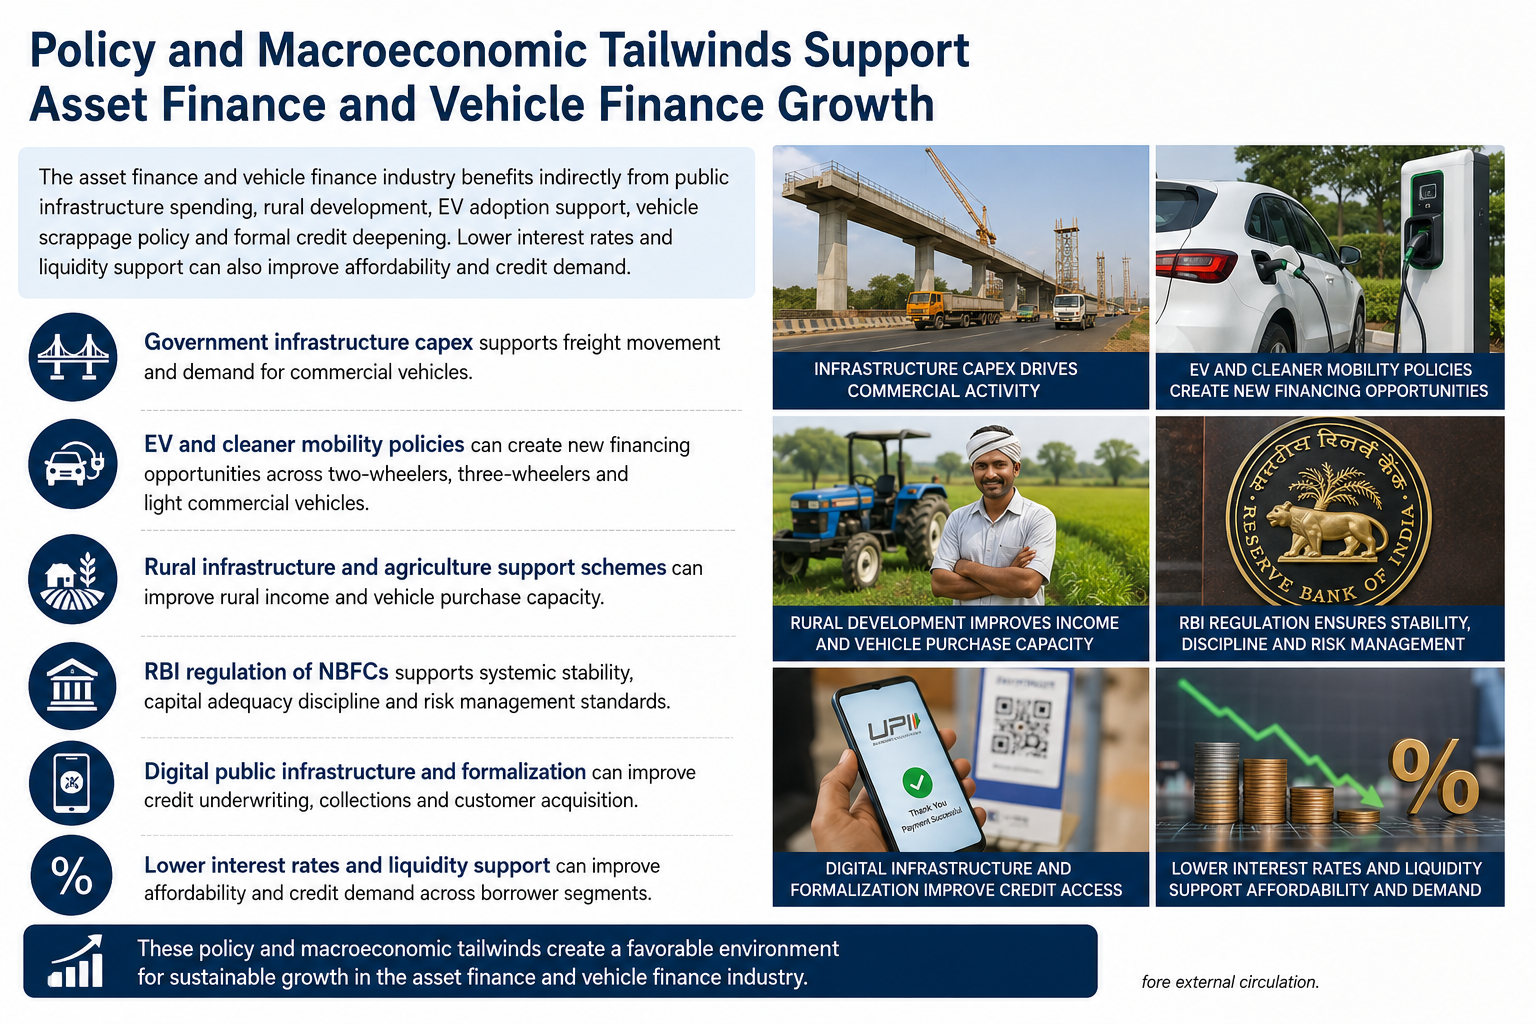
Government Policy Support
The asset finance and vehicle finance industry benefits indirectly from public infrastructure spending, rural development, EV adoption support, vehicle scrappage policy and formal credit deepening. Lower interest rates and liquidity support can also improve affordability and credit demand.
Government infrastructure capex supports freight movement and demand for commercial vehicles.
EV and cleaner mobility policies can create new financing opportunities across two-wheelers, three-wheelers and light commercial vehicles.
Rural infrastructure and agriculture support schemes can improve rural income and vehicle purchase capacity.
RBI regulation of NBFCs supports systemic stability, capital adequacy discipline and risk management standards.
Digital public infrastructure and formalization can improve credit underwriting, collections and customer acquisition.
- Overview
- Business
- Financial Highlights
- Industry Overview
- Documentation
Get the Preqt App and keep in touch around the clock!
 Monitor your investments in real-time.
- Receive tailored deal suggestions.
- Get real-time updates and alerts.
