


Hindustan Power Exchange Limited
Trading energy efficientlyPower markets, simplified
IPO Review and Rating
Considerable
Overall Recommendation
Total revenue increased from INR 17.4 Cr in FY23 to INR 47.7 Cr in FY26, representing a 39.8% 3-year CAGR, while FY26 operating revenue increased 23.0% to INR 38.4 Cr. However, profitability weakened materially: EBITDA declined 43.1% to INR 9.7 Cr, EBITDA margin compressed from 41.8% to 20.3%, PAT declined 56.9% to INR 4.6 Cr, ROE declined from 16.0% to 6.0%, and OCF moved to INR (131.1) Cr, while D/E remained 0.0x. The power-exchange industry remains attractive, with traded volumes increasing 17.3% and exchange penetration reaching 10.96% of India's electricity market, although regulatory risk remains high due to CERC oversight and market coupling
PARAMETER
WEIGHT
SCORE
KEY FACTORS
Financial Performance
25.0%
3.6/5
Total revenue recorded a 39.8% 3-year CAGR
Show more
Detailed Analysis
Total revenue increased from INR 17.4 Cr in FY23 to INR 43.6 Cr in FY24, INR 40.6 Cr in FY25 and INR 47.7 Cr in FY26, representing a 39.8% FY23-FY26 3-year CAGR
FY26 mechanical EBITDA stood at approximately INR 9.7 Cr, versus INR 17.0 Cr in FY25; EBITDA margin declined from 41.8% to 20.3%
FY26 PAT declined from INR 10.7 Cr to INR 4.6 Cr, down 56.9% YoY; PAT margin stood at 9.7% of total revenue
HPX had 0.0x D/E, with the audited accounts confirming no borrowings from banks or financial institutions as of March 31, 2026
Reported ROE declined from 16.0% in FY25 to 6.0% in FY26, reflecting the 56.9% decline in PAT despite an increase in shareholders' equity
CFO moved from INR 18.5 Cr positive in FY25 to INR (131.1) Cr in FY26; the FY26 outflow was substantially affected by a INR 137.3 Cr reduction in other financial liabilities
Industry
25.0%
3.4/5
Indian power-exchange volumes increased 17.3% to 168,551 MU in FY26
Show more
Detailed Analysis
Electricity traded through Indian power exchanges increased from 143,753 MU in FY25 to 168,551 MU in FY26, +17.3% YoY
The short-term electricity market increased from 15.16% of total electricity volumes in FY25 to 17.20% in FY26, while power-exchange penetration increased to 10.96%
IEX alone holds approximately 84.0% of the Indian power-exchange market
Power exchanges operate under CERC Power Market Regulations, while FY26 included continuing regulatory proceedings on market coupling, including draft regulations and pending Supreme Court proceedings
FY26 foreign-exchange earnings were NIL, while foreign-exchange outgo was approximately INR 2.2 Cr; HPX remains predominantly an India-focused power exchange
Management
25.0%
3.5/5
Leadership experience stands at 35+ years
Show more
Detailed Analysis
Managing Director Harish Saran has 35+ years of power-sector experience, placing leadership experience above the 30-year threshold
The Board comprised 6 Directors with 2 Independent Directors, resulting in 33.3% independent representation
No material litigation affecting the Company's financial position was reported, no fraud was reported by auditors, and no promoter-share pledge was identified in the reviewed FY26 disclosures
Recurring FY26 RPT expenses were approximately INR 10.3 Cr, largely comprising INR 8.3 Cr of BSE Technologies software/licence charges and INR 1.6 Cr of KMP compensation; this represented approximately 21.5% of FY26 total revenue
Valuation Metrics
25.0%
1.6/5
HPX is valued at approximately 300.0x displayed P/E
Show more
Detailed Analysis
The Company is valued at 300.0x FY26 P/E, representing a 1,400.0% premium. Current direct listed peer IEX trades at approximately 22.6x P/E
Estimated HPX EV/EBITDA stands at approximately 118.0x, compared with current IEX EV/EBITDA of approximately 13.9x, implying an approximately 748.0% premium
The Company is valued at approximately 18.5x P/B, based on INR 1,326.0 Cr market cap against FY26 equity of INR 71.9 Cr
TOTAL
100%
3.0/5
Weighted Composite Score
Per Share Price
₹23.0
As of 14 Oct 2026
Lot Size
1,00,000.0 Shares
Minimum Investment
₹23,00,000.0 / 1,00,000 shares
Market Cap. (₹ Cr)
Revenue FY’26
PAT FY’26
P/E Multiple
Face Value
₹ 1.0Lot Size
1,00,000.0 sharesPAT FY’26
₹ 4.6 CrPAT Margin (%)
9.7 %P/E Multiple
300.0xCAGR Growth 3Y
39.8 %ROE (FY’26)
6.0 %ROCE (FY’26)
8.7 %Price to Book Value ratio
18.5xDebt/Equity (FY’26)
0.0xMerchant banker appointed
❌ NoCompany Website
www.hpxindia.comDisclaimer: Unlisted shares are unregulated & illiquid. This is NOT investment advice. Please do your own due diligence before investing.
Minimum Investment
₹23,00,000.0 / 1,00,000 sharesShares Lot 100000 X 1
Investment amount
₹23,00,000.0
Overview
Business
Business Model
Geographical Presence
Sales Channel
Financial Highlights
Income Statement
Revenue growth with EBITDA and PAT margins
| Financial Metric | FY 2024 | FY 2025 | FY 2026 |
|---|---|---|---|
| Revenue (₹ Cr) | 43.6 | 40.6 | 47.7 |
| Growth (%) | 0.0% | -6.9% | 17.3% |
| EBITDA (₹ Cr) | 21.8 | 19.0 | 9.7 |
| EBITDA Margin (%) | 50.0% | 41.8% | 20.3% |
| PAT (₹ Cr) | 14.9 | 10.7 | 4.6 |
| PAT Margin (%) | 34.2% | 26.3% | 9.7% |
OBSERVATIONS & INSIGHTS
Total revenue declined 6.9% in FY25 and recovered 17.3% in FY26. FY24-to-FY26 total-revenue CAGR was 4.5%, while operating-revenue CAGR was 2.6%
FY26 expenses increased to ₹41.4 Cr from ₹27.2 Cr, causing EBITDA and PAT to decline despite higher revenue
FY26 trade discounts of ₹13.2 Cr were 26.5% of gross transaction fees, indicating that member incentives are a material driver of net operating revenue
Investment and other income represented 19.5% of FY26 total revenue, adding stability but reducing comparability with purely fee-based operating margins
Balance Sheet
| Financial Metric | FY 2024 | FY 2025 | FY 2026 |
|---|---|---|---|
| EQUITY & LIABILITIES | ₹ 315.4 Cr | ₹ 365.7 Cr | ₹ 215.5 Cr |
| Net Worth | ₹ 56.6 Cr | ₹ 67.3 Cr | ₹ 72.0 Cr |
| Share Capital | ₹ 55.3 Cr | ₹ 55.3 Cr | ₹ 55.3 Cr |
| Reserves & Surplus | ₹ 1.3 Cr | ₹ 12.0 Cr | ₹ 16.7 Cr |
| Total Liabilities | ₹ 258.8 Cr | ₹ 298.4 Cr | ₹ 143.5 Cr |
| Current Liabilities | ₹ 253.4 Cr | ₹ 291.8 Cr | ₹ 135.7 Cr |
| Borrowings | ₹ 0.0 Cr | ₹ 0.0 Cr | ₹ 0.0 Cr |
| Trade Payables | ₹ 5.0 Cr | ₹ 1.6 Cr | ₹ 1.9 Cr |
| Other Current Liabilities | ₹ 248.4 Cr | ₹ 290.2 Cr | ₹ 133.8 Cr |
| Non-Current Liabilities | ₹ 5.4 Cr | ₹ 6.6 Cr | ₹ 7.8 Cr |
| Borrowings | ₹ 0.0 Cr | ₹ 0.0 Cr | ₹ 0.0 Cr |
| Other Non-Current Liabilities | ₹ 5.4 Cr | ₹ 6.6 Cr | ₹ 7.8 Cr |
| ASSETS | ₹ 315.5 Cr | ₹ 365.6 Cr | ₹ 215.4 Cr |
| Current Assets | ₹ 301.4 Cr | ₹ 353.7 Cr | ₹ 154.6 Cr |
| Trade Receivables | ₹ 1.5 Cr | ₹ 1.8 Cr | ₹ 1.6 Cr |
| Inventory | ₹ 0.0 Cr | ₹ 0.0 Cr | ₹ 0.0 Cr |
| Cash & Cash Equivalents | ₹ 215.9 Cr | ₹ 234.3 Cr | ₹ 130.8 Cr |
| Other Current Assets | ₹ 84.0 Cr | ₹ 117.6 Cr | ₹ 22.2 Cr |
| Non-Current Assets | ₹ 14.1 Cr | ₹ 11.9 Cr | ₹ 60.8 Cr |
| Fixed Assets | ₹ 11.7 Cr | ₹ 10.5 Cr | ₹ 10.4 Cr |
| Other Non-Current Assets | ₹ 2.4 Cr | ₹ 1.4 Cr | ₹ 50.4 Cr |
OBSERVATIONS & INSIGHTS
Equity increased from ₹56.6 Cr in FY24 to ₹71.9 Cr in FY26, representing a 12.7% two-year CAGR
Share capital remained unchanged at ₹55.3 Cr, while retained earnings lifted reserves and surplus from ₹1.3 Cr to ₹16.7 Cr
Current assets declined 56.3% and current liabilities declined 53.5% in FY26
The parallel contraction in other current assets and liabilities indicates that the smaller balance sheet primarily reflects settlement and member-balance movements rather than a comparable contraction in the operating platform
Net working capital reduced from ₹61.9 Cr in FY25 to ₹18.9 Cr in FY26, while the current ratio declined to 1.1x
Cash Flow
| Financial Metric | FY 2024 | FY 2025 | FY 2026 |
|---|---|---|---|
CFF (₹ Cr) Cash flow related to funding and borrowings. | -0.9 Cr | -0.6 Cr | +0 Cr |
CFO (₹ Cr) Cash generated from core business operations. | +173.1 Cr | +18.5 Cr | -131.1 Cr |
CFI (₹ Cr) Cash used for investments and long-term assets. | -28.9 Cr | +0.6 Cr | +27.6 Cr |
Financial Ratios
Measures the company’s leverage relative to shareholder equity.
OBSERVATIONS & INSIGHTS
No bank or financial-institution borrowings were reported
Operating return weakened materially in FY26
Higher returns supported investment income, but do not substitute for core exchange growth
Returns contracted as PAT declined despite a larger equity base
Industry Overview
Industry Drivers
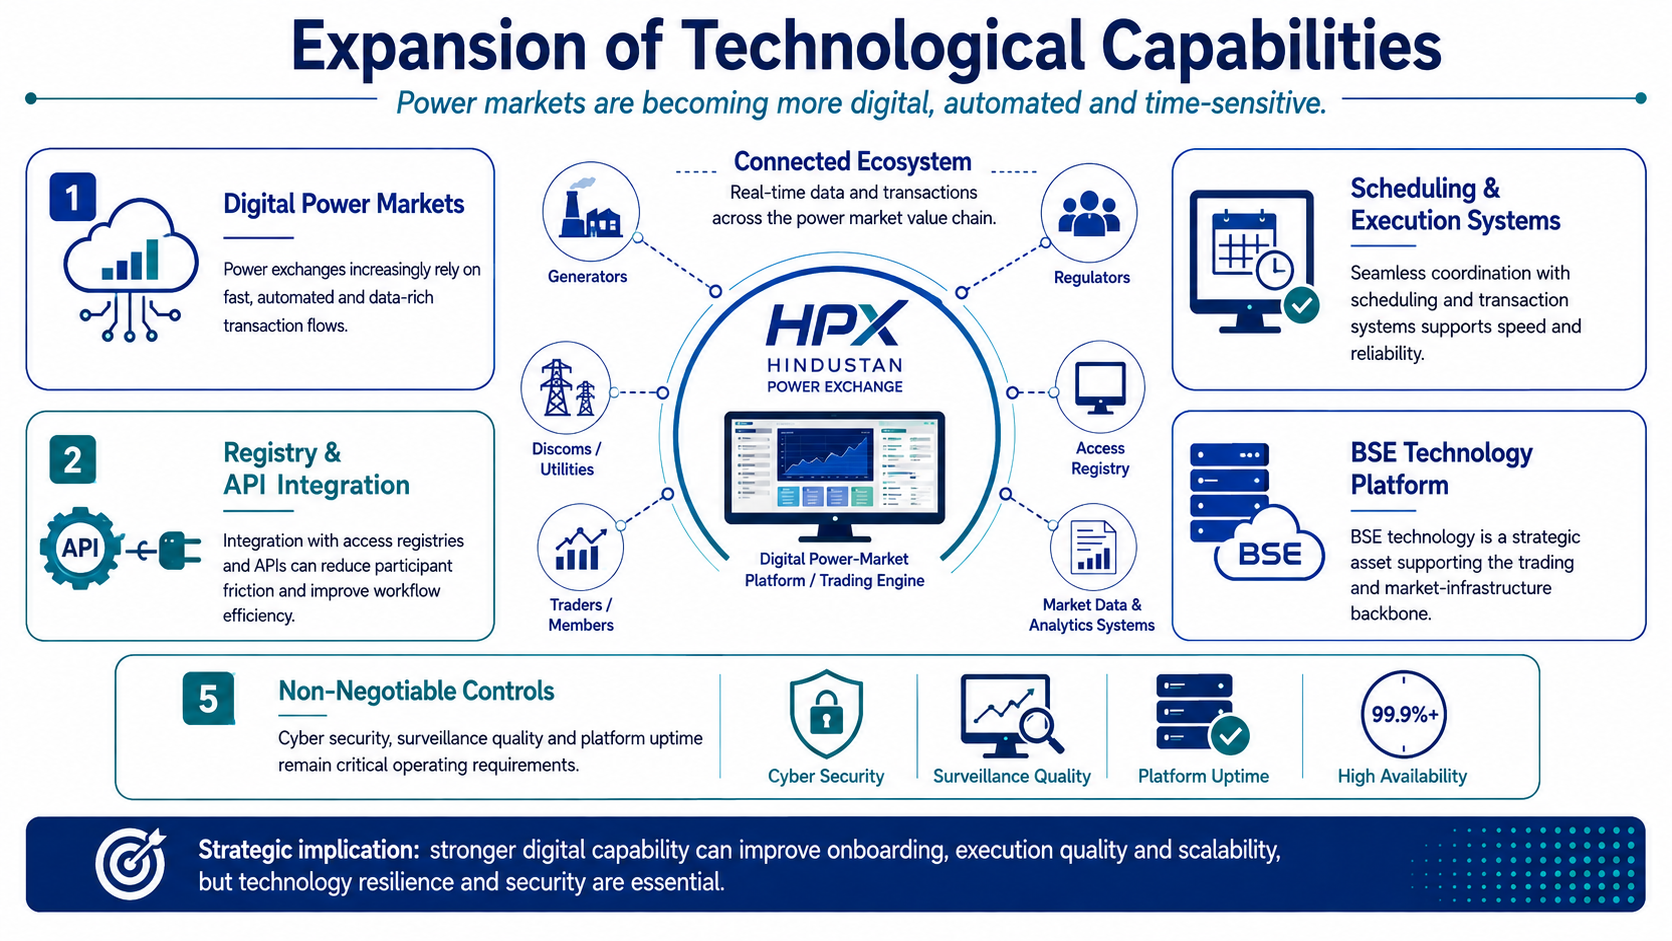
Expansion of Technological Capabilities
Power markets are becoming more digital, automated and time-sensitive
Integration with access registries, application programming interfaces, scheduling systems and high-availability trading infrastructure can reduce participant friction
For HPX, BSE technology is a strategic asset, while cyber security, surveillance quality and platform uptime remain non-negotiable operating requirements
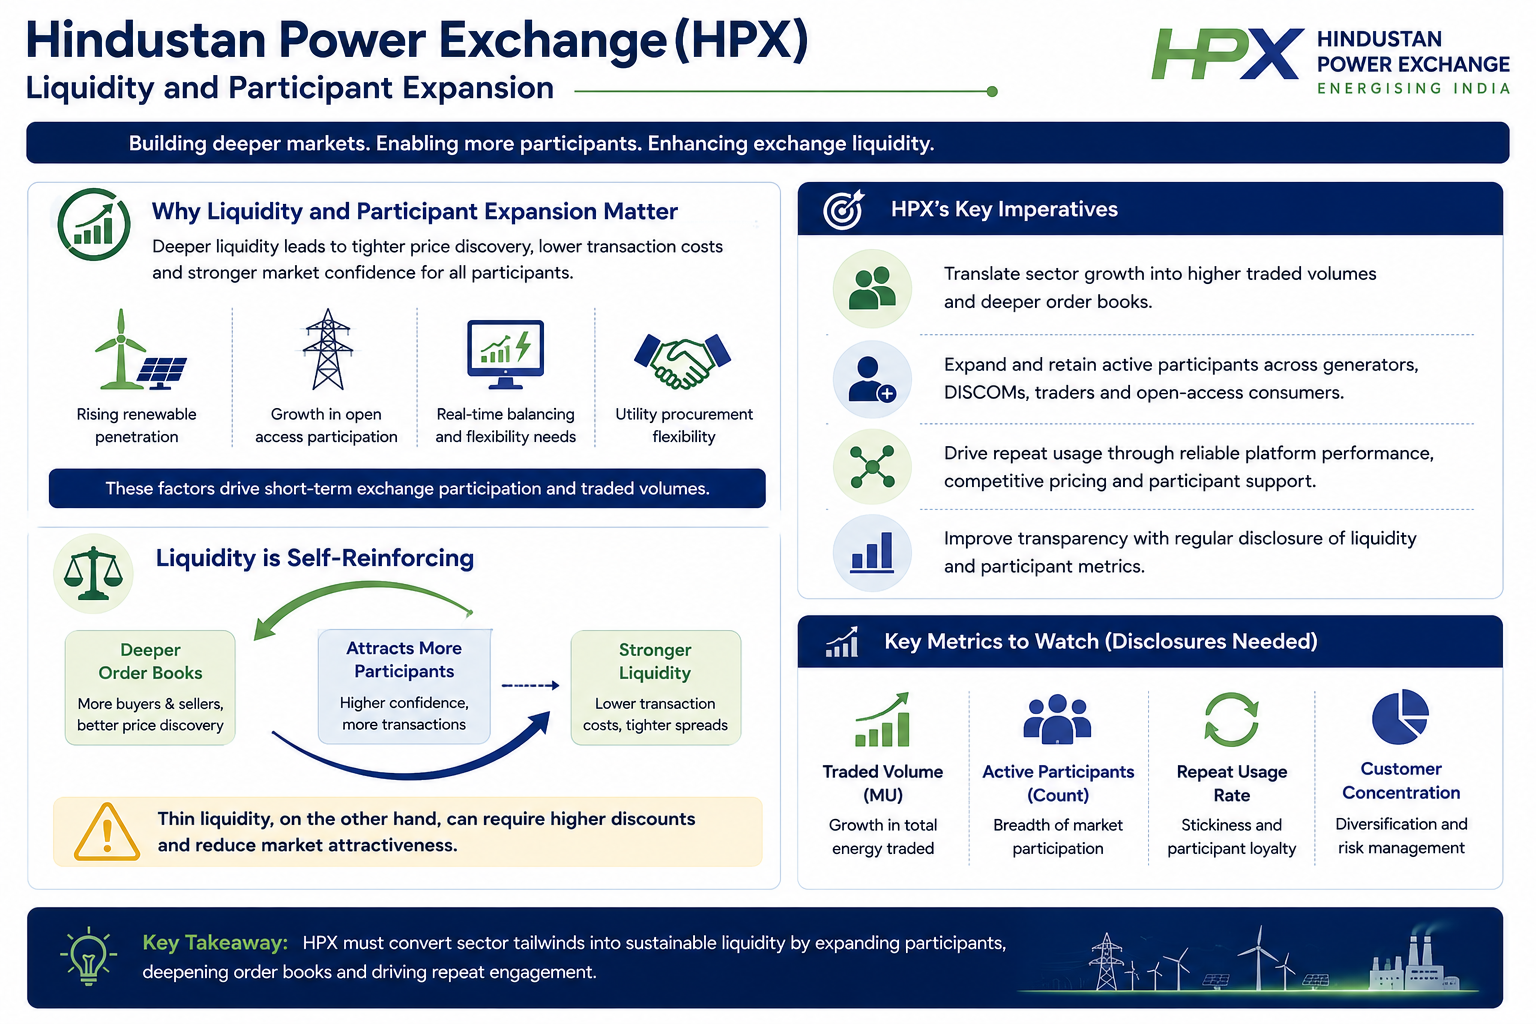
Liquidity and Participant Expansion
Rising renewable penetration, open access, real-time balancing needs and utility procurement flexibility can increase short-term exchange participation
However, liquidity is self-reinforcing: deeper order books attract users, while thin liquidity can require higher discounts
HPX must translate sector growth into disclosed traded volume, active participants and repeat usage
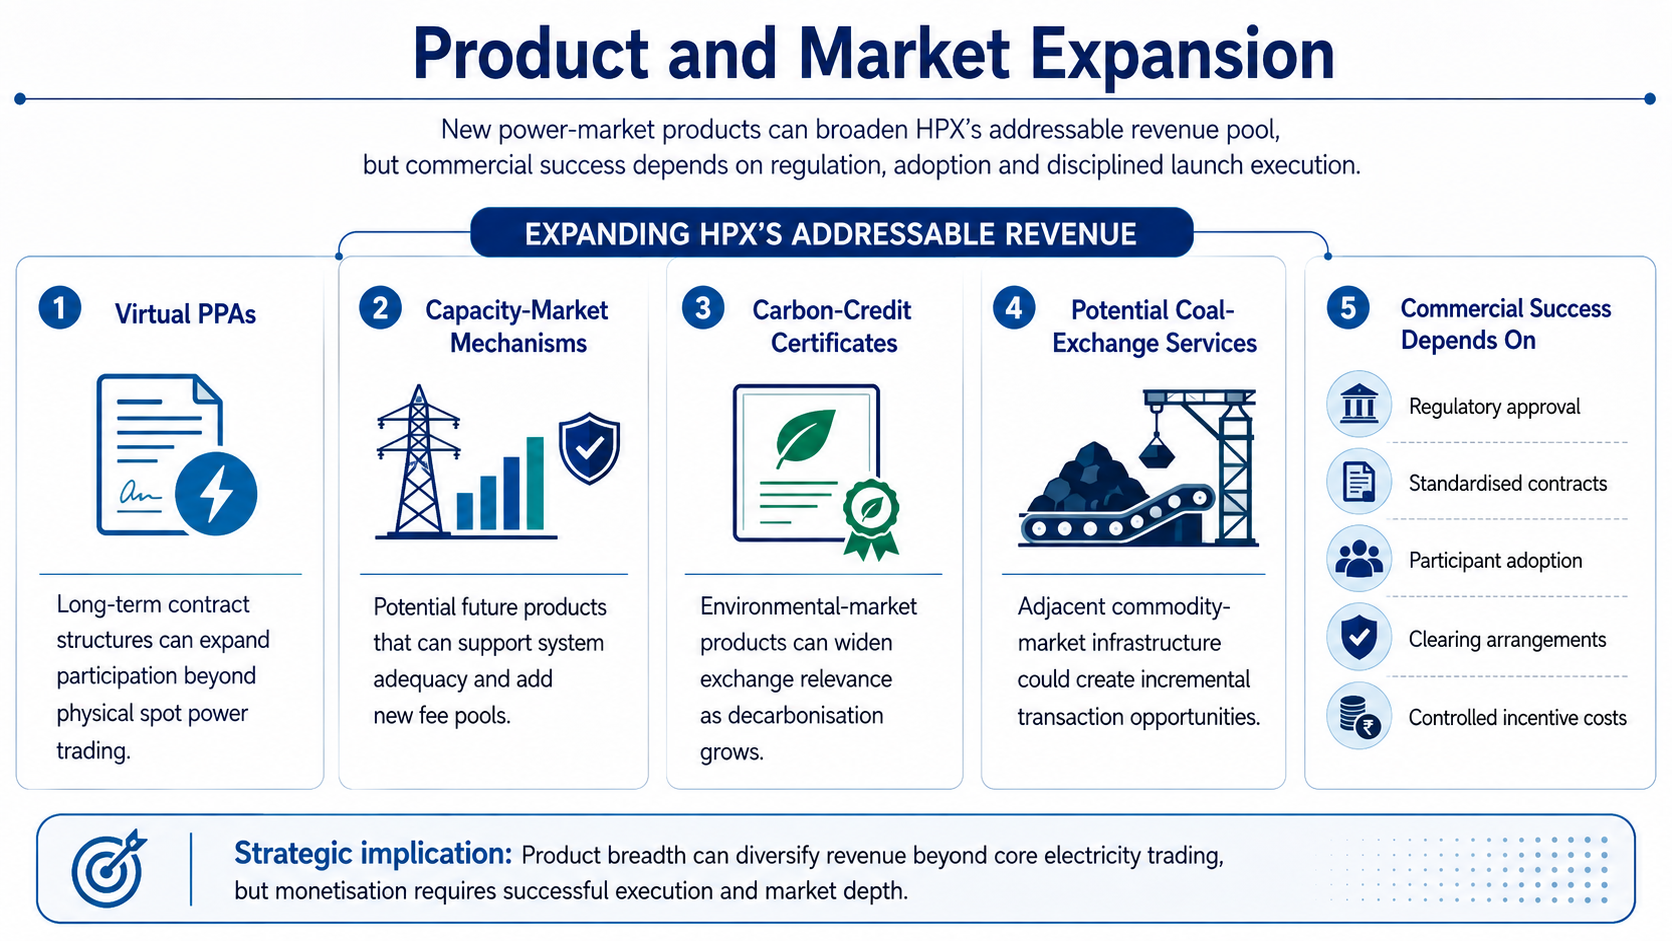
Product and Market Expansion
New products such as virtual power-purchase agreements, capacity-market mechanisms, carbon-credit certificates and potential coal-exchange services can broaden addressable revenue pools
Commercial benefit depends on regulatory approval, standardised contracts, participant adoption, clearing arrangements and the company's ability to launch without excessive incentive costs.
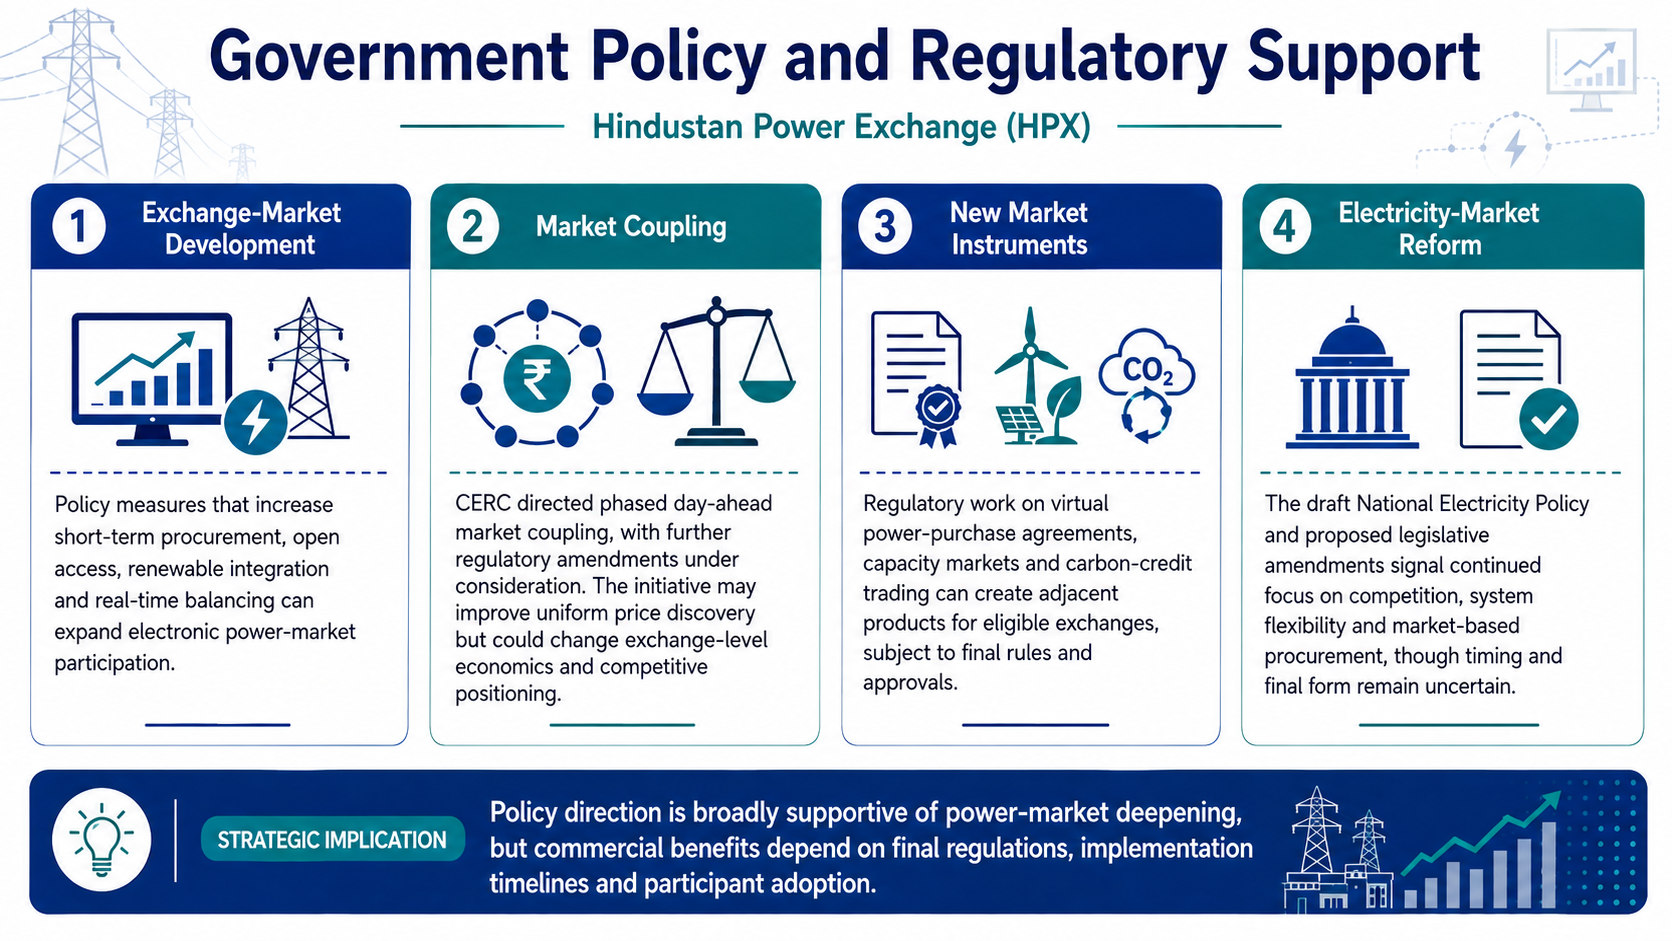
Government Policy Support
Policy measures that increase short-term procurement, open access, renewable integration and real-time balancing can expand electronic power-market participation
CERC directed phased day-ahead market coupling, with further regulatory amendments under consideration
The initiative may improve uniform price discovery but could change exchange-level economics and competitive positioning
Regulatory work on virtual power-purchase agreements, capacity markets and carbon-credit trading can create adjacent products for eligible exchanges, subject to final rules and approvals
The draft National Electricity Policy and proposed legislative amendments signal continued focus on competition, system flexibility and market-based procurement, though timing and final form remain uncertain
- Overview
- Business
- Financial Highlights
- Industry Overview
- Documentation
Get the Preqt App and keep in touch around the clock!
 Monitor your investments in real-time.
- Receive tailored deal suggestions.
- Get real-time updates and alerts.
