
Hindustan Times Ltd.
Stories That Shape India- Journalism That Connects
Unlisted Review and Rating
Avoid
DRHP Not FIledOverall Recommendation
Pass at INR 825.0 per share for now. Retain it as an asset-value opportunity for further diligence. The strongest argument for the deal is that the listed HT Media stake alone covers 90.2% of the entry valuation at its quoted market value. At that mark, the buyer is paying only INR 42.9 Cr for the remaining parent assets on a net basis. Even after applying an illustrative 25.0% haircut to the stake, the rest of the parent needs to contribute INR 141.9 Cr to cover the entry price. That is the figure to test against the parent’s separately held investments and properties.
The weakness is the return to an ordinary shareholder while waiting for those assets to be realised. FY26 parent operating EBITDA was negative INR 3.3 Cr, ROE was 2.4%, and other income represented 50.7% of total income. The Company paid INR 68.6 Cr in preference dividends against INR 0.5 Cr in ordinary dividends, leaving the ordinary-share yield at 0.1%. Reported equity also declined 19.4% in FY26, primarily due to investment fair-value movements. Combined with the indicative 9.1% exit haircut, these factors make the holding period and route to exit central to the return.
Reconsider at this price if diligence supports at least INR 626.6 Cr of realisable net asset value for ordinary shareholders, equivalent to a 30.0% entry discount to that NAV. This is an illustrative underwriting hurdle for an illiquid position. It should be supported by a current asset-by-asset reconciliation and a credible route to proceeds through an ordinary dividend, buyback, asset distribution or executable secondary exit. The 89.4% book discount warrants that diligence. The verified NAV and the timing of cash realisation should determine the investment decision.
PARAMETER
WEIGHT
SCORE
KEY FACTORS
Financial Performance
25.0%
2.0/5
FY26 PAT declined 19.1% despite higher operating revenue. The increase in expenses and the reduction in investment fair-value gains outweighed higher dividend income. Reported equity fell 19.4%, driven principally by a INR 1,041.4 Cr after-tax loss in other comprehensive income. This makes the valuation sensitive to the investment portfolio even though reported borrowings are low.
Show more
Detailed Analysis
FY26 operating revenue recovered 5.7% year on year, but FY24 to FY26 CAGR was negative 3.6%
Operating EBITDA turned negative as other expenses rose to INR 125.4 Cr from INR 81.8 Cr
PAT was 42.0% of total income. Other income accounted for 50.7% of total income, limiting what the margin says about the leasing and services business
Borrowings were 2.5% of reported equity, even after increasing 36.5% in FY26
FY26 ROE was 2.4%, down from 3.2% in FY25
CFO turned positive, aided by a INR 74.9 Cr increase in other liabilities. Operating cash flow before working-capital changes was approximately negative INR 0.2 Cr
Industry
25.0%
3.0/5
The listed subsidiary illustrates the gap between sector growth and company performance. HT Media’s FY26 consolidated operating revenue was INR 1,803.3 Cr, and it recorded a loss attributable to owners of INR 54.3 Cr. The wider media sector’s growth rate gives limited support to a premium for the parent’s media exposure
Show more
Detailed Analysis
Indian media and entertainment grew 9.0% in calendar 2025, led by digital and live experiences. Print advertising is projected to grow at approximately 2.0% CAGR through 2028
Print and commercial leasing are mature. Digital monetisation offers growth, but the group must compete for the advertising spend moving online
Publishing, broadcasting and property operations carry distinct regulatory and compliance exposures
Management
25.0%
3.0/5
The FY25 related-party figure covers the two named counterparties. The available FY26 extracts lack a complete transaction schedule for calculating an updated parent-wide percentage
Show more
Detailed Analysis
Shobhana Bhartia and the Bhartia family have longstanding operating and governance experience across the group
The parent’s FY25 report identifies committee members. Current parent board independence could not be verified from the available FY26 extracts
FY25 disclosures identify a Jaipur land-title matter and a disputed NDMC demand of INR 124.6 Cr, against which the parent had provided INR 85.0 Cr
The parent has rent, services and financing arrangements with group entities. FY25 rent and service income from HT Media and Hindustan Media Ventures alone totalled INR 12.7 Cr, or 10.1% of standalone operating revenue
Valuation Metrics
25.0%
3.0/5
The headline 3.9x P/E and 89.4% book discount warrant further diligence. The preference-dividend sensitivity of 9.8x, negative operating EBITDA and 9.1% indicative exit haircut make realisable net asset value and a credible exit central to the valuation
Show more
Detailed Analysis
P/E is not meaningful as the business remains loss making
FY26 standalone operating EBITDA was negative INR 3.3 Cr. This makes EV/EBITDA unsuitable for comparing the parent with profitable listed media peers
The deal trades at 0.1x FY26 standalone book value, an 89.4% discount to the parent’s reported equity and a 70.0% discount to listed subsidiary HT Media’s 0.4x P/B. The parent’s INR 438.7 Cr deal value is 10.9% above the INR 395.7 Cr quoted value of its HT Media stake, leaving INR 42.9 Cr to be supported by its remaining assets after liabilities, taxes and preference claims
TOTAL
100%
2.8/5
Weighted Composite Score
Per Share Price
₹849.8
As of 17 Nov 2026
Lot Size
15.0 Shares
Minimum Investment
₹12,747.0 / 15 shares
Market Cap. (₹ Cr)
Revenue FY’26
PAT FY’26
P/E Multiple
Face Value
₹ 10.0Lot Size
15.0 sharesSale Type
Secondary SalePAT FY’26
₹ -49.1 CrPAT Margin (%)
-2.6 %P/E Multiple
3.3xCAGR Growth 3Y
-3.6 %ROE (FY’26)
-3.3 %ROCE (FY’26)
5.3 %Price to Book Value ratio
0.1xDebt/Equity (FY’26)
0.4xMerchant banker appointed
❌ NoCompany Website
www.htmedia.inDisclaimer: Unlisted shares are unregulated & illiquid. This is NOT investment advice. Please do your own due diligence before investing.
Minimum Investment
₹12,747.0 / 15 sharesShares Lot 15 X 1
Investment amount
₹12,747.0
Overview
Business
Business Model
Geographical Presence
Sales Channel
Key Risk Factor
Financial Highlights
Income Statement
Revenue growth with EBITDA and PAT margins
| Financial Metric | FY 2025 | FY 2026 |
|---|---|---|
| Revenue (₹ Cr) | 1,805.6 | 1,898.8 |
| Growth (%) | 6.5% | 5.2% |
| EBITDA (₹ Cr) | -32.7 | 38.5 |
| EBITDA Margin (%) | -1.8% | 2.0% |
| PAT (₹ Cr) | 14.2 | -49.1 |
| PAT Margin (%) | 0.8% | -2.6% |
OBSERVATIONS & INSIGHTS
Revenue rose INR 110.9 Cr (6.5%) in FY25 as digital added INR 57.9 Cr and radio INR 46.7 Cr; print was flat (Calculated). FY26 rose INR 93.2 Cr (5.2%) as print gained INR 114.5 Cr on advertising and government rates, radio fell INR 64.4 Cr
EBITDA improved INR 40.1 Cr to (INR 32.7 Cr) in FY25 as revenue growth of INR 110.9 Cr outpaced cost growth of INR 70.8 Cr. FY26 rose INR 71.2 Cr to INR 38.5 Cr, revenue up INR 93.2 Cr against costs up INR 22.1 Cr
Operating margin improved 2.5 percentage points to (1.8%) in FY25 and 3.8 percentage points to 2.0% in FY26, as costs grew slower than revenue and FY26 other expenses held flat. Forfeited deposits of INR 52.6 Cr sit in revenue; excluding them FY26 margin would be negative
PAT rose INR 105.6 Cr from (INR 91.4 Cr) to INR 14.2 Cr in FY25 as PBT gained INR 155.9 Cr, less INR 50.3 Cr tax swing. FY26 fell INR 63.3 Cr to (INR 49.1 Cr) as PBT fell INR 85.3 Cr and tax eased INR 22.0 Cr
PAT margin improved 6.2 percentage points from (5.4%) to 0.8% in FY25, then fell 3.4 percentage points to (2.6%) in FY26. The margin tracked PBT: FY25 gained from lower exceptional items and higher EBITDA, FY26 lost to INR 124.4 Cr of exceptional charges
Balance Sheet
| Financial Metric | FY 2024 | FY 2025 | FY 2026 |
|---|---|---|---|
| EQUITY & LIABILITIES | ₹ 4,108.1 Cr | ₹ 1,931.7 Cr | ₹ 3,969.2 Cr |
| Net Worth | ₹ 2,056.7 Cr | ₹ 48.3 Cr | ₹ 2,009.0 Cr |
| Share Capital | ₹ 46.3 Cr | ₹ 46.3 Cr | ₹ 46.3 Cr |
| Reserves & Surplus | ₹ 2,010.4 Cr | ₹ 2.0 Cr | ₹ 1,962.7 Cr |
| Total Liabilities | ₹ 2,051.4 Cr | ₹ 1,883.4 Cr | ₹ 1,960.2 Cr |
| Current Liabilities | ₹ 1,798.4 Cr | ₹ 1,710.2 Cr | ₹ 1,816.1 Cr |
| Borrowings | ₹ 646.0 Cr | ₹ 553.5 Cr | ₹ 661.7 Cr |
| Trade Payables | ₹ 303.4 Cr | ₹ 277.7 Cr | ₹ 284.4 Cr |
| Other Current Liabilities | ₹ 849.0 Cr | ₹ 879.0 Cr | ₹ 870.0 Cr |
| Non-Current Liabilities | ₹ 253.0 Cr | ₹ 173.2 Cr | ₹ 144.1 Cr |
| Borrowings | ₹ 95.4 Cr | ₹ 25.7 Cr | ₹ 0.0 Cr |
| Other Non-Current Liabilities | ₹ 157.6 Cr | ₹ 147.5 Cr | ₹ 144.1 Cr |
| ASSETS | ₹ 4,108.1 Cr | ₹ 3,932.9 Cr | ₹ 3,969.2 Cr |
| Current Assets | ₹ 1,944.4 Cr | ₹ 2,063.6 Cr | ₹ 2,056.5 Cr |
| Trade Receivables | ₹ 381.7 Cr | ₹ 407.7 Cr | ₹ 395.5 Cr |
| Inventory | ₹ 176.0 Cr | ₹ 120.8 Cr | ₹ 104.0 Cr |
| Cash & Cash Equivalents | ₹ 81.3 Cr | ₹ 56.9 Cr | ₹ 50.5 Cr |
| Other Current Assets | ₹ 1,305.4 Cr | ₹ 1,478.2 Cr | ₹ 1,506.5 Cr |
| Non-Current Assets | ₹ 2,163.7 Cr | ₹ 1,869.3 Cr | ₹ 1,912.7 Cr |
| Fixed Assets | ₹ 974.2 Cr | ₹ 908.2 Cr | ₹ 810.3 Cr |
| Other Non-Current Assets | ₹ 1,189.5 Cr | ₹ 961.1 Cr | ₹ 1,102.4 Cr |
OBSERVATIONS & INSIGHTS
Net worth fell INR 7.2 Cr to INR 2,049.4 Cr in FY25 and INR 40.5 Cr to INR 2,009.0 Cr in FY26, equal to total comprehensive income: PAT INR 14.2 Cr less other comprehensive loss INR 21.4 Cr, then loss INR 49.1 Cr plus gains INR 8.6 Cr
Total liabilities fell INR 167.9 Cr to INR 1,883.5 Cr in FY25 on lower borrowings (down INR 162.2 Cr), then rose INR 76.7 Cr to INR 1,960.2 Cr as current borrowings rose INR 108.2 Cr. Non-current borrowings fell from INR 95.4 Cr to nil
Other current liabilities moved from INR 849.0 Cr to INR 879.0 Cr and INR 870.0 Cr. Sundry deposits rose INR 2.8 Cr then INR 26.1 Cr to INR 557.4 Cr; their nature is not explained. Other non-current liabilities rose as provisions increased INR 38.9 Cr in FY26
Fixed assets fell INR 66.0 Cr to INR 908.2 Cr in FY25 and INR 97.9 Cr to INR 810.3 Cr in FY26. FY26 intangibles fell INR 70.5 Cr and right-of-use assets INR 45.8 Cr, offset by investment property up INR 49.6 Cr
Current investments rose INR 165.4 Cr and INR 84.6 Cr to INR 1,228.4 Cr. Non-current investments fell INR 120.0 Cr then rose INR 136.6 Cr. Receivables rose INR 26.1 Cr then fell INR 12.2 Cr; inventory fell INR 55.2 Cr then INR 16.7 Cr
Cash Flow
| Financial Metric | FY 2024 | FY 2025 | FY 2026 |
|---|---|---|---|
CFO (₹ Cr) Cash generated from core business operations. | -53.2 Cr | +56.6 Cr | +99.1 Cr |
CFI (₹ Cr) Cash used for investments and long-term assets. | +141.6 Cr | +169.8 Cr | -106.0 Cr |
CFF (₹ Cr) Cash flow related to funding and borrowings. | -57.1 Cr | -252.9 Cr | +15.0 Cr |
Working Capital
| Efficiency Metric | FY 2023 | FY 2024 | FY 2025 |
|---|---|---|---|
Debtor Days Average number of days taken to collect customer payments. | - | - | - |
Creditor Days Average time taken to pay suppliers and vendors. | - | - | - |
Inventory Days Average number of days inventory remains unsold. | - | - | - |
CCC (Cash Conversion Cycle) (Debtor Days + Inventory Days - Creditor Days) | - | - | - |
Financial Ratios
Measures the company’s leverage relative to shareholder equity.
OBSERVATIONS & INSIGHTS
ROE rose 4.7 percentage points from (4.6%) to 0.1% in FY25 as owners' PAT moved from (INR 80.6 Cr) to INR 2.0 Cr on average equity of INR 1,690.2 Cr. It fell to (3.3%) in FY26 as owners lost INR 54.3 Cr on INR 1,642.9 Cr
ROCE rose from (0.0%) to 3.9% in FY25 as EBIT improved INR 89.0 Cr while average capital employed fell 3.7%. FY26 reached 5.3% as EBIT added INR 26.3 Cr. Other income of INR 169.2 Cr supports the numerator
ROA improved from (2.2%) in FY24 to 0.4% in FY25 as total PAT moved from (INR 91.4 Cr) to INR 14.2 Cr on average assets of INR 4,020.5 Cr, then fell to (1.2%) in FY26 as PAT turned to (INR 49.1 Cr) on INR 3,951.0 Cr of assets
Debt to equity moved from 0.4x to 0.3x in FY25 as gross debt fell INR 172.7 Cr (19.4%) on net repayment, then to 0.4x in FY26 as gross debt rose INR 49.5 Cr. Equity fell INR 7.2 Cr, then INR 40.4 Cr, on losses
Net debt to EBITDA is not meaningful (net cash). Interest coverage rose from (0.0x) to 1.3x and 1.9x as EBIT gained INR 89.0 Cr then INR 26.3 Cr and finance cost fell INR 10.4 Cr then INR 7.0 Cr; operating EBITDA alone covers 0.6x
The current ratio moved from 1.1x to 1.2x in FY25 as current assets rose INR 119.2 Cr, led by current investments, while current liabilities fell INR 88.2 Cr. It eased to 1.1x in FY26 as INR 108.2 Cr more borrowings became current liabilities
Industry Overview
Industry Drivers
Print Advertising Growth Concentrated in Premium and Language Formats
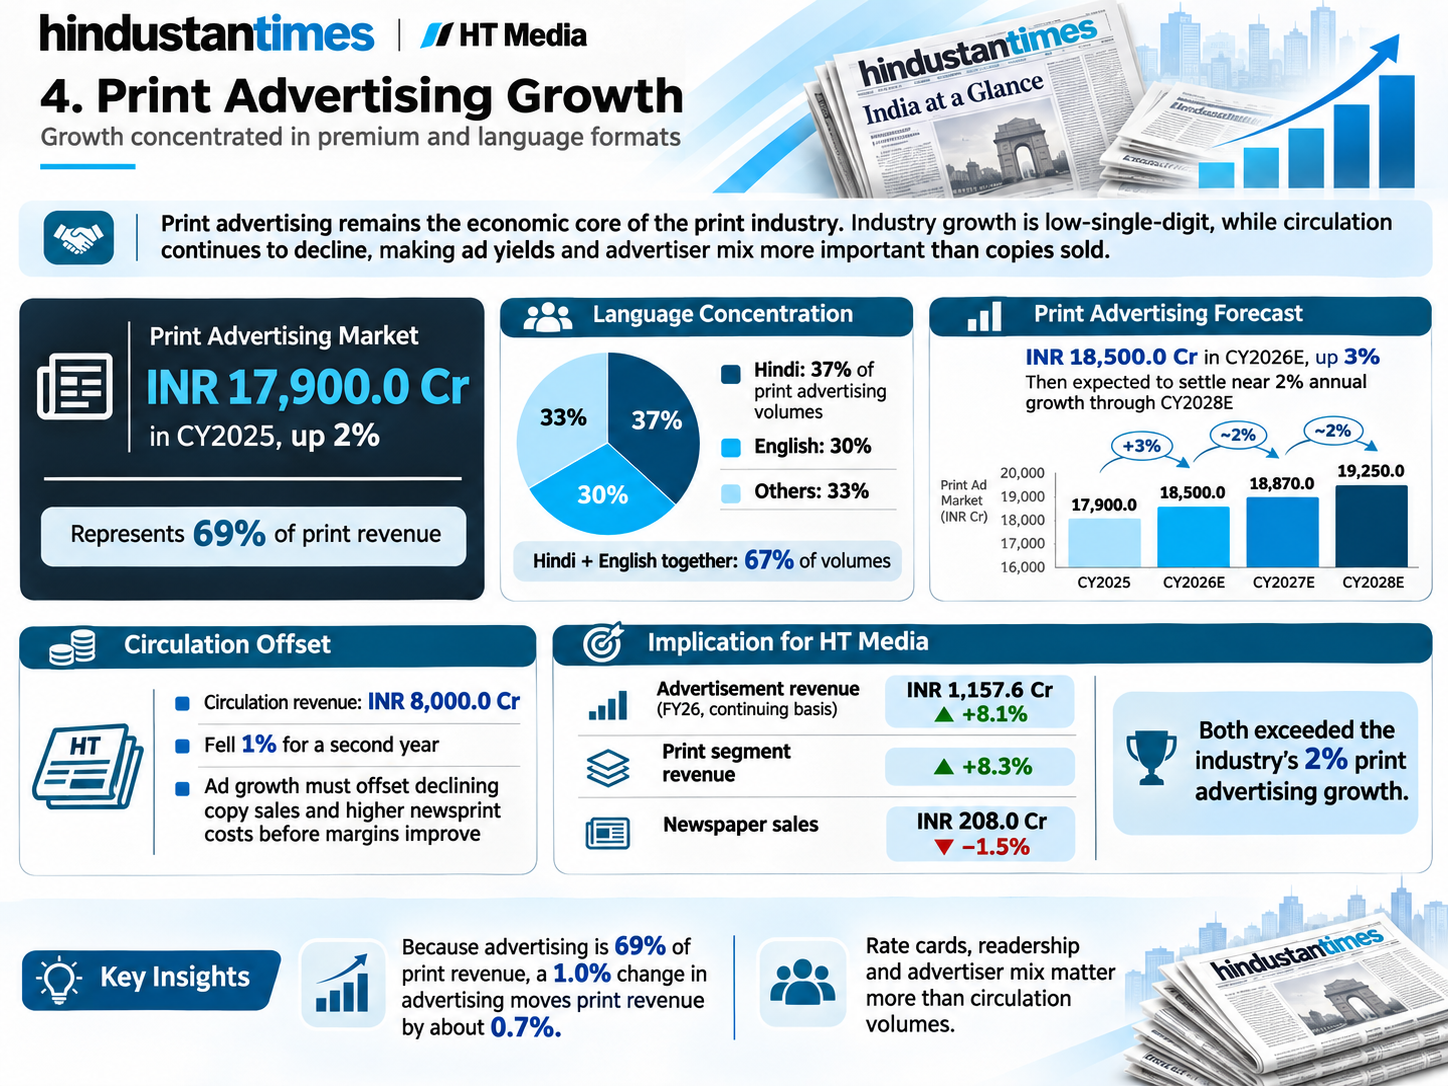
Print advertising is the economic core of the industry: INR 17,900.0 Cr in CY2025, up 2%, and 69% of print revenue, so small changes in advertiser spending move segment revenue far more than circulation does. Advertisers are shifting spend to credible, high-reach mastheads at a time when circulation revenue is declining. Hindi and English together carried 67% of print advertising volumes in CY2025, and the industry report forecasts print advertising to rise 3% in CY2026E to INR 18,500.0 Cr before settling near 2% a year.
The key drivers are:
Advertising Dependence: Because advertising is 69% of print revenue, a 1.0% change in advertising moves print revenue by about 0.7%, so yield, rate cards and advertiser mix matter more than copies sold
Language Concentration: Hindi at 37% and English at 30% of advertising volume give large-reach mastheads in both languages priority in national and metro campaigns, supporting pricing power for scaled publishers
Forecast Trajectory: Print advertising is forecast at INR 18,500.0 Cr in CY2026E (up 3%) and about 2% annual growth to CY2028E, which implies steady but low-single-digit expansion, not a recovery to earlier growth
Circulation Offset: Circulation revenue of INR 8,000.0 Cr fell 1% for a second year, so advertising growth must also cover declining copy sales and higher newsprint cost before margins improve
Non-FCT Revenue and Digital Monetisation in Radio and Media
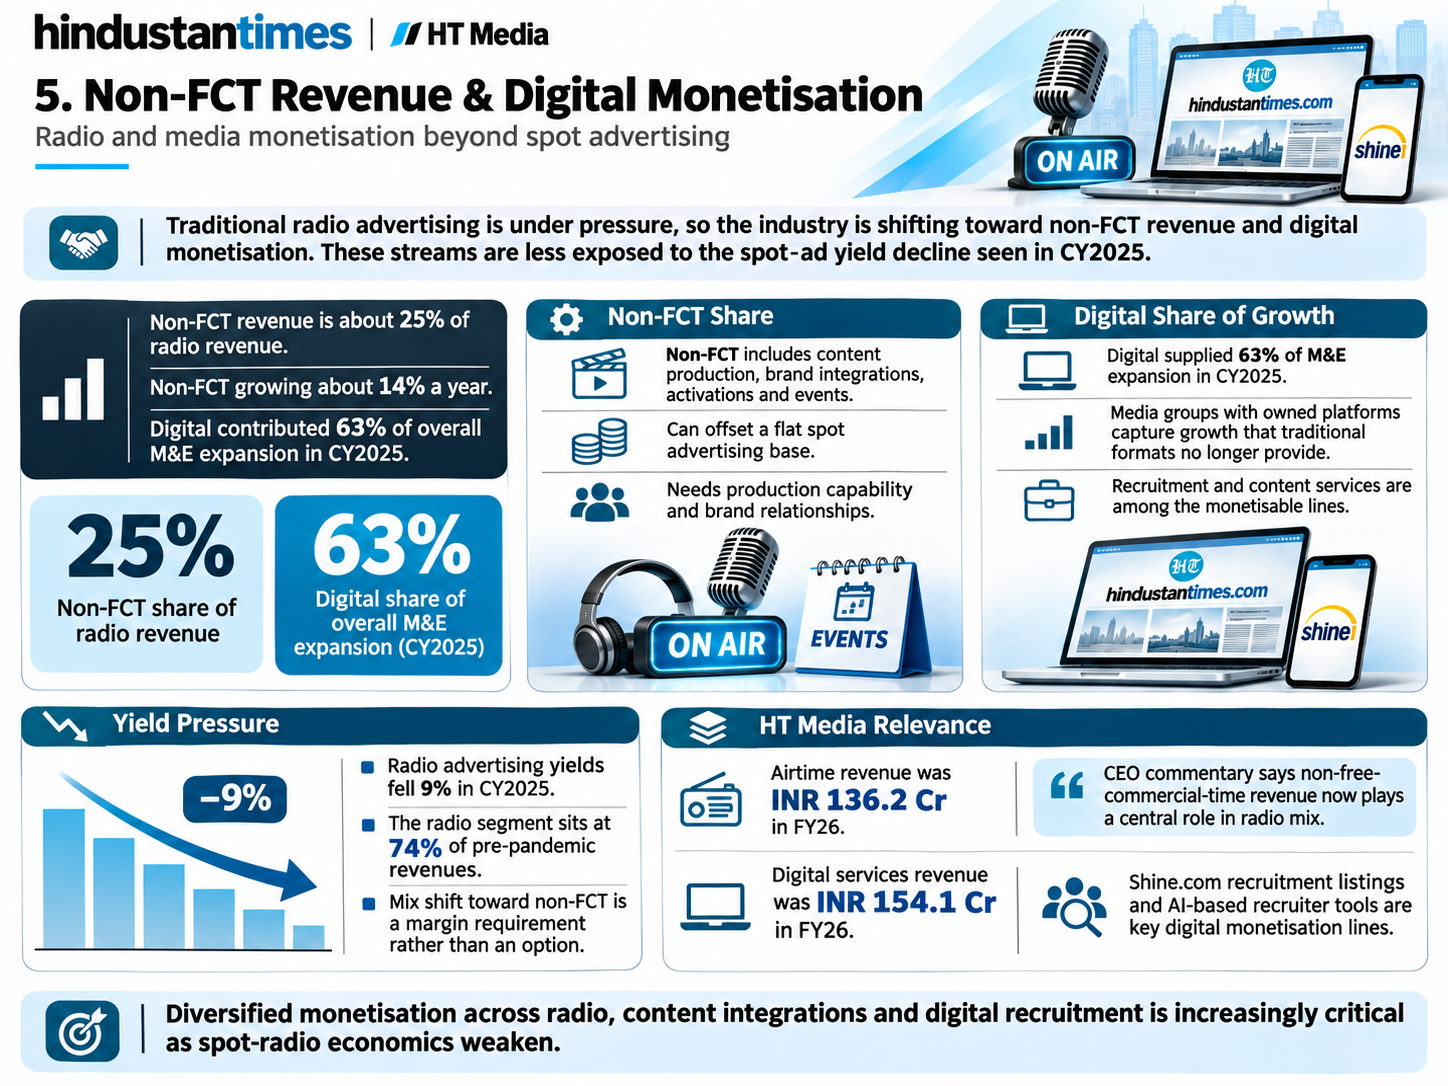
Traditional radio revenue based on advertisements in free commercial time is under pressure, so operators are shifting towards non-FCT revenue such as content production, brand integrations, activations and events. The industry report puts non-FCT at about 25% of radio revenue, growing about 14% a year, while digital contributed 63% of overall M&E expansion in CY2025. These streams are priced per project or integration, not per advertising second, and therefore are less exposed to the yield decline of 9% that hit spot advertising in CY2025.
The key drivers are:
Non-FCT Share: At about 25% of radio revenue and growing roughly 14% a year, non-FCT can offset a flat spot advertising base, but it needs production capability and brand relationships that smaller stations lack
Digital Share of Growth: Digital supplied 63% of M&E expansion in CY2025, so media groups with owned platforms capture growth that traditional formats no longer provide, with recruitment and content services among the monetisable lines
Yield Pressure: Radio advertising yields fell 9% in CY2025 and the segment sits at 74% of pre-pandemic revenue, which makes the mix shift towards non-FCT a margin requirement rather than an option
Resilient Domestic Demand and Easing Inflation
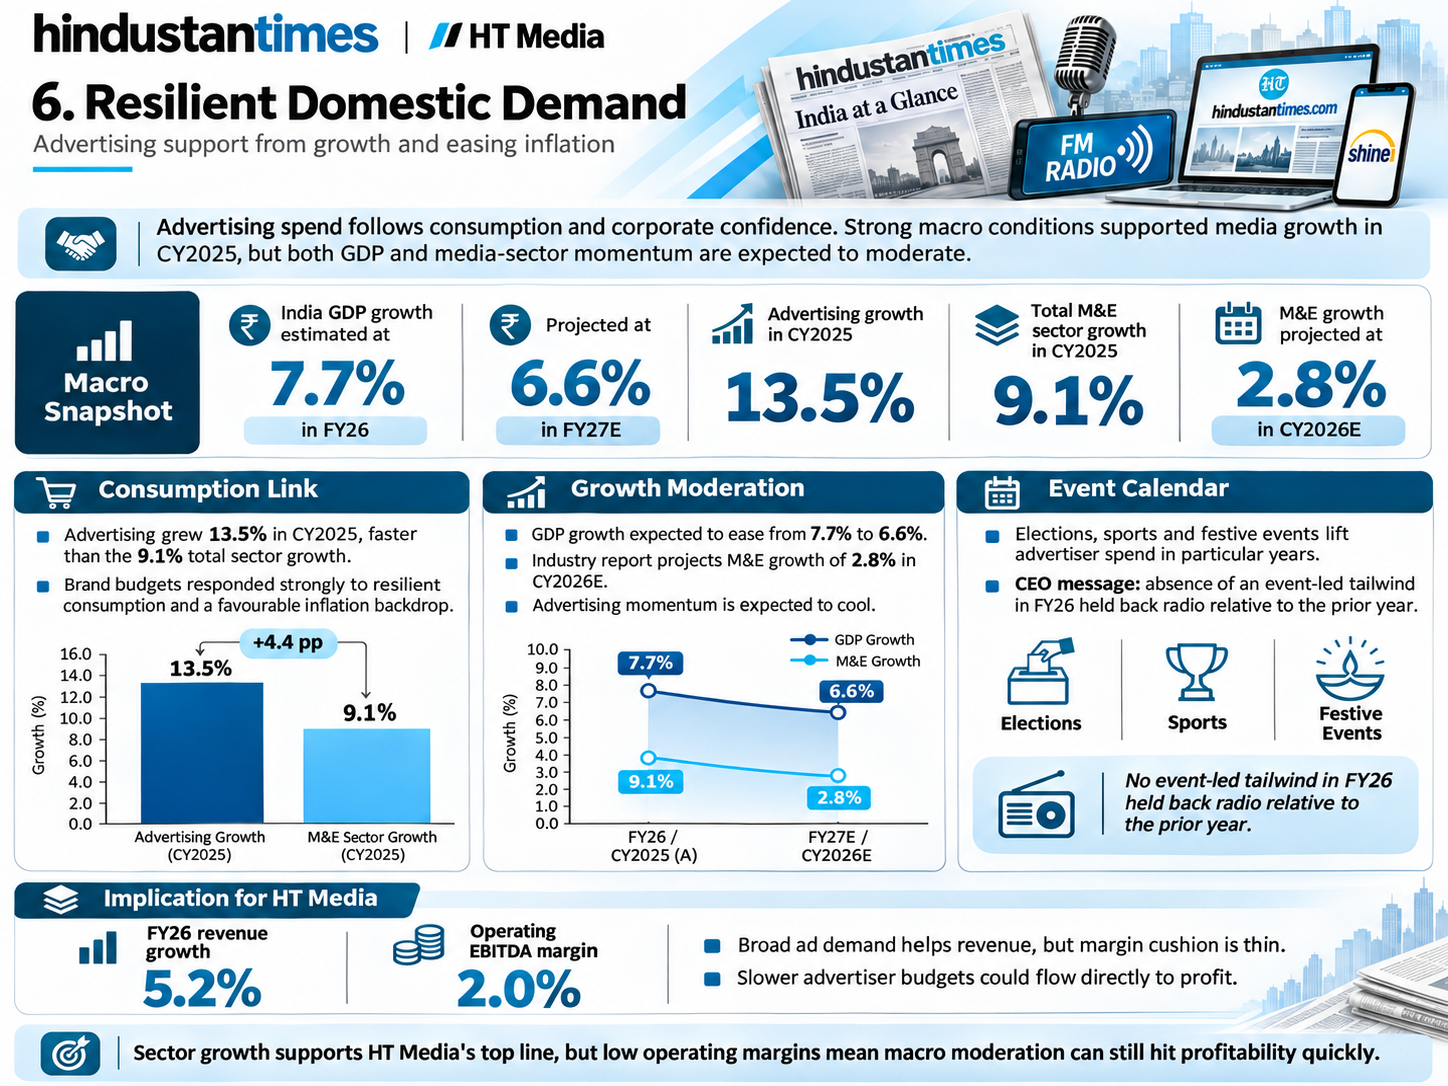
Advertising spend follows consumer demand and corporate confidence: brands raise campaign budgets when consumption and volumes grow, and cut them when demand weakens. India's GDP was estimated to have grown 7.7% in FY26 with inflation under control, and is projected at 6.6% in FY27E. The industry report attributes the 13.5% advertising growth in CY2025 partly to this backdrop. A slowdown to 6.6% would still support nominal growth, but at a slower pace than the 9.1% M&E expansion of CY2025. The relationship works in both directions, so the mechanism that lifted spending can reduce it when demand softens.
The key drivers are:
Consumption Link: Advertising grew 13.5% in CY2025, faster than the 9.1% total sector growth, showing that brand budgets responded strongly to resilient consumption and a favourable inflation backdrop, according to the industry report
Growth Moderation: GDP growth is projected to ease from 7.7% in FY26 to 6.6% in FY27E, and the industry report projects M&E growth of 2.8% in CY2026E, so advertising momentum is expected to cool'
Event Calendar: Elections, sports and festive events lift advertiser spend in particular years; the CEO message notes the absence of an event-led tailwind in FY26 held back radio relative to the prior year
Industry Risks
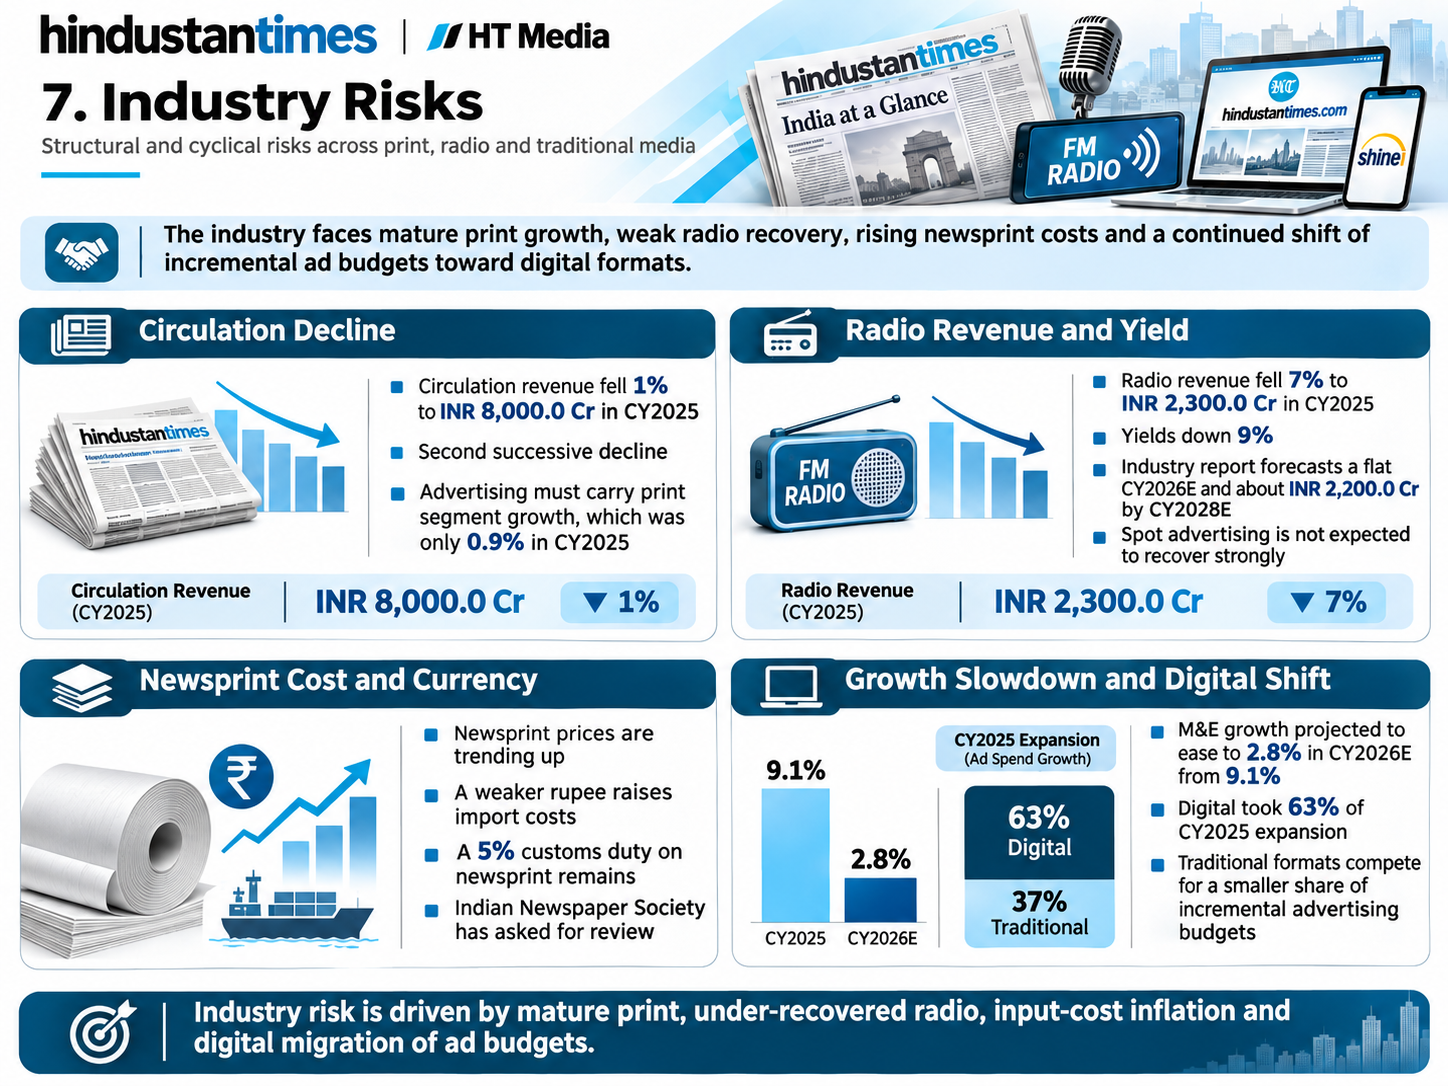
The industry faces structural and cyclical pressures that cap growth and compress margins. Print is mature, with revenue growth of 0.9% in CY2025 and forecasts of about 1% a year to CY2028E, while radio revenue is still below pre-pandemic levels. Input costs and foreign exchange affect print profitability, and regulatory changes can add costs. Together these factors make sector revenue depend on advertiser sentiment and cost control. The principal risks are as follows, each independent of any one company's performance.
The key risks are:
Circulation Decline: Circulation revenue fell 1% to INR 8,000.0 Cr in CY2025, the second successive decline, so readers are not paying more for print and advertising must carry segment growth of only 0.9% in CY2025
Radio Revenue and Yield: Radio revenue fell 7% to INR 2,300.0 Cr in CY2025 with yields down 9%, and the industry report forecasts a flat CY2026E and about INR 2,200.0 Cr by CY2028E, so spot advertising is not expected to recover
Newsprint Cost and Currency: Newsprint prices are trending up and a weaker rupee raises import costs, which are largely outside publishers' control; a 5% customs duty on newsprint remains and the Indian Newspaper Society has asked for its review
Growth Slowdown and Digital Shift: The industry report projects M&E growth easing to 2.8% in CY2026E from 9.1%, while digital took 63% of CY2025 expansion, so traditional formats compete for a smaller share of incremental advertising budgets
Government Policy Support
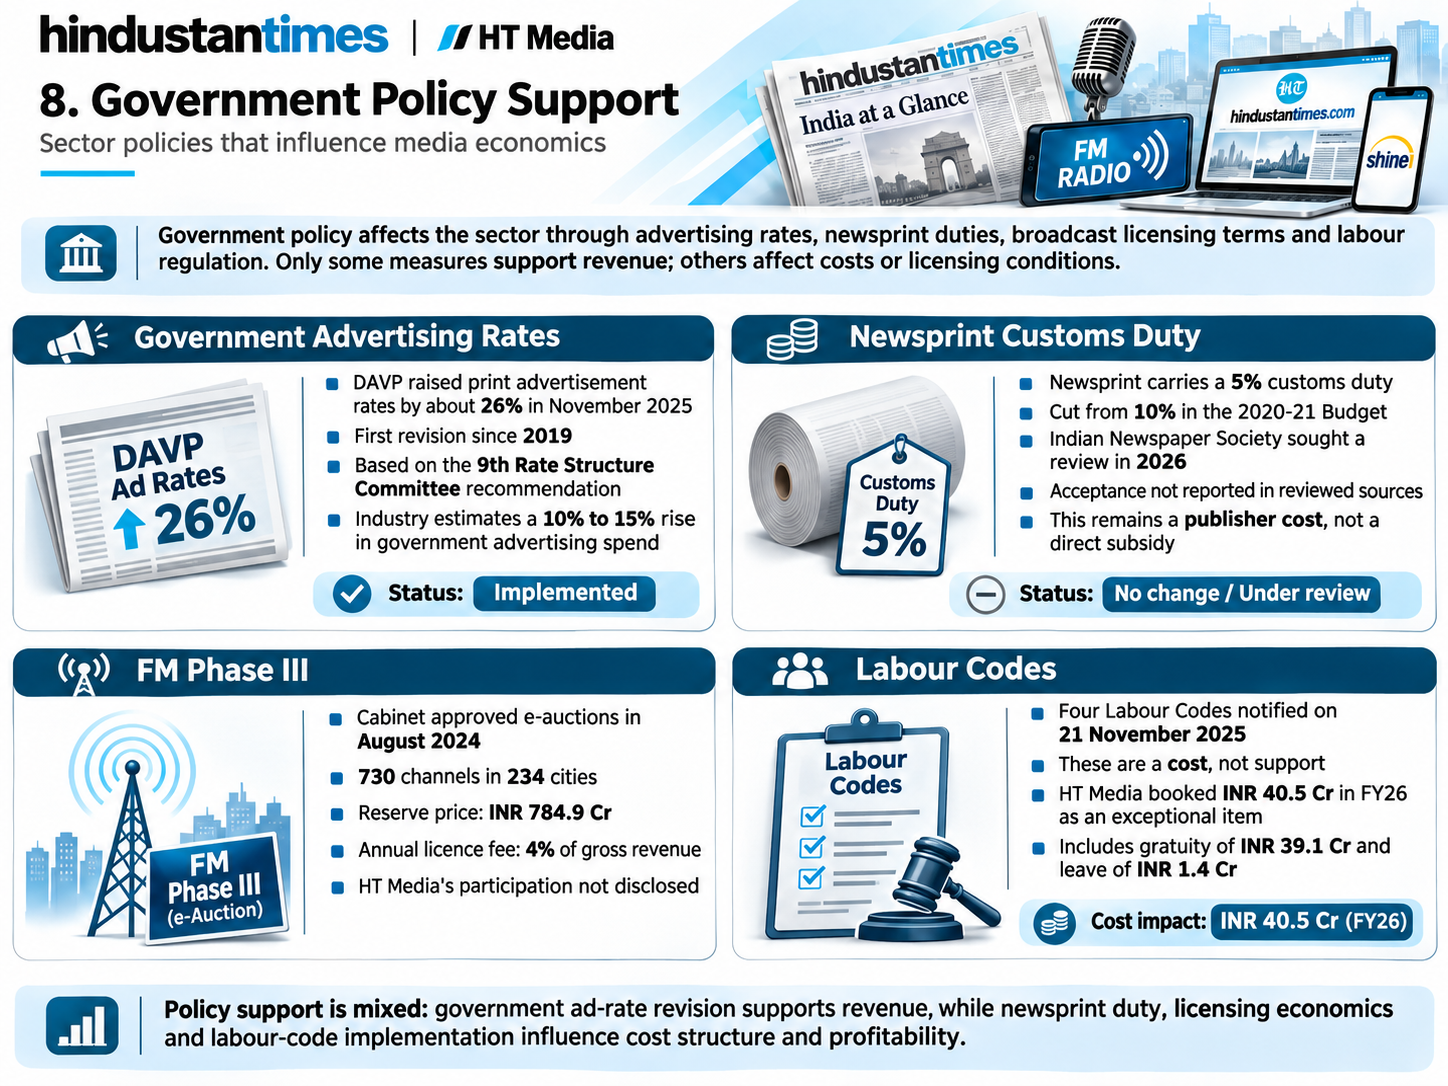
Government policy affects the sector through its own advertising spend, import duties on newsprint, broadcast licensing terms and labour regulation. Only one of the recent measures directly raises revenue: the revision of print advertising rates for government advertisements, approved in November 2025. Others set costs or the licensing framework. The measures below are listed by status, and none has been evidenced as a specific benefit received by HT Media beyond the Chairperson's reference to the rate revision. Sector-wide support is separated from company-level benefit, and announced proposals are distinguished from implemented schemes, with eligibility and mechanism stated for each measure.
The key policies are:
Government Advertising Rates: DAVP raised print advertisement rates about 26% in November 2025, the first revision since 2019, on the 9th Rate Structure Committee recommendation. Industry estimates a 10% to 15% rise in government advertising spend
Newsprint Customs Duty: Newsprint carries a 5% customs duty, cut from 10% in the 2020-21 Budget. The Indian Newspaper Society sought a review in 2026; acceptance is not reported in the sources reviewed. It remains a publisher cost
FM Phase III: The Cabinet approved e-auctions in August 2024 for 730 channels in 234 cities, reserve price INR 784.9 Cr, with a 4% annual licence fee on gross revenue. HT Media's participation is not disclosed
Labour Codes: The four Labour Codes were notified on 21 November 2025 and are a cost, not support: HT Media booked INR 40.5 Cr (gratuity INR 39.1 Cr, leave INR 1.4 Cr) as an exceptional item in FY26
- Overview
- Business
- Financial Highlights
- Industry Overview
- Documentation
Get the Preqt App and keep in touch around the clock!
 Monitor your investments in real-time.
- Receive tailored deal suggestions.
- Get real-time updates and alerts.