


House of Kieraya Ltd ( Furlenco)
Furniture Made FlexibleSmarter Homes, Flexible Living
Unlisted Review and Rating
Speculative
DRHP Not FiledOverall Recommendation
House of Kieraya has delivered a substantial operating turnaround, supported by rapid revenue growth, strong reported EBITDA margin and positive cash generation. However, FY26 PAT and ROE are materially enhanced by the deferred-tax benefit, borrowings increased significantly, and the valuation of 37.0x earnings and 8.4x book value leaves limited room for execution setbacks. Investment consideration would become more attractive at a lower valuation or after another year of tax-normalised profitability and consistent cash generation.
PARAMETER
WEIGHT
SCORE
KEY FACTORS
Financial Performance
25.0%
5.0/5
The Company delivered a substantial operating turnaround, supported by rapid revenue growth, strong EBITDA margins and positive operating cash flow. However, FY26 PAT includes a ₹26.17 crore deferred-tax benefit, representing approximately 44% of reported profit. After normalising taxation, PAT margin falls to approximately 6.7%, ROE declines to approximately 14.3%
Show more
Detailed Analysis
Revenue increased from INR 139.5 crore in FY24 to INR 370.4 crore in FY26, representing a strong two-year CAGR of 62.9%
FY26 EBITDA of INR 134.5 crore produced a strong margin of 36.3%, demonstrating substantial operating leverage after achieving scale
Reported PAT of INR 59.5 crore represented a 16.1% margin, although it was materially enhanced by a deferred-tax benefit
Total borrowings and lease liabilities were approximately INR 321.7 crore, producing a moderate debt-to-equity ratio of 1.2x
Reported ROE was approximately 34.1% on average equity, but the deferred-tax benefit significantly inflated this return
Industry
25.0%
3.0/5
The industry benefits from urbanisation, workforce mobility and increasing consumer preference for flexible, asset-light consumption. However, the model remains operationally intensive because furniture must be procured, delivered, maintained, refurbished and redeployed. Logistics costs, customer churn, asset utilisation and competitive pricing can materially affect profitability and capital efficiency.
Show more
Detailed Analysis
India’s online furniture-rental and leasing segment is estimated to grow at approximately 12%, supporting continued market expansion
The sector faces moderate regulatory risk through consumer-protection, e-commerce, taxation, leasing and data-privacy requirements
The Company remains primarily dependent on domestic demand and reported no material foreign-exchange earnings during FY26
Management
25.0%
3.0/5
The founder has meaningful operating experience and has overseen the Company’s transition from heavy losses to reported profitability. The Board includes two independent directors, but independent representation remains limited. Governance visibility would improve with complete quantification of related-party transactions and explicit disclosure regarding promoter-share pledging
Show more
Detailed Analysis
Founder Ajith Mohan Karimpana has approximately 14 years of experience building and operating the Furlenco platform
Two of six directors were independent, representing approximately 33.3% of the Board and meeting the lower scoring threshold
No material litigation was reported, but the reviewed disclosures did not explicitly confirm the promoter-share pledge position
Transactions were described as arm’s-length, but several amounts involving related entities and promoter-linked instruments were not quantified
Valuation Metrics
25.0%
2.0/5
The valuation is demanding relative to the stated industry benchmark, particularly at 37.04x earnings and 8.37x book value. The approximately 18.4x EV/EBITDA multiple is more moderate but cannot be reliably benchmarked because there is no closely comparable listed furniture-rental company. The headline P/E also appears more attractive than the normalised multiple because FY26 PAT includes the deferred-tax benefit
Show more
Detailed Analysis
The attached P/E of 37x represents a 270% premium to the stated industry benchmark of 10x
The implied EV/EBITDA is approximately 18.4x, but no directly comparable listed furniture-rental peer is available
The attached P/B multiple of 8.4x represents a substantial premium to the Company’s reported book value
TOTAL
100%
3.3/5
Weighted Composite Score
Per Share Price
₹325.0
As of 14 Oct 2026
Lot Size
500.0 Shares
Minimum Investment
₹1,62,500.0 / 500 shares
Market Cap. (₹ Cr)
Revenue FY’26
PAT FY’26
P/E Multiple
Face Value
₹ 1.0Offer Price
₹ 260.0Lot Size
500.0 sharesSale Type
Secondary SalePAT FY’26
₹ 59.5 CrPAT Margin (%)
16.0 %P/E Multiple
37.0xCAGR Growth 2Y
62.9 %ROE (FY’26)
34.1 %ROCE (FY’26)
21.9 %Price to Book Value ratio
8.4xDebt/Equity (FY’26)
1.2xMerchant banker appointed
❌ NoCompany Website
www.furlenco.comDisclaimer: Unlisted shares are unregulated & illiquid. This is NOT investment advice. Please do your own due diligence before investing.
Minimum Investment
₹1,62,500.0 / 500 sharesShares Lot 500 X 1
Investment amount
₹1,62,500.0
Overview
Business
Business Model
Geographical Presence
Sales Channel
Key Risk Factor
Financial Highlights
Income Statement
Revenue growth with EBITDA and PAT margins
| Financial Metric | FY 2025 | FY 2026 |
|---|---|---|
| Revenue (₹ Cr) | 228.7 | 370.4 |
| Growth (%) | 63.9% | 62.0% |
| EBITDA (₹ Cr) | 66.4 | 134.5 |
| EBITDA Margin (%) | 29.0% | 36.3% |
| PAT (₹ Cr) | 3.1 | 59.5 |
| PAT Margin (%) | 1.4% | 16.1% |
OBSERVATIONS & INSIGHTS
Revenue increased by 62.0% from ₹228.7 Cr in FY25 to ₹370.4 Cr in FY26
EBITDA more than doubled from ₹66.4 Cr to ₹134.5 Cr, while the margin expanded from 29.0% to 36.3%
PAT rose sharply from ₹3.1 Cr to ₹59.5 Cr, with the PAT margin improving from 1.4% to 16.1%
EPS increased from ₹0.4 in FY25 to ₹8.7 in FY26, reflecting the substantial improvement in profitability
Balance Sheet
| Financial Metric | FY 2025 | FY 2026 |
|---|---|---|
| EQUITY & LIABILITIES | ₹ 461.2 Cr | ₹ 710.3 Cr |
| Net Worth | ₹ 82.9 Cr | ₹ 266.2 Cr |
| Share Capital | ₹ 50.4 Cr | ₹ 50.1 Cr |
| Reserves & Surplus | ₹ 32.5 Cr | ₹ 216.1 Cr |
| Total Liabilities | ₹ 378.3 Cr | ₹ 444.1 Cr |
| Current Liabilities | ₹ 267.5 Cr | ₹ 299.7 Cr |
| Borrowings | ₹ 58.7 Cr | ₹ 169.9 Cr |
| Trade Payables | ₹ 26.2 Cr | ₹ 29.4 Cr |
| Other Current Liabilities | ₹ 182.6 Cr | ₹ 100.4 Cr |
| Non-Current Liabilities | ₹ 110.8 Cr | ₹ 144.4 Cr |
| Borrowings | ₹ 91.3 Cr | ₹ 136.9 Cr |
| Other Non-Current Liabilities | ₹ 19.5 Cr | ₹ 7.5 Cr |
| ASSETS | ₹ 461.2 Cr | ₹ 710.3 Cr |
| Current Assets | ₹ 106.4 Cr | ₹ 178.1 Cr |
| Trade Receivables | ₹ 8.1 Cr | ₹ 8.9 Cr |
| Inventory | ₹ 9.8 Cr | ₹ 13.2 Cr |
| Cash & Cash Equivalents | ₹ 29.0 Cr | ₹ 67.2 Cr |
| Other Current Assets | ₹ 59.5 Cr | ₹ 88.8 Cr |
| Non-Current Assets | ₹ 354.8 Cr | ₹ 532.2 Cr |
| Fixed Assets | ₹ 345.4 Cr | ₹ 498.0 Cr |
| Other Non-Current Assets | ₹ 9.4 Cr | ₹ 34.2 Cr |
OBSERVATIONS & INSIGHTS
Net worth increased from ₹82.9 Cr in FY25 to ₹266.2 Cr in FY26, primarily driven by higher reserves and surplus
Total assets expanded by 54.0% from ₹461.2 Cr to ₹710.2 Cr, led by investment in fixed assets
Total borrowings increased from ₹150.0 Cr in FY25 to ₹306.8 Cr in FY26, reflecting greater funding requirements for expansion
Cash and cash equivalents increased from ₹29.0 Cr to ₹67.2 Cr; however, current liabilities remained substantially above current assets
Cash Flow
| Financial Metric | FY 2025 | FY 2026 |
|---|---|---|
CFO (₹ Cr) Cash generated from core business operations. | +50.8 Cr | +35.7 Cr |
CFI (₹ Cr) Cash used for investments and long-term assets. | -198.9 Cr | -233.7 Cr |
CFF (₹ Cr) Cash flow related to funding and borrowings. | +144.4 Cr | +236.2 Cr |
Working Capital
| Efficiency Metric | FY 2023 | FY 2024 | FY 2025 |
|---|---|---|---|
Debtor Days Average number of days taken to collect customer payments. | - | - | - |
Creditor Days Average time taken to pay suppliers and vendors. | - | - | - |
Inventory Days Average number of days inventory remains unsold. | - | - | - |
CCC (Cash Conversion Cycle) (Debtor Days + Inventory Days - Creditor Days) | - | - | - |
Financial Ratios
Measures the company’s leverage relative to shareholder equity.
OBSERVATIONS & INSIGHTS
Return metrics strengthened in FY26, with ROE rising from 10.8% to 34.1%, ROA from 0.8% to 10.2%, and ROCE from 18.3% to 21.9%
Debt-to-equity improved from 1.8x in FY25 to 1.2x in FY26 as the equity base expanded significantly
Interest coverage increased from 3.6x to 4.1x, indicating an improved ability to service finance costs
The current ratio improved from 0.4x to 0.6x but remained below 1.0x, indicating continued liquidity pressure
Industry Overview
Industry Drivers
Expansion of Technological Capabilities
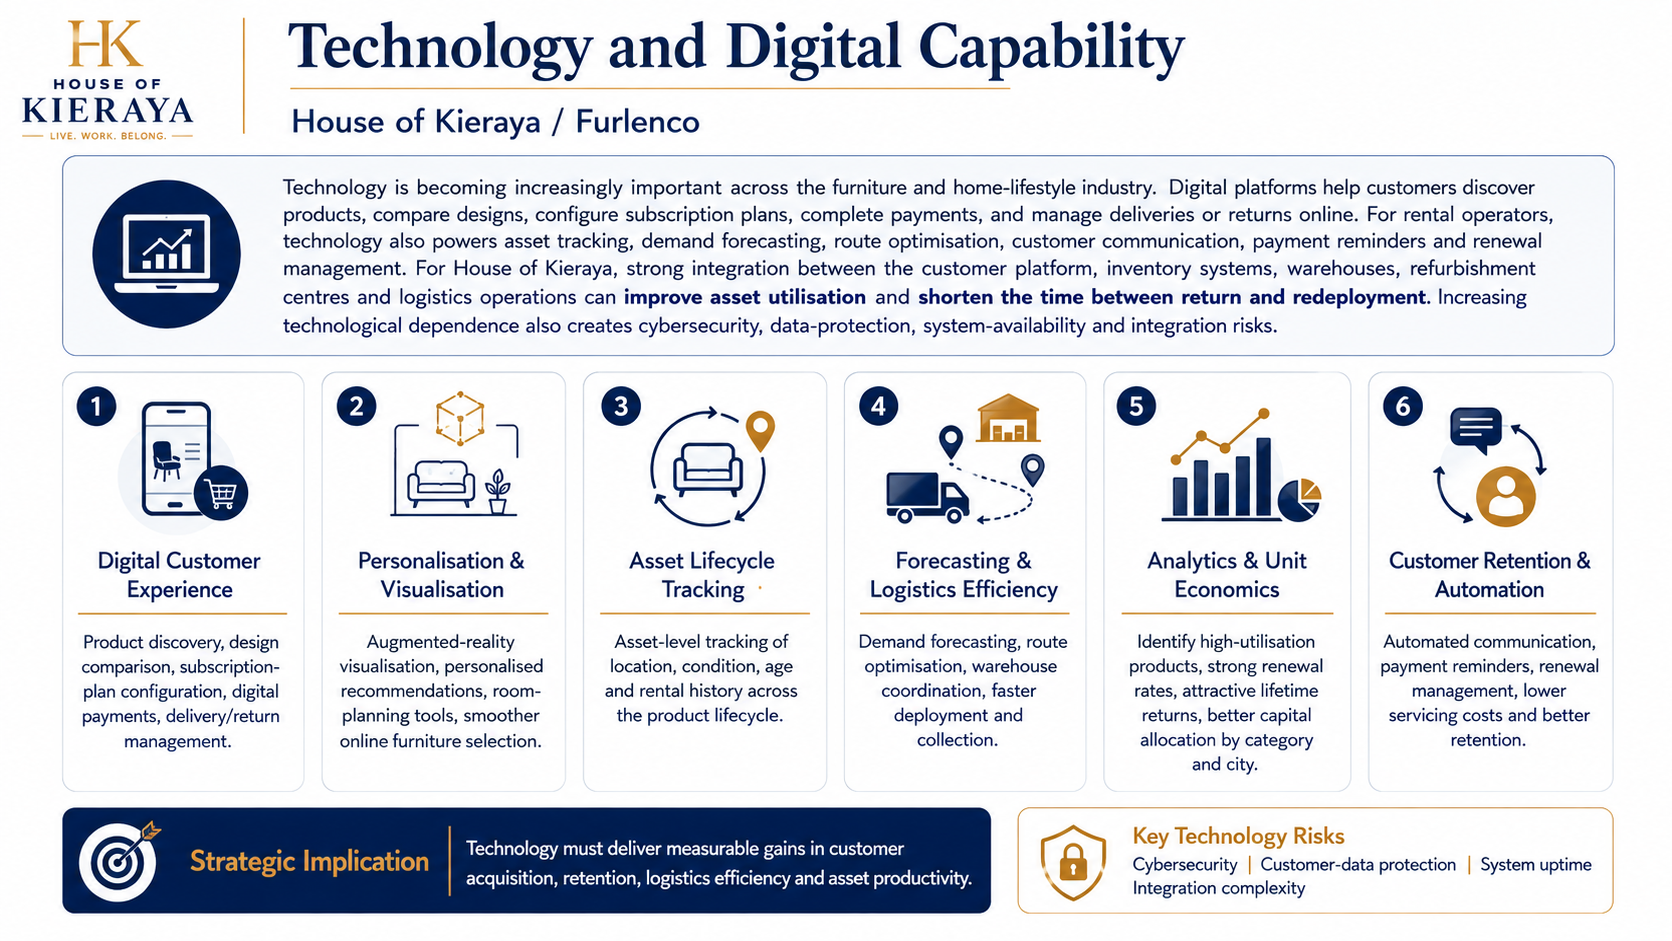
Technology is becoming increasingly important across the furniture and home-lifestyle industry. Technologies such as augmented-reality visualisation, personalised product recommendations and digital room-planning tools can also improve the online purchasing experience.
For rental operators, technology has a wider operational role. Asset-level tracking can help monitor the location, condition, age and rental history of every product.
Data analytics can further help identify products with high utilisation, strong renewal rates and attractive lifetime returns. This enables an operator to allocate capital toward categories and cities with better unit economics while reducing exposure to slow-moving inventory.
For House of Kieraya, technological capabilities are important because the Company must manage a large base of revenue-generating assets across their complete lifecycle. Effective integration between the customer platform, inventory systems, warehouses, refurbishment centres and logistics operations can improve asset utilisation and shorten the period between a product’s return and its next deployment.
Capacity Expansion
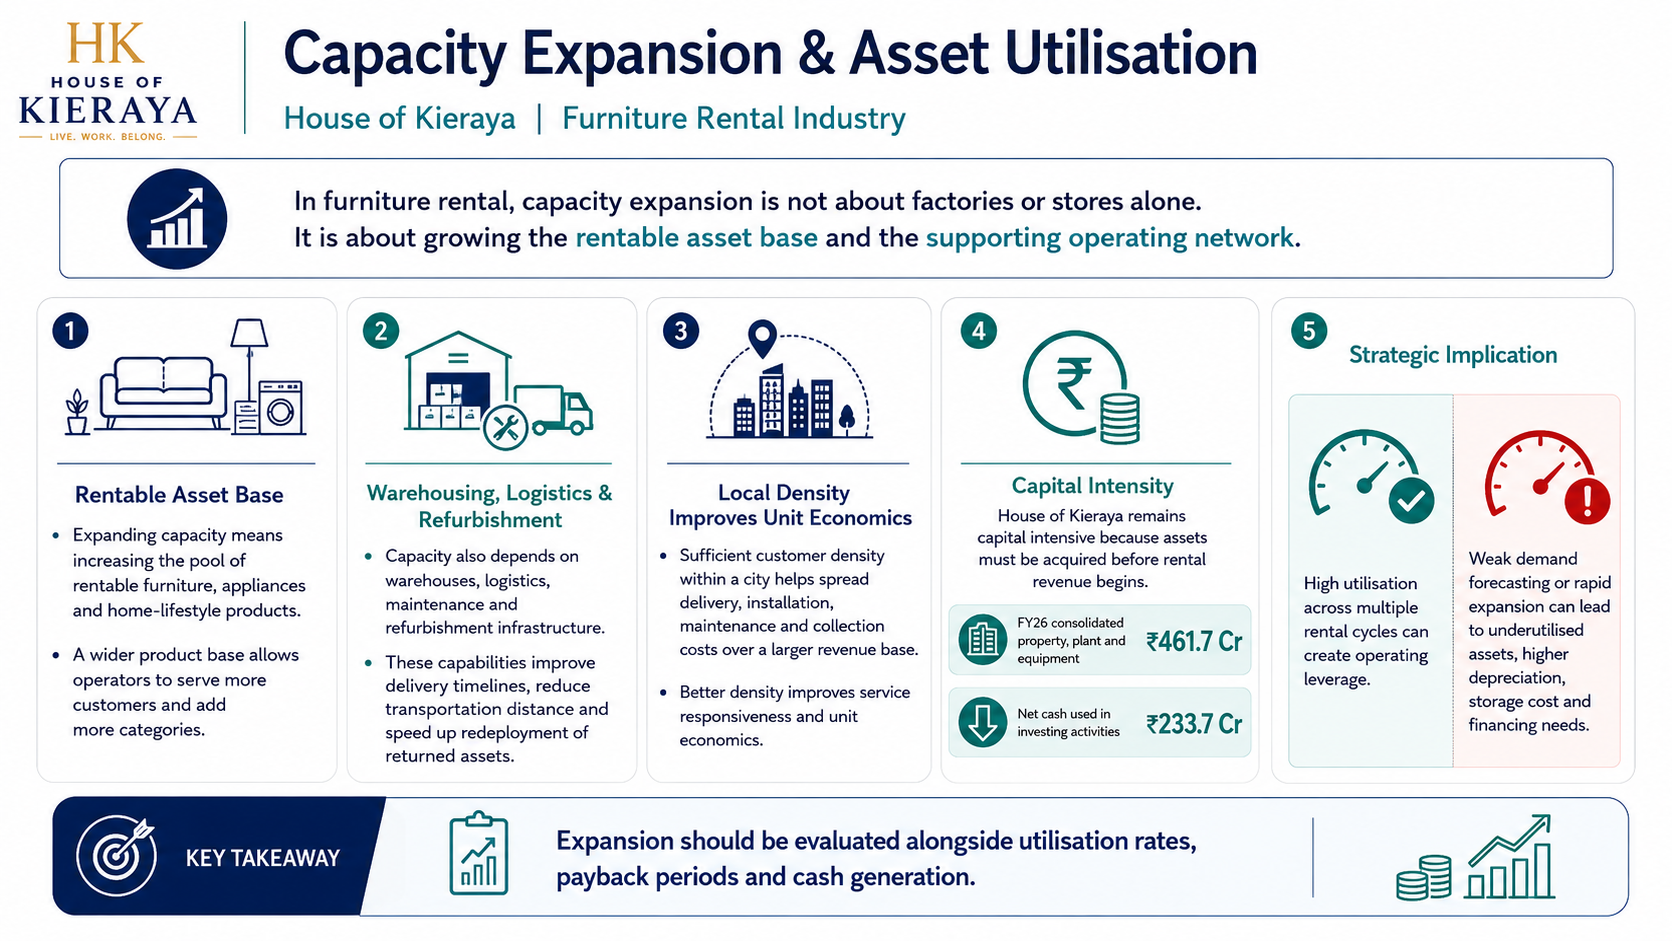
Capacity expansion in the furniture rental industry is not limited to manufacturing or store openings. It principally involves expanding the pool of rentable assets and establishing the warehousing, logistics, maintenance and refurbishment infrastructure required to deploy and redeploy those assets efficiently.
A wider product base allows operators to serve more customers and introduce additional furniture, appliance and home-lifestyle categories. At the same time, the expansion of warehouses and refurbishment centres can improve delivery timelines, reduce transportation distances and increase the speed at which returned products are made available for another rental cycle.
Local operating density is particularly important. When a company has a sufficient concentration of customers within a city, delivery, installation, maintenance and collection costs can be distributed across a larger revenue base. This can improve unit economics and customer-service responsiveness.
Industry Risks
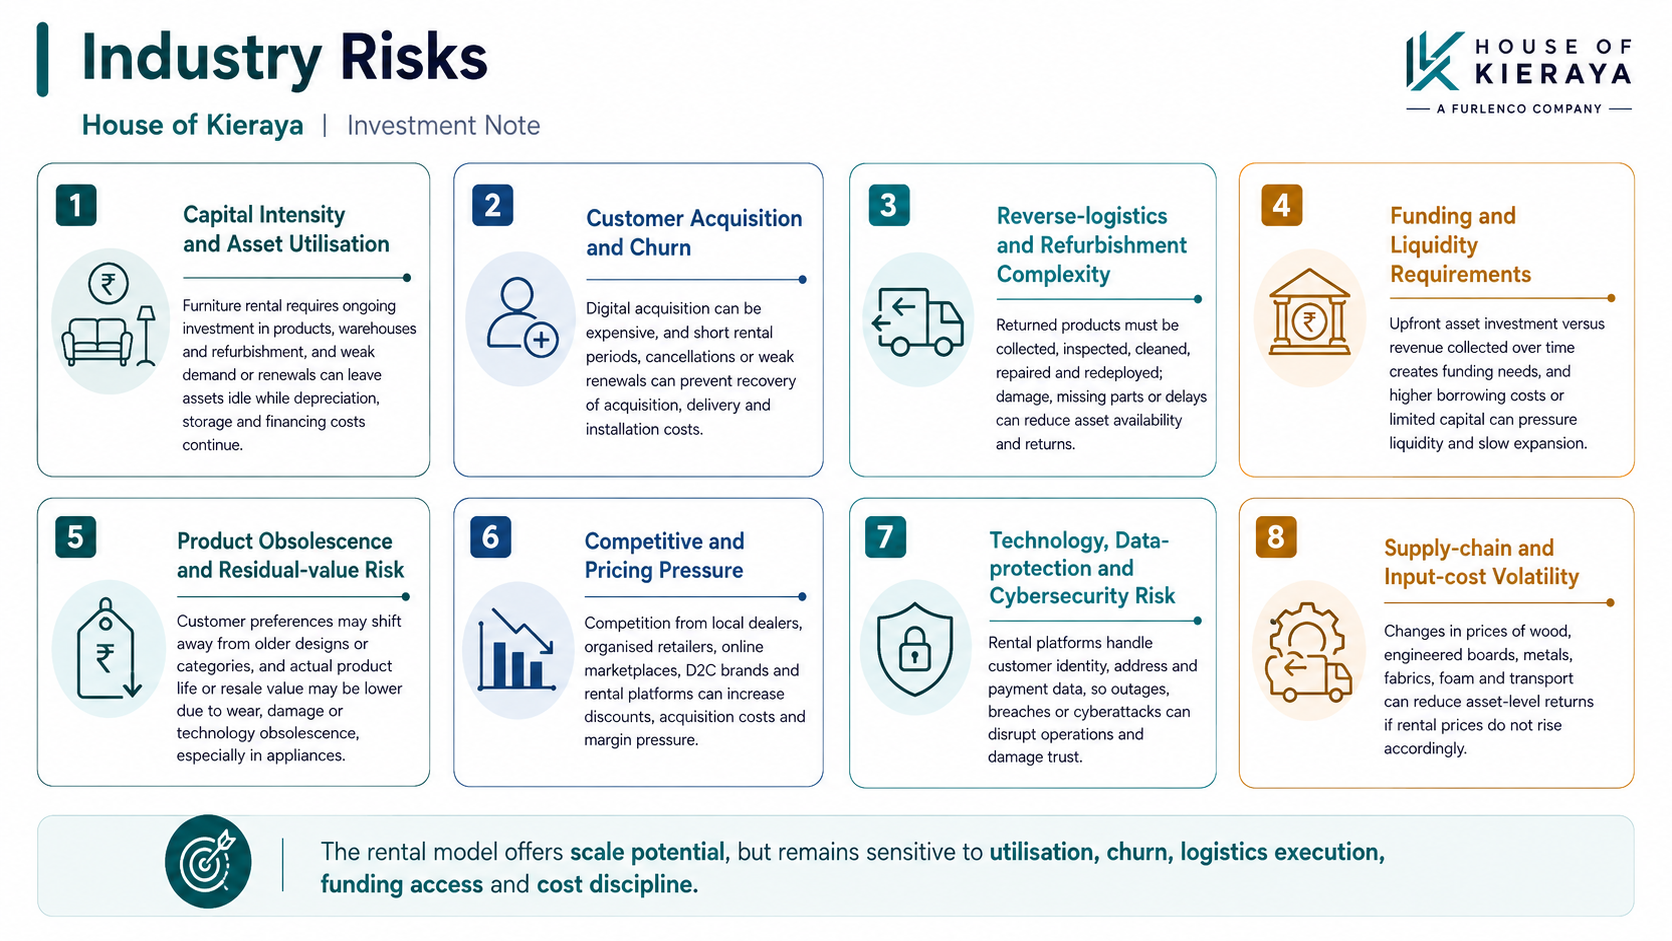
The furniture-rental business is capital-intensive and requires continuous investment in rental products, warehouses, technology and refurbishment infrastructure. If demand, renewal rates or asset utilisation remain below expectations, products may remain idle while continuing to incur depreciation, storage and financing costs.
Customer acquisition and retention are critical to achieving attractive unit economics. High digital marketing costs, short rental periods, cancellations and weak renewal rates may prevent operators from recovering customer acquisition, delivery and installation expenses. Competition from local furniture dealers, organised retailers, online marketplaces, direct-to-consumer brands and other rental platforms may further increase discounting and compress margins
The business also involves complex reverse-logistics and refurbishment operations. Returned products must be collected, inspected, cleaned, repaired and redeployed efficiently. Product damage, missing components, inconsistent refurbishment quality or extended turnaround times can reduce asset availability and lifetime returns. Changes in customer preferences and technological obsolescence, particularly for appliances, may further reduce product life and residual value
Procurement costs remain exposed to fluctuations in the prices of wood, engineered boards, metals, fabrics, foam and transportation. If rental prices cannot be increased proportionately, input-cost inflation may reduce asset-level profitability.
Rental platforms process sensitive customer identity, address and payment information, creating technology, data-protection and cybersecurity risks.
Government Policy Support
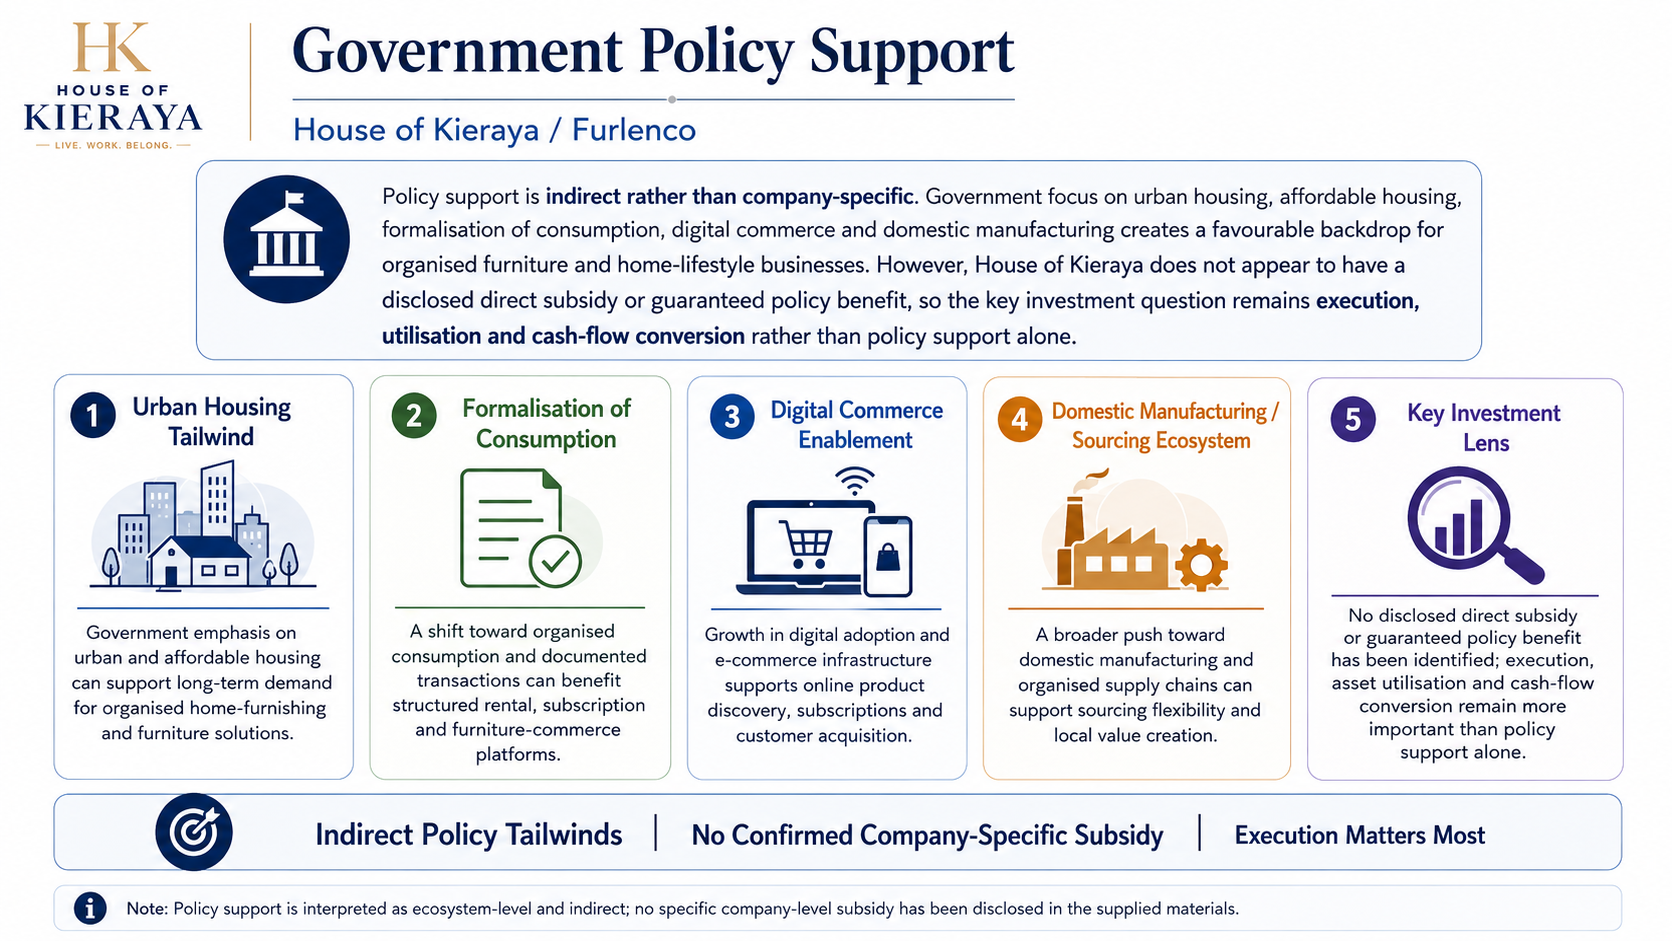
Government policy support for House of Kieraya is primarily indirect rather than company-specific. Policy initiatives promoting urban housing, affordable housing and organised rental accommodation can support demand for furniture and home-lifestyle solutions
The continued formalisation of consumption and rapid growth of digital commerce also provide a favourable operating environment for organised, technology-enabled furniture rental platforms. These trends can improve customer reach, transaction transparency and adoption of subscription-based consumption models
Government initiatives encouraging domestic manufacturing may additionally strengthen the local furniture supply chain, improve product availability and reduce dependence on imported products and components
However, the Company does not appear to receive any disclosed direct subsidy, fiscal incentive or guaranteed policy benefit. Therefore, investment performance will depend more heavily on execution, asset utilisation, customer retention and cash-flow conversion than on policy support alone
- Overview
- Business
- Financial Highlights
- Industry Overview
- Documentation
Get the Preqt App and keep in touch around the clock!
 Monitor your investments in real-time.
- Receive tailored deal suggestions.
- Get real-time updates and alerts.
