


Imagine Marketing Ltd. (boat)
Designed for everydaySound that moves
IPO Review and Rating
Risky
Overall Recommendation
Revenue remained broadly stagnant, with a (2.4)% FY23-FY25 2-year CAGR, while FY25 marked a return to profitability with INR 64.2 Cr PAT, although EBITDA and PAT margins remained low at approximately 4.1% and 2.1%. Balance-sheet leverage improved materially, with D/E at 0.09x when compulsory convertible preference shares are treated as equity, while operating cash flow remained strong at approximately INR 399.9 Cr. The core audio market has a projected 16.5% long-term CAGR, but the TWS category is increasingly mature, with annual shipment growth slowing to 1.0% in 2025; boAt nevertheless remains a leading player after holding approximately 33.0% TWS market share in 2024
PARAMETER
WEIGHT
SCORE
KEY FACTORS
Financial Performance
25.0%
2.3/5
Revenue recorded a (2.4)% 2-year CAGR
Show more
Detailed Analysis
Revenue declined from INR 3,258.4 Cr in FY23 to INR 3,062.8 Cr in FY24 and increased to INR 3,103.8 Cr in FY25, representing a FY23-FY25 2-year CAGR of (2.4)%
FY25 mechanical EBITDA was approximately INR 128.8 Cr, translating into an EBITDA margin of approximately 4.1%
FY25 PAT recovered to INR 64.2 Cr from a loss of INR (53.6) Cr in FY24, but PAT margin remained only 2.1%
FY25 D/E was 0.09x when compulsory convertible preference shares are treated as equity, versus 0.37x in FY24
CFO remained positive at approximately INR 399.9 Cr in FY25 and INR 424.4 Cr in FY24, although FY25 CFO declined approximately 5.8% YoY
Industry
25.0%
3.1/5
The core audio market carries an estimated 16.5% long-term CAGR
Show more
Detailed Analysis
India's earphones and headphones market is projected to grow at approximately 16.5% CAGR during 2024-2030, from USD 4.5 Bn in 2023 to approximately USD 14.1 Bn in 2030
India's TWS market grew 14.0% in 2024 but only 1.0% in 2025, with industry research noting a shrinking pool of first-time buyers and an increasing replacement/premiumisation cycle
boAt held approximately 33.0% of India's TWS market in 2024; Q1 FY25 competitors included GOBOULT at 17.0% and Noise at 12.0%
Electronics producers are subject to the E-Waste (Management) Rules, 2022 and EPR obligations, while boAt also had FY25 customs show-cause notices relating to classification of Bluetooth headphones/earphones
FY25 revenue outside India was only approximately INR 10.8 Cr, versus approximately INR 3,101.1 Cr segment revenue
Management
25.0%
2.5/5
Promoter operating experience stands at approximately 11+ years
Show more
Detailed Analysis
Imagine Marketing was incorporated in 2013 and boAt's founders began developing the brand in 2014, giving the promoter leadership approximately 11+ years of operating experience by FY25
FY25 Board comprised 8 Directors, including 4 Independent Directors, resulting in 50.0% independent representation
No promoter-share pledge was identified in the reviewed FY25 disclosures, but customs classification proceedings remained outstanding and the FY25 auditor highlighted an FY24 restatement
FY25 purchases from the Dixon JV, Califonix Tech and Manufacturing, alone were approximately INR 731.9 Cr, equivalent to approximately 23.6% of FY25 standalone revenue, before considering other RPTs
Valuation Metrics
25.0%
1.6/5
The Company is valued at 222.0x P/E, approximately 69.1x EV/EBITDA
Show more
Detailed Analysis
boAt is valued at 222.0x P/E, versus current P/E of 49.1x for Havells, 43.8x for Dixon and 272.6x for Amber, giving a median of 49.1x. boAt therefore trades at an approximately 351.9% premium to the selected median
Estimated EV is approximately INR 8,897.4 Cr against FY25 mechanical EBITDA of INR 128.8 Cr, giving approximately 69.1x EV/EBITDA
The valuation of the Company is 18.3x P/B
TOTAL
100%
2.4/5
Weighted Composite Score
Per Share Price
₹899.0
As of 14 Oct 2026
Lot Size
10.0 Shares
Minimum Investment
₹8,990.0 / 10 shares
Market Cap. (₹ Cr)
Revenue FY’25
PAT FY’25
P/E Multiple
Face Value
₹ 1.0Lot Size
10.0 sharesPAT FY’25
₹ 64.2 CrPAT Margin (%)
2.1 %P/E Multiple
222.0xCAGR Growth 2Y
-2.4 %ROE (FY’25)
6.4 %ROCE (FY’25)
9.1 %Price to Book Value ratio
18.4xDebt/Equity (FY’25)
0.1xMerchant banker appointed
❌ NoCompany Website
www.boat-lifestyle.comDisclaimer: Unlisted shares are unregulated & illiquid. This is NOT investment advice. Please do your own due diligence before investing.
Minimum Investment
₹8,990.0 / 10 sharesShares Lot 10 X 1
Investment amount
₹8,990.0
Overview
Business
Products
Business Model
Geographical Presence
Sales Channel
Financial Highlights
Income Statement
Revenue growth with EBITDA and PAT margins
| Financial Metric | FY 2023 | FY 2024 | FY 2025 |
|---|---|---|---|
| Revenue (₹ Cr) | 3,258.4 | 3,103.8 | 3,062.8 |
| Growth (%) | 13.5% | -4.7% | -1.3% |
| EBITDA (₹ Cr) | -50.2 | 14.0 | 128.8 |
| EBITDA Margin (%) | -1.5% | 0.5% | 4.2% |
| PAT (₹ Cr) | -101.0 | -53.6 | 64.2 |
| PAT Margin (%) | -3.1% | -1.7% | 2.1% |
OBSERVATIONS & INSIGHTS
Revenue softened from INR 3,258.4 Cr in FY23 to INR 3,103.8 Cr in FY24 and INR 3,062.8 Cr in FY25. FY25 revenue was down about 1.3% YoY, indicating that the earnings recovery came from improved economics rather than top-line expansion
EBITDA improved from approximately negative INR 50.2 Cr in FY23 to INR 14.0 Cr in FY24 and INR 128.8 Cr in FY25. EBITDA margin expanded to about 4.2%
PAT moved from losses of INR 101.0 Cr in FY23 and INR 53.6 Cr in FY24 to a profit of INR 64.2 Cr in FY25. The FY25 net profit margin improved to approximately 2.1%, but remains modest for a premium-valued consumer brand
FY22-FY25 standalone revenue CAGR is only about 2.2%. The investment case therefore requires a renewed growth phase while preserving the margin improvements achieved in FY25
Balance Sheet
| Financial Metric | FY 2023 | FY 2024 | FY 2025 |
|---|---|---|---|
| EQUITY & LIABILITIES | ₹ 2,103.5 Cr | ₹ 1,705.5 Cr | ₹ 1,660.0 Cr |
| Net Worth | ₹ 513.0 Cr | ₹ 471.6 Cr | ₹ 539.2 Cr |
| Share Capital | ₹ 9.6 Cr | ₹ 9.6 Cr | ₹ 9.6 Cr |
| Reserves & Surplus | ₹ 503.4 Cr | ₹ 462.0 Cr | ₹ 529.6 Cr |
| Total Liabilities | ₹ 1,590.5 Cr | ₹ 1,233.9 Cr | ₹ 1,120.8 Cr |
| Current Liabilities | ₹ 1,074.7 Cr | ₹ 709.1 Cr | ₹ 1,107.1 Cr |
| Borrowings | ₹ 733.0 Cr | ₹ 356.2 Cr | ₹ 595.1 Cr |
| Trade Payables | ₹ 255.8 Cr | ₹ 216.8 Cr | ₹ 367.2 Cr |
| Other Current Liabilities | ₹ 85.9 Cr | ₹ 136.1 Cr | ₹ 144.8 Cr |
| Non-Current Liabilities | ₹ 515.8 Cr | ₹ 524.8 Cr | ₹ 13.7 Cr |
| Borrowings | ₹ 503.1 Cr | ₹ 504.0 Cr | ₹ 13.7 Cr |
| Other Non-Current Liabilities | ₹ 12.7 Cr | ₹ 20.8 Cr | ₹ 0.0 Cr |
| ASSETS | ₹ 2,103.4 Cr | ₹ 1,705.4 Cr | ₹ 1,659.9 Cr |
| Current Assets | ₹ 1,657.9 Cr | ₹ 1,210.3 Cr | ₹ 1,166.3 Cr |
| Trade Receivables | ₹ 269.4 Cr | ₹ 149.7 Cr | ₹ 254.0 Cr |
| Inventory | ₹ 461.6 Cr | ₹ 429.3 Cr | ₹ 323.9 Cr |
| Cash & Cash Equivalents | ₹ 332.2 Cr | ₹ 246.8 Cr | ₹ 277.1 Cr |
| Other Current Assets | ₹ 594.7 Cr | ₹ 384.5 Cr | ₹ 311.3 Cr |
| Non-Current Assets | ₹ 445.5 Cr | ₹ 495.1 Cr | ₹ 493.6 Cr |
| Fixed Assets | ₹ 361.9 Cr | ₹ 413.9 Cr | ₹ 441.5 Cr |
| Other Non-Current Assets | ₹ 83.6 Cr | ₹ 81.2 Cr | ₹ 52.1 Cr |
OBSERVATIONS & INSIGHTS
Total assets declined from approximately INR 2,103.4 Cr in FY23 to INR 1,705.4 Cr in FY24 and INR 1,659.9 Cr in FY25, reflecting lower inventory and other working-capital assets, debt reduction and balance-sheet rationalisation
Total equity recovered to approximately INR 539.2 Cr in FY25 from INR 471.5 Cr in FY24, supported by the return to profitability. Other equity remains the dominant component of net worth
Reported borrowings reduced substantially from approximately INR 1,236.1 Cr in FY23 to INR 860.2 Cr in FY24 and INR 595.1 Cr in FY25. A large part of the remaining FY25 amount relates to compulsory convertible preference shares classified as a financial liability under Ind AS
Current assets fell to approximately INR 1,166.3 Cr in FY25, while current liabilities increased to approximately INR 1,107.1 Cr
Inventory declined to approximately INR 323.9 Cr in FY25 from INR 461.6 Cr in FY23, but trade receivables increased to approximately INR 254.0 Cr from INR 149.7 Cr in FY24
Cash Flow
| Financial Metric | FY 2023 | FY 2024 | FY 2025 |
|---|---|---|---|
CFO (₹ Cr) Cash generated from core business operations. | -7.7 Cr | +399.9 Cr | +424.4 Cr |
CFI (₹ Cr) Cash used for investments and long-term assets. | -118.2 Cr | -39.8 Cr | -106.9 Cr |
CFF (₹ Cr) Cash flow related to funding and borrowings. | +234.9 Cr | -446.1 Cr | -292.7 Cr |
Working Capital
| Efficiency Metric | FY 2023 | FY 2024 | FY 2025 |
|---|---|---|---|
Debtor Days Average number of days taken to collect customer payments. | - | - | - |
Creditor Days Average time taken to pay suppliers and vendors. | - | - | - |
Inventory Days Average number of days inventory remains unsold. | - | - | - |
CCC (Cash Conversion Cycle) (Debtor Days + Inventory Days - Creditor Days) | - | - | - |
Financial Ratios
Measures the company’s leverage relative to shareholder equity.
OBSERVATIONS & INSIGHTS
Economic leverage has reduced materially. Debt/equity, treating CCPS as equity, declined from approximately 0.72x in FY23 to 0.37x in FY24 and 0.09x in FY25
Interest coverage was not meaningful in FY23 and FY24 because EBIT was negative. It improved sharply to approximately 5.1x in FY25 as profitability recovered and finance costs declined
ROCE improved from negative 3.6% in FY23 and negative 0.6% in FY24 to 9.1% in FY25. This is a meaningful turnaround, although returns remain below the levels normally associated with a premium consumer-brand valuation
ROE, treating CCPS as equity, improved from negative 12.4% in FY23 to negative 5.4% in FY24 and positive 6.4% in FY25
ROA improved from approximately negative 5.1% in FY23 and negative 2.8% in FY24 to positive 3.8% in FY25 as PAT turned positive and the asset base contracted
Industry Overview
Industry Drivers
Expansion of Technological Capabilities
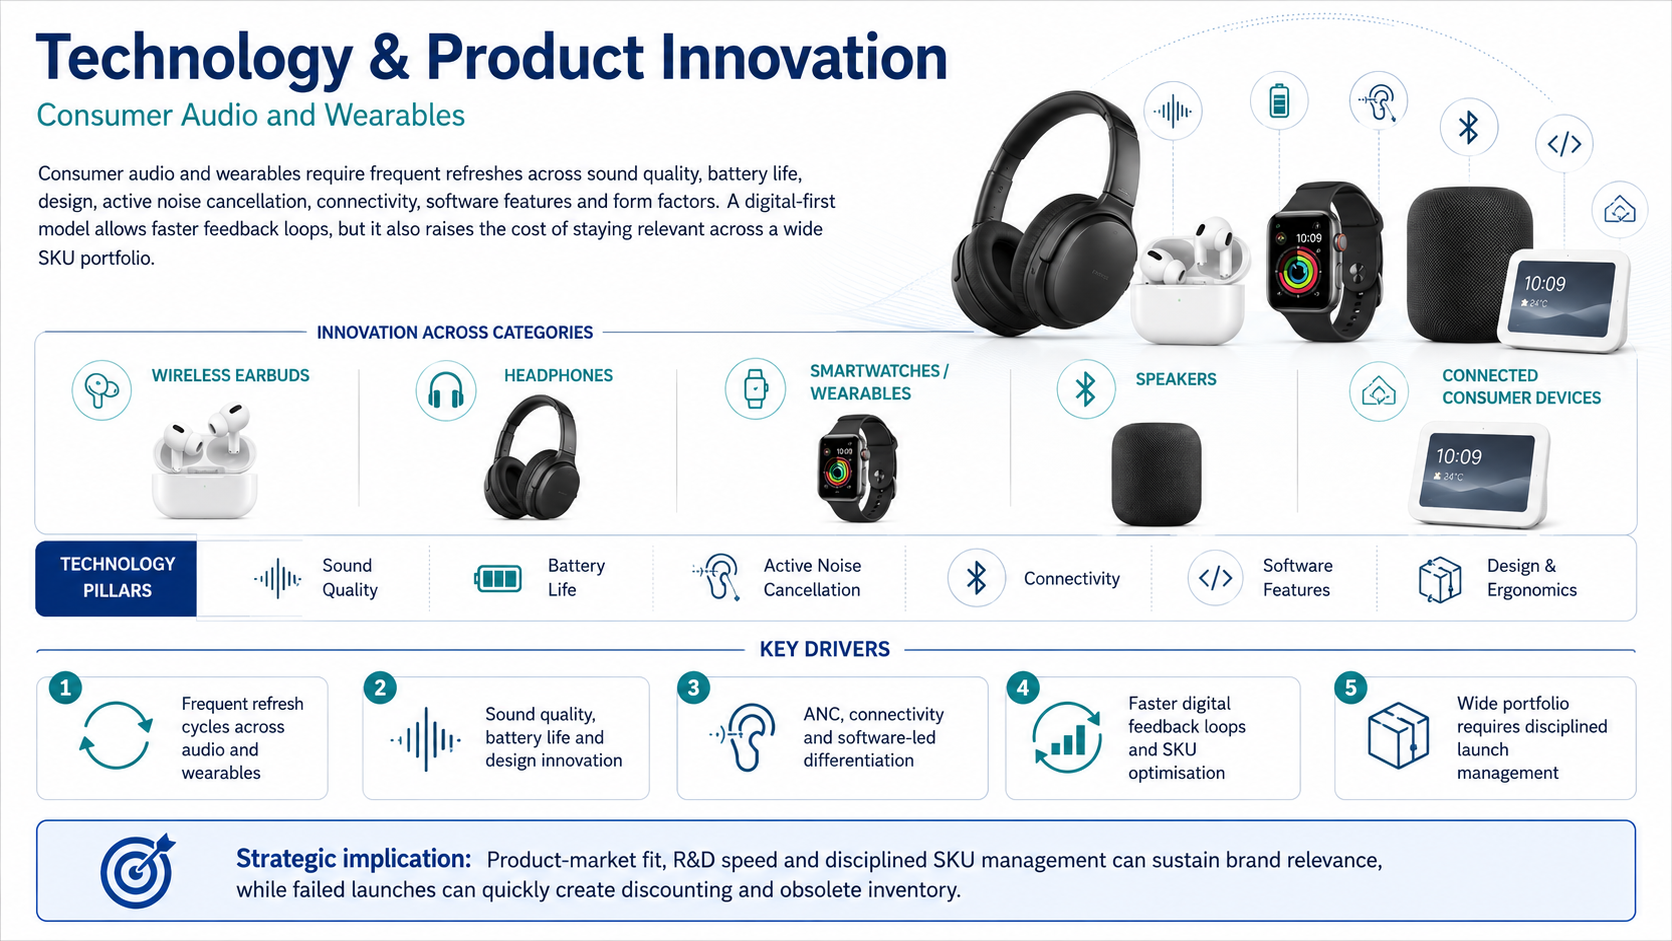
Consumer audio and wearables require frequent refreshes across sound quality, battery life, design, active noise cancellation, connectivity, software features and form factors
A digital-first model allows faster feedback loops, but it also raises the cost of staying relevant across a wide SKU portfolio
Strategic implication: product-market fit, R&D speed and disciplined SKU management can sustain brand relevance, while failed launches can quickly create discounting and obsolete inventory
Manufacturing Localisation and Supply-Chain Efficiency
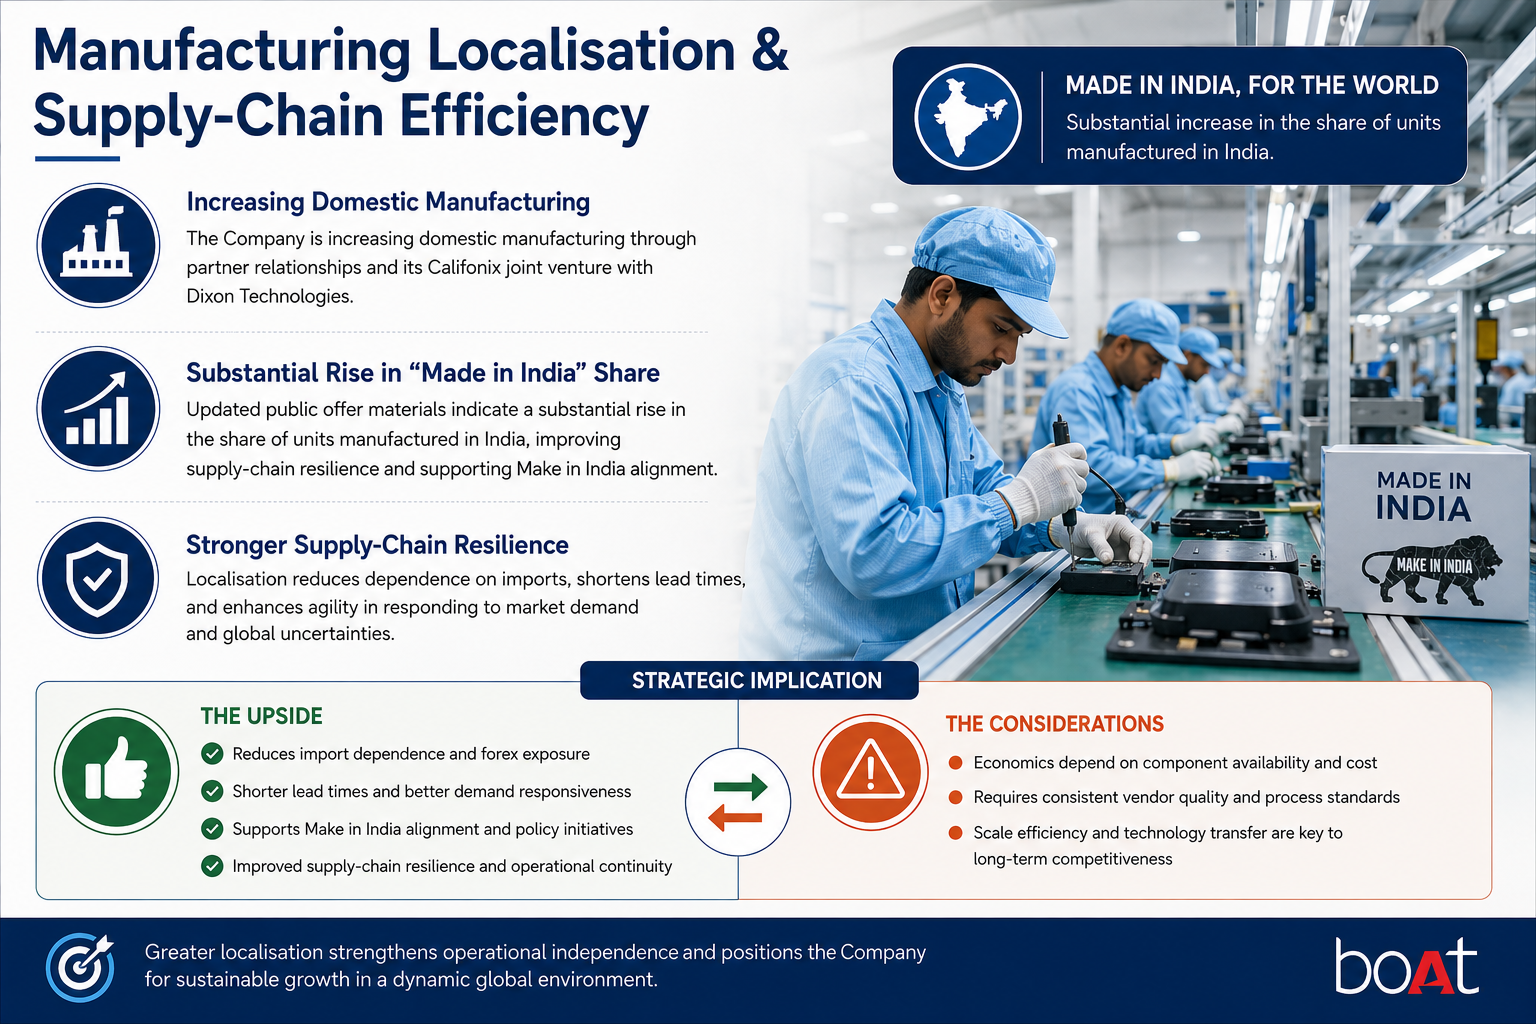
The company is increasing domestic manufacturing through partner relationships and its Califonix joint venture with Dixon Technologies
Updated public offer materials indicate a substantial rise in the share of units manufactured in India, improving supply-chain resilience and supporting Make in India alignment
Strategic implication: greater localisation can reduce import dependence and lead times, but economics still depend on component availability, vendor quality, scale efficiency and technology transfer
Omnichannel Market Penetration
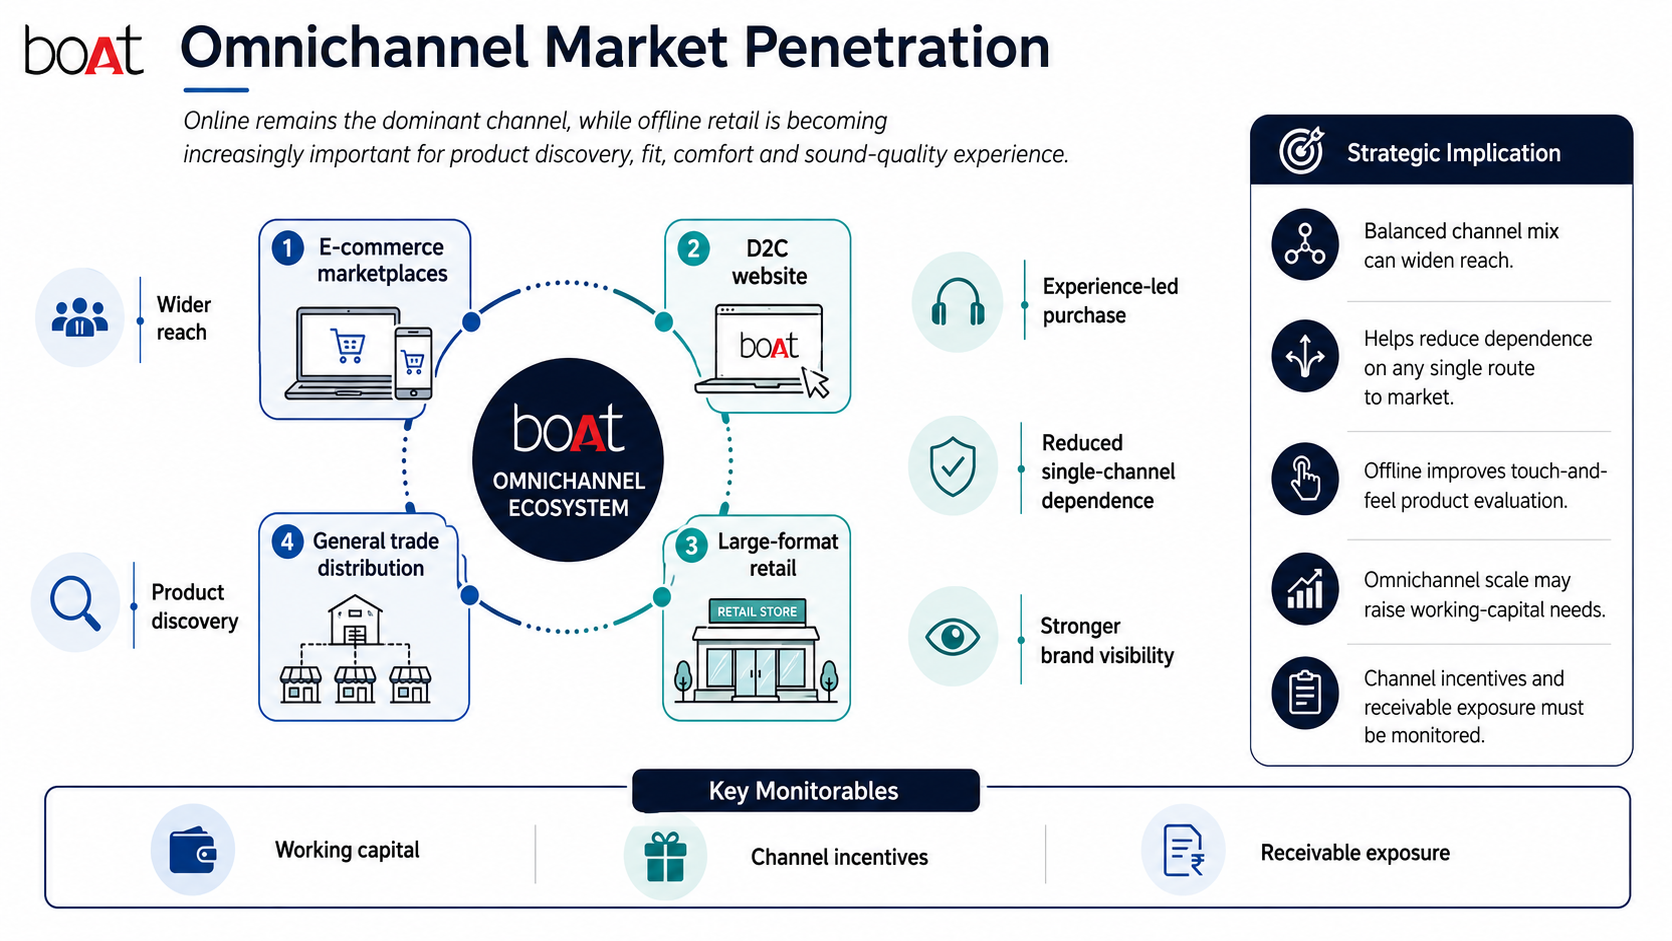
Online remains the dominant channel, while offline retail has become increasingly important for product discovery, fit, comfort and sound-quality experience
The company's distribution network now combines e-commerce, D2C, large-format retail and general-trade distribution
Strategic implication: a balanced channel mix can widen reach and reduce dependence on a single route to market, but it may also increase working-capital requirements, channel incentives and receivable exposure
Government Policy Support
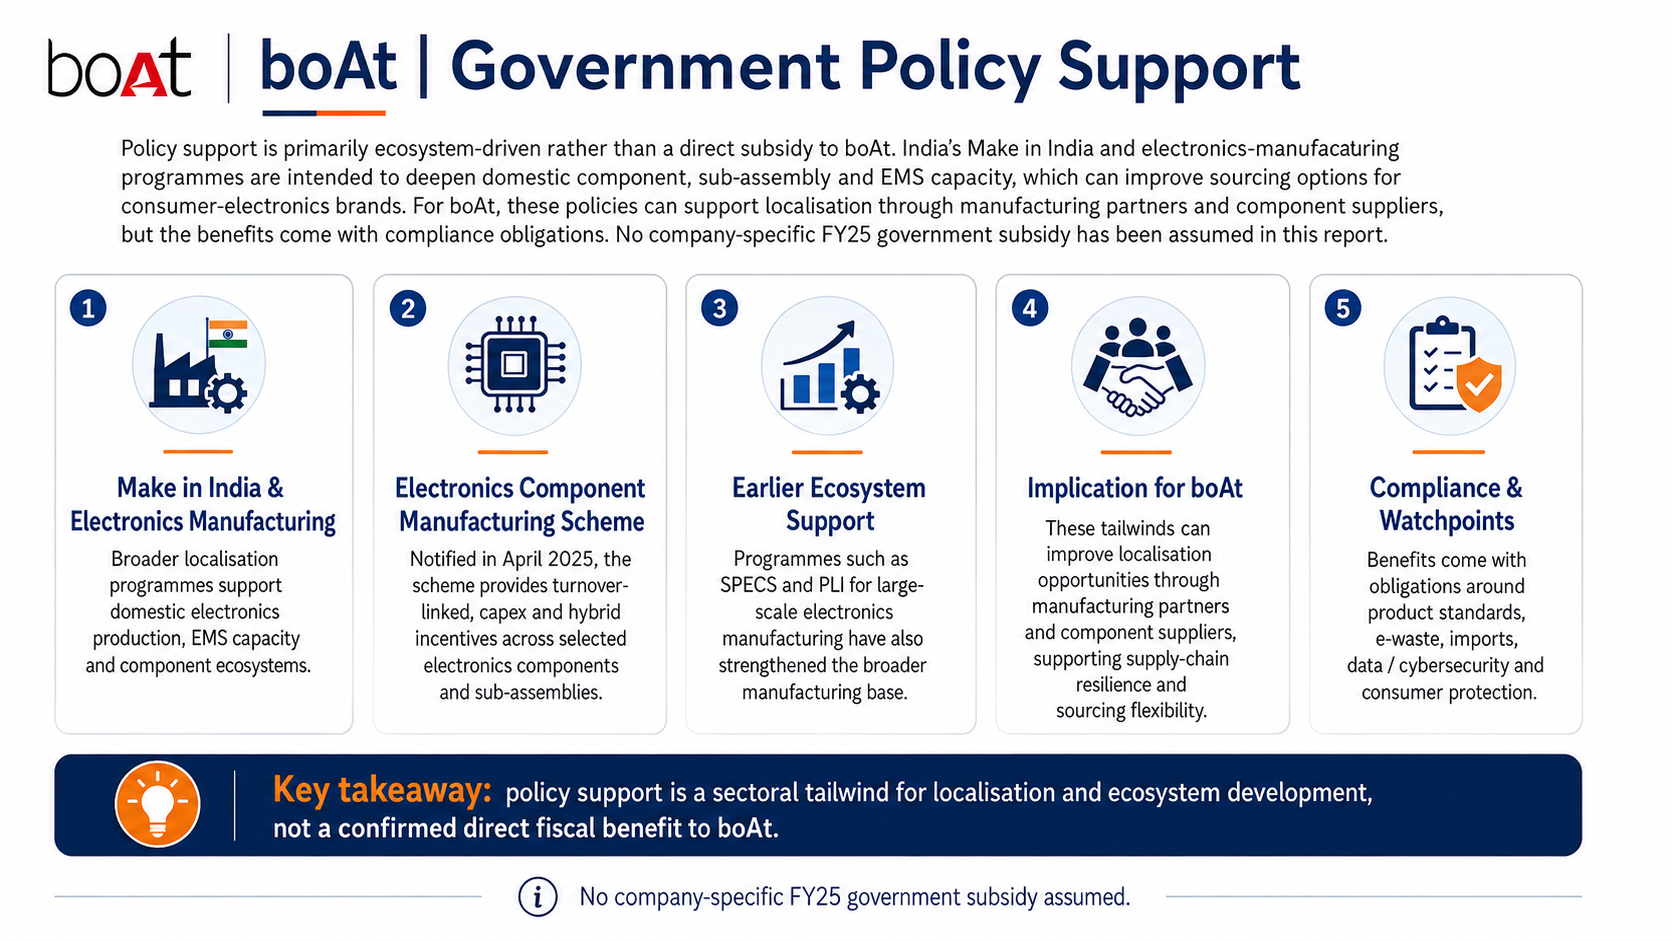
Policy support is primarily ecosystem-driven rather than a direct subsidy to boAt
India's Make in India and electronics manufacturing programmes are intended to deepen domestic component, sub-assembly and EMS capacity, which can improve sourcing options for consumer-electronics brands
The Electronics Component Manufacturing Scheme, notified in April 2025, provides turnover-linked, capex and hybrid incentives across selected electronics components and sub-assemblies
Earlier programmes such as SPECS and PLI for large-scale electronics manufacturing have also supported the broader manufacturing ecosystem
For boAt, these policies can support localisation through manufacturing partners and component suppliers, but the benefits come with compliance obligations around product standards, e-waste, imports, data / cybersecurity and consumer protection
Fundraise/Future Plans
Shareholding
Pre-issue shareholding
Promoter Holding 0.0%
Category
Pre-Issue%
Promoters
0.0%
Total Promoter Holding
0.0%
Additional Shareholders
0.0%
Total Additional Holding
0.0%
Total Shareholding
0.0%
- Overview
- Business
- Financial Highlights
- Industry Overview
- Fundraise/Future Plans
- Documentation
Get the Preqt App and keep in touch around the clock!
 Monitor your investments in real-time.
- Receive tailored deal suggestions.
- Get real-time updates and alerts.
