


Incred Holdings Ltd.
Enabling Smarter CreditCreating Long-Term Value
Unlisted Review and Rating
Speculative
DRHP ApprovedOverall Recommendation
InCred Holdings can be viewed as an interesting but relatively complex unlisted opportunity for retail investors. The underlying NBFC has demonstrated strong growth in revenue, profitability and AUM, supported by a diversified lending platform and improving scale, however, the business also carries the typical risks of an NBFC, including leverage, credit quality, funding costs and liquidity. At an unlisted valuation of around INR 10,000 Cr, the investment does not appear sufficiently inexpensive to fully offset these risks and the limited liquidity of unlisted shares. For an investor with limited experience in analysing financial institutions, it may therefore be more prudent to wait for clearer IPO visibility and public-market price discovery rather than take significant unlisted-market exposure at the current stage.
PARAMETER
WEIGHT
SCORE
KEY FACTORS
Financial Performance
25.0%
4.0/5
Revenue recorded a 47.1% 2-year CAGR, with FY25 growth of 47.2%. Mechanical EBITDA margin stood at 61.3%, PAT margin at 19.9%, D/E at 2.20x, ROE at approximately 10.4%, while OCF remained negative at INR (2,815.75) Cr.
Show more
Detailed Analysis
Consolidated revenue increased from INR 865.6 Cr in FY23 to INR 1,272.70 Cr in FY24 and INR 1,873.6 Cr in FY25, representing a 47.1% FY23-FY25 2-year CAGR; FY25 revenue increased 47.2% YoY
FY25 mechanical lender EBITDA stood at approximately INR 1,147.9 Cr, comprising PBT of INR 507.40 Cr, finance cost of INR 622.1 Cr and D&A of INR 18.3 Cr, resulting in a 61.3% mechanical EBITDA margin
PAT increased from INR 309.0 Cr in FY24 to INR 373.2 Cr in FY25, +20.7% YoY; FY25 PAT margin stood at 19.9%
FY25 debt securities and other borrowings aggregated approximately INR 8,356.5 Cr against total equity of INR 3,803.3 Cr, resulting in D/E of approximately 2.2x
FY25 PAT of INR 373.1 Cr against average FY24-FY25 equity of approximately INR 3,595.0 Cr resulted in estimated ROE of 10.4%
Consolidated OCF remained negative at INR -1,372.6 Cr in FY24 and INR -2,815.8 Cr in FY25; FY25 outflow increased approximately 105.2% YoY, largely alongside INR 3,363.8 Cr expansion in loans during the year
Industry
25.0%
3.0/5
NBFC-Retail AUM is projected to grow 18.0%-20.0% in FY27, keeping the sector in the Growth stage. Competitive intensity remains high with an estimated HHI below 1,200, regulatory risk is High, and InCred's revenue exposure remains predominantly 100% domestic.
Show more
Detailed Analysis
NBFC-Retail AUM excluding HFCs is currently estimated to grow approximately 18.0%-20.0% YoY in FY27
Retail NBFC AUM is expected to sustain 18.0%-20.0% FY27 growth, supporting classification in the Growth stage
The Group's principal operating subsidiary is an RBI-registered NBFC, making capital, provisioning, asset-quality, liquidity and conduct requirements central to operations
The Group operates in a single geographical segment, domestic India, resulting in negligible direct overseas revenue exposure
Management
25.0%
3.0/5
Leadership experience exceeds 20 years, Board independence stands at 28.6%, promoter-group holding is approximately 19.84%, recurring RPTs represent only 0.8% of revenue, while a regulatory proceeding involving security underlying INR 61.26 Cr of goodwill remains the principal governance/legal monitorable.
Show more
Detailed Analysis
Founder and CEO Bhupinder Singh has 20+ years of financial-services experience, including senior Asia-Pacific roles at Deutsche Bank before founding InCred in 2016
FY25 Board comprised 7 Directors with 2 Independent Directors, resulting in 28.6% Board independence
FY25 promoter-group holding stood at approximately 19.84% and no promoter pledge was identified in the reviewed annual-report disclosures; however, INR 61.3 Cr of goodwill is supported by an underlying land security that was attached in regulatory proceedings, which the Company is contesting
Recurring FY25 RPTs were approximately INR 14.1 Cr, including interest, fee/commission and KMP remuneration, equivalent to only 0.8% of FY25 revenue
Valuation Metrics
25.0%
4.0/5
The Company trades at 27.78x P/E, approximately 8.9% above the selected peer median of 25.5x. Therefore, InCred is not meaningfully discounted on earnings, but the premium is modest relative to its FY25 revenue growth of 47.2% and AUM growth of 39.2%
Show more
Detailed Analysis
InCred is valued at 27.78x P/E versus a selected current peer median of approximately 25.5x, representing an 8.9% premium
Estimated mechanical EV is approximately INR 17,551.3 Cr against FY25 mechanical EBITDA of INR 1,147.9 Cr, resulting in 15.3x EV/EBITDA, versus a selected peer median of approximately 25.0x, representing a 38.9% discount
InCred is valued at 2.6x P/B, based on INR 10,036.5 Cr market cap against FY25 equity of INR 3,803.3 Cr
TOTAL
100%
3.5/5
Weighted Composite Score
Per Share Price
₹153.0
As of 14 Oct 2026
Lot Size
500.0 Shares
Minimum Investment
₹76,500.0 / 500 shares
Market Cap. (₹ Cr)
Revenue FY’25
PAT FY’26
P/E Multiple
Face Value
₹ 10.0Offer Price
₹ 156.0Lot Size
500.0 sharesSale Type
Secondary SalePAT FY’26
₹ 366.3 CrPAT Margin (%)
19.6 %P/E Multiple
27.8xCAGR Growth 3Y
56.6 %ROE (FY’25)
10.4 %ROCE (FY’25)
11.0 %Price to Book Value ratio
2.6xMerchant banker appointed
❌ NoCompany Website
www.incred.comDisclaimer: Unlisted shares are unregulated & illiquid. This is NOT investment advice. Please do your own due diligence before investing.
Minimum Investment
₹76,500.0 / 500 sharesShares Lot 500 X 1
Investment amount
₹76,500.0
Overview
Business
Business Model
Geographical Presence
Sales Channel
Key Risk Factor
Financial Highlights
Income Statement
Revenue growth with EBITDA and PAT margins
| Financial Metric | FY 2023 | FY 2024 | FY 2025 |
|---|---|---|---|
| Revenue (₹ Cr) | 865.7 | 1,272.7 | 1,873.6 |
| Growth (%) | 77.4% | 47.0% | 47.2% |
| EBITDA (₹ Cr) | 226.9 | 400.9 | 695.2 |
| EBITDA Margin (%) | 26.2% | 31.5% | 37.1% |
| PAT (₹ Cr) | 109.0 | 309.0 | 373.1 |
| PAT Margin (%) | 12.6% | 24.3% | 19.9% |
OBSERVATIONS & INSIGHTS
Revenue from operations more than doubled from INR 865.7 Cr in FY23 to INR 1,873.6 Cr in FY25, with FY24 and FY25 each delivering approximately 47% growth after the FY23 post-restructuring step-up
PPOP increased from approximately INR 226.9 Cr in FY23 to INR 695.2 Cr in FY25. The pre-provision margin expanded from 26.2% to 37.1%, indicating operating leverage and stronger fee / spread economics before credit costs
PAT increased from INR 109.1 Cr in FY23 to INR 373.1 Cr in FY25. FY24 PAT growth was exceptionally strong, while FY25 growth moderated to about 20.7% as impairment expense rose to INR 187.8 Cr alongside rapid loan-book expansion
FY25 audited PAT is INR 373.1 Cr. The supplied valuation screenshot shows INR 366.3 Cr, which corresponds to total comprehensive income; this distinction is important when interpreting the displayed private-market P/E
Balance Sheet
| Financial Metric | FY 2023 | FY 2024 | FY 2025 |
|---|---|---|---|
| EQUITY & LIABILITIES | ₹ 6,678.8 Cr | ₹ 8,767.5 Cr | ₹ 12,500.5 Cr |
| Net Worth | ₹ 2,547.8 Cr | ₹ 3,386.8 Cr | ₹ 3,803.2 Cr |
| Share Capital | ₹ 595.2 Cr | ₹ 641.8 Cr | ₹ 647.5 Cr |
| Reserves & Surplus | ₹ 1,952.6 Cr | ₹ 2,745.0 Cr | ₹ 3,155.7 Cr |
| Total Liabilities | ₹ 4,131.0 Cr | ₹ 5,380.7 Cr | ₹ 8,697.3 Cr |
| Current Liabilities | ₹ 1,834.8 Cr | ₹ 2,517.8 Cr | ₹ 3,283.1 Cr |
| Borrowings | ₹ 1,675.3 Cr | ₹ 2,288.0 Cr | ₹ 3,066.9 Cr |
| Trade Payables | ₹ 0.0 Cr | ₹ 2.7 Cr | ₹ 3.2 Cr |
| Other Current Liabilities | ₹ 159.5 Cr | ₹ 227.1 Cr | ₹ 213.0 Cr |
| Non-Current Liabilities | ₹ 2,296.2 Cr | ₹ 2,862.9 Cr | ₹ 5,414.2 Cr |
| Borrowings | ₹ 2,189.0 Cr | ₹ 2,729.1 Cr | ₹ 5,291.6 Cr |
| Other Non-Current Liabilities | ₹ 107.2 Cr | ₹ 133.8 Cr | ₹ 122.6 Cr |
| ASSETS | ₹ 6,678.8 Cr | ₹ 8,767.6 Cr | ₹ 12,500.5 Cr |
| Current Assets | ₹ 2,942.9 Cr | ₹ 3,392.7 Cr | ₹ 4,930.7 Cr |
| Trade Receivables | ₹ 0.0 Cr | ₹ 0.0 Cr | ₹ 16.8 Cr |
| Inventory | ₹ 0.0 Cr | ₹ 0.0 Cr | ₹ 0.0 Cr |
| Cash & Cash Equivalents | ₹ 344.7 Cr | ₹ 85.0 Cr | ₹ 669.4 Cr |
| Other Current Assets | ₹ 2,598.2 Cr | ₹ 3,307.7 Cr | ₹ 4,244.5 Cr |
| Non-Current Assets | ₹ 3,735.9 Cr | ₹ 5,374.9 Cr | ₹ 7,569.8 Cr |
| Fixed Assets | ₹ 51.9 Cr | ₹ 56.9 Cr | ₹ 58.9 Cr |
| Other Non-Current Assets | ₹ 3,684.0 Cr | ₹ 5,318.0 Cr | ₹ 7,510.9 Cr |
OBSERVATIONS & INSIGHTS
InCred’s balance sheet has expanded sharply alongside the growth of its lending franchise. Total assets increased from INR 6,678.8 Cr in FY23 to INR 8,767.6 Cr in FY24 and further to INR 12,500.5 Cr in FY25, representing significant scale-up over two years. The expansion has been driven primarily by growth in the loan book, with net loans reaching approximately INR 10,487 Cr in FY25, compared with INR 7,259 Cr in FY24
At FY25, gross loans stood at approximately INR 10,778 Cr, of which around INR 8,006 Cr was unsecured, making credit quality and underwriting discipline important balance-sheet monitorables. The impairment allowance against loans increased to approximately INR 291 Cr from INR 190 Cr in FY24
Net worth has strengthened alongside profitability and fresh equity issuance, increasing from approximately INR 2,548 Cr in FY23 to INR 3,803 Cr in FY25. This provides a larger capital base to support lending growth, but the key monitorable remains whether future asset growth can be sustained without a disproportionate increase in leverage or deterioration in credit quality. Overall, the balance sheet reflects a rapidly scaling NBFC with improving capitalisation, but also rising dependence on external funding and continued sensitivity to asset quality and liquidity management
Cash Flow
| Financial Metric | FY 2023 | FY 2024 | FY 2025 |
|---|---|---|---|
CFO (₹ Cr) Cash generated from core business operations. | -726.0 Cr | -1,372.6 Cr | -2,815.7 Cr |
CFI (₹ Cr) Cash used for investments and long-term assets. | +393.6 Cr | -539.7 Cr | +23.1 Cr |
CFF (₹ Cr) Cash flow related to funding and borrowings. | +634.2 Cr | +1,597.4 Cr | +3,447.3 Cr |
Financial Ratios
Measures the company’s leverage relative to shareholder equity.
OBSERVATIONS & INSIGHTS
ROE improved sharply from 6.0% in FY23 to approximately 10.4% in FY24 and remained stable in FY25 despite a much larger equity and asset base
Debt/equity rose to approximately 2.20x in FY25 from 1.48x in FY24 as the Group accelerated loan growth. The level is not unusual for a lender, but the pace of increase elevates the importance of funding diversification and ALM
ROA moderated to approximately 3.5% in FY25 from 4.0% in FY24 as impairment costs normalised upward, but remained above FY23 levels
Industry Overview
Industry Drivers
Expansion of Technological Capabilities
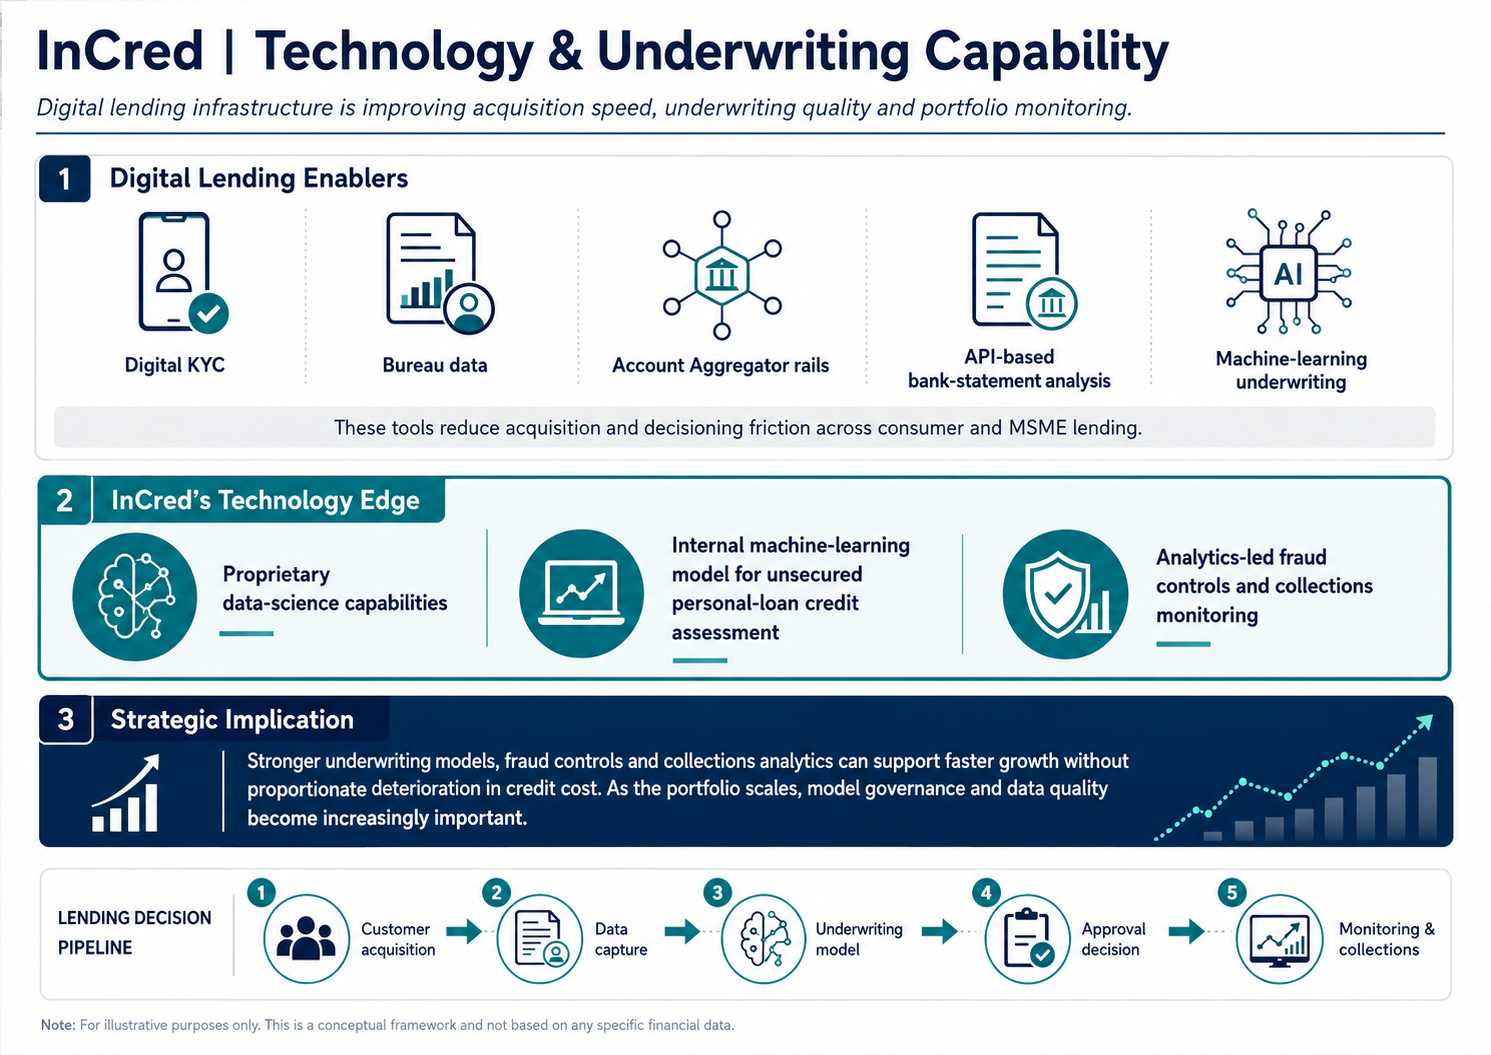
Digital KYC, bureau data, Account Aggregator rails, API-based bank-statement analysis and machine-learning underwriting are reducing acquisition and decisioning friction across consumer and MSME lending.
InCred explicitly uses proprietary data-science capabilities and an internal machine-learning model in unsecured personal-loan credit assessment
Stronger underwriting models, fraud controls and collections analytics can support faster growth without proportionate deterioration in credit cost, but model governance and data quality become more important as the portfolio scales
Capacity Expansion
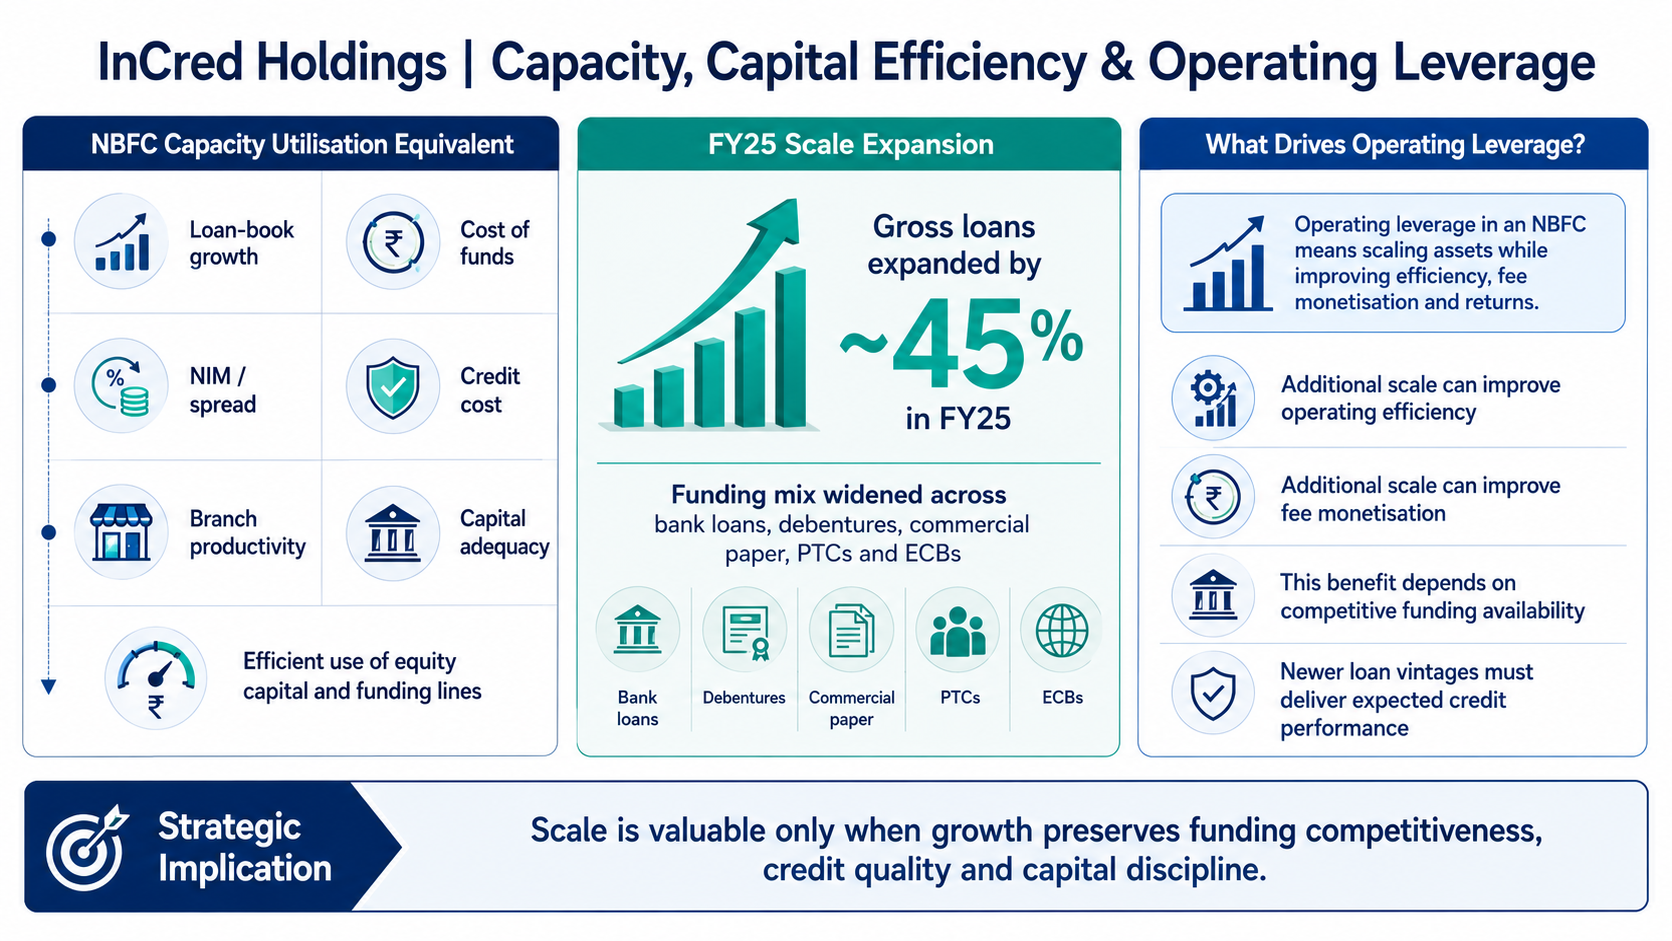
For an NBFC, the equivalent of manufacturing capacity utilisation is efficient use of equity capital and funding lines: loan-book growth, cost of funds, NIM / spread, credit cost, branch productivity and capital adequacy determine operating leverage
InCred expanded gross loans by approximately 45% in FY25 while increasing funding through bank loans, debentures, commercial paper, PTCs and ECBs
Additional scale can improve operating efficiency and fee monetisation, but only if incremental funding remains available at competitive rates and newer loan vintages deliver expected credit performance
Geographic and Premium-Market Penetration
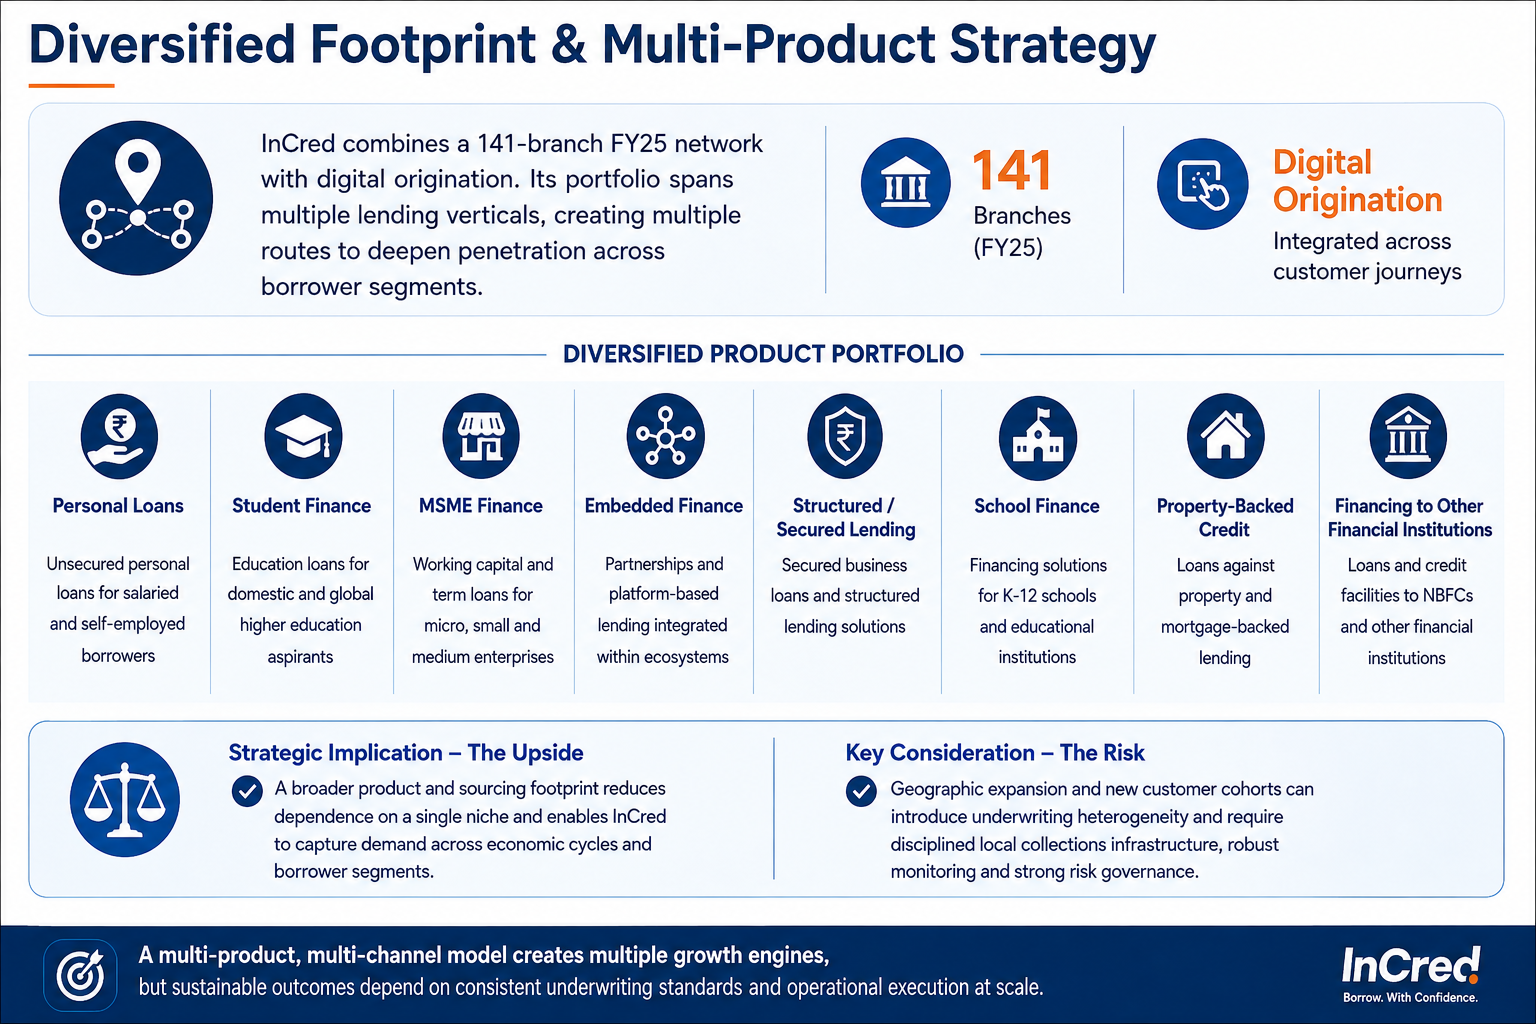
InCred combines a 141-branch FY25 network with digital origination. Its portfolio spans personal loans, student finance, MSME and embedded finance, structured / secured lending, school finance, property-backed credit and financing to other financial institutions, creating multiple routes to deepen penetration across borrower segments
A broader product and sourcing footprint reduces dependence on a single niche, but geographic expansion and new customer cohorts can introduce underwriting heterogeneity and require disciplined local collections infrastructure
Customer Relationship and Revenue Depth
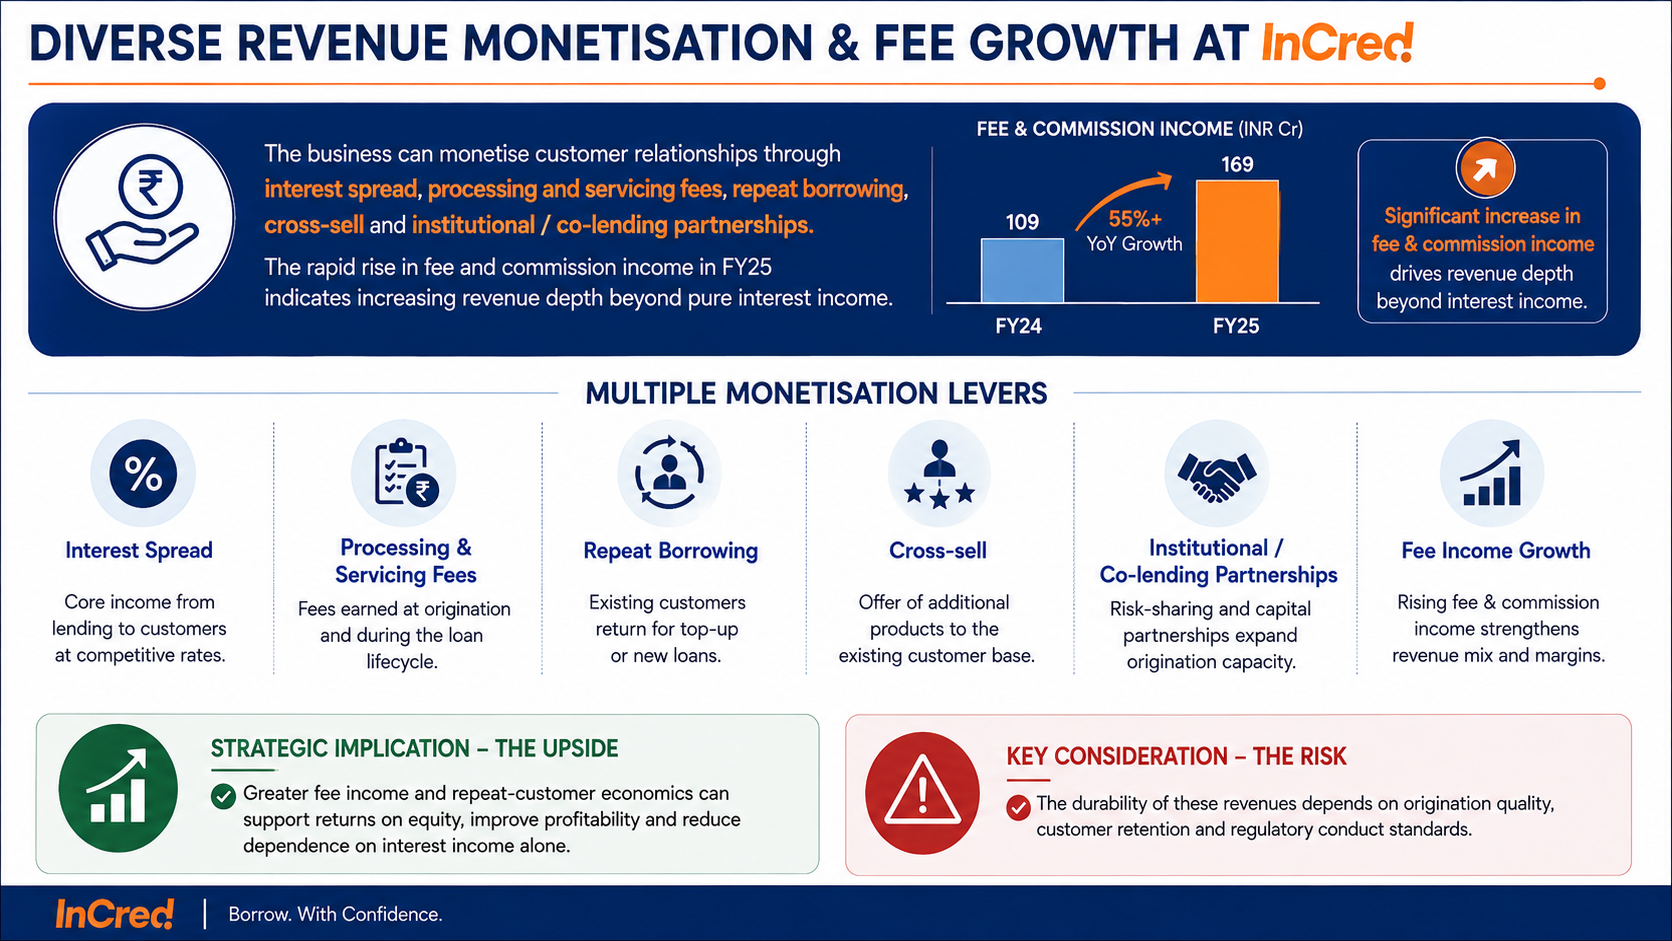
The business can monetise customer relationships through interest spread, processing and servicing fees, repeat borrowing, cross-sell and institutional / co-lending partnerships. The rapid rise in fee and commission income in FY25 indicates increasing revenue depth beyond pure interest income
Greater fee income and repeat-customer economics can support returns on equity, but the durability of these revenues depends on origination quality, customer retention and regulatory conduct standards
Government Policy Support
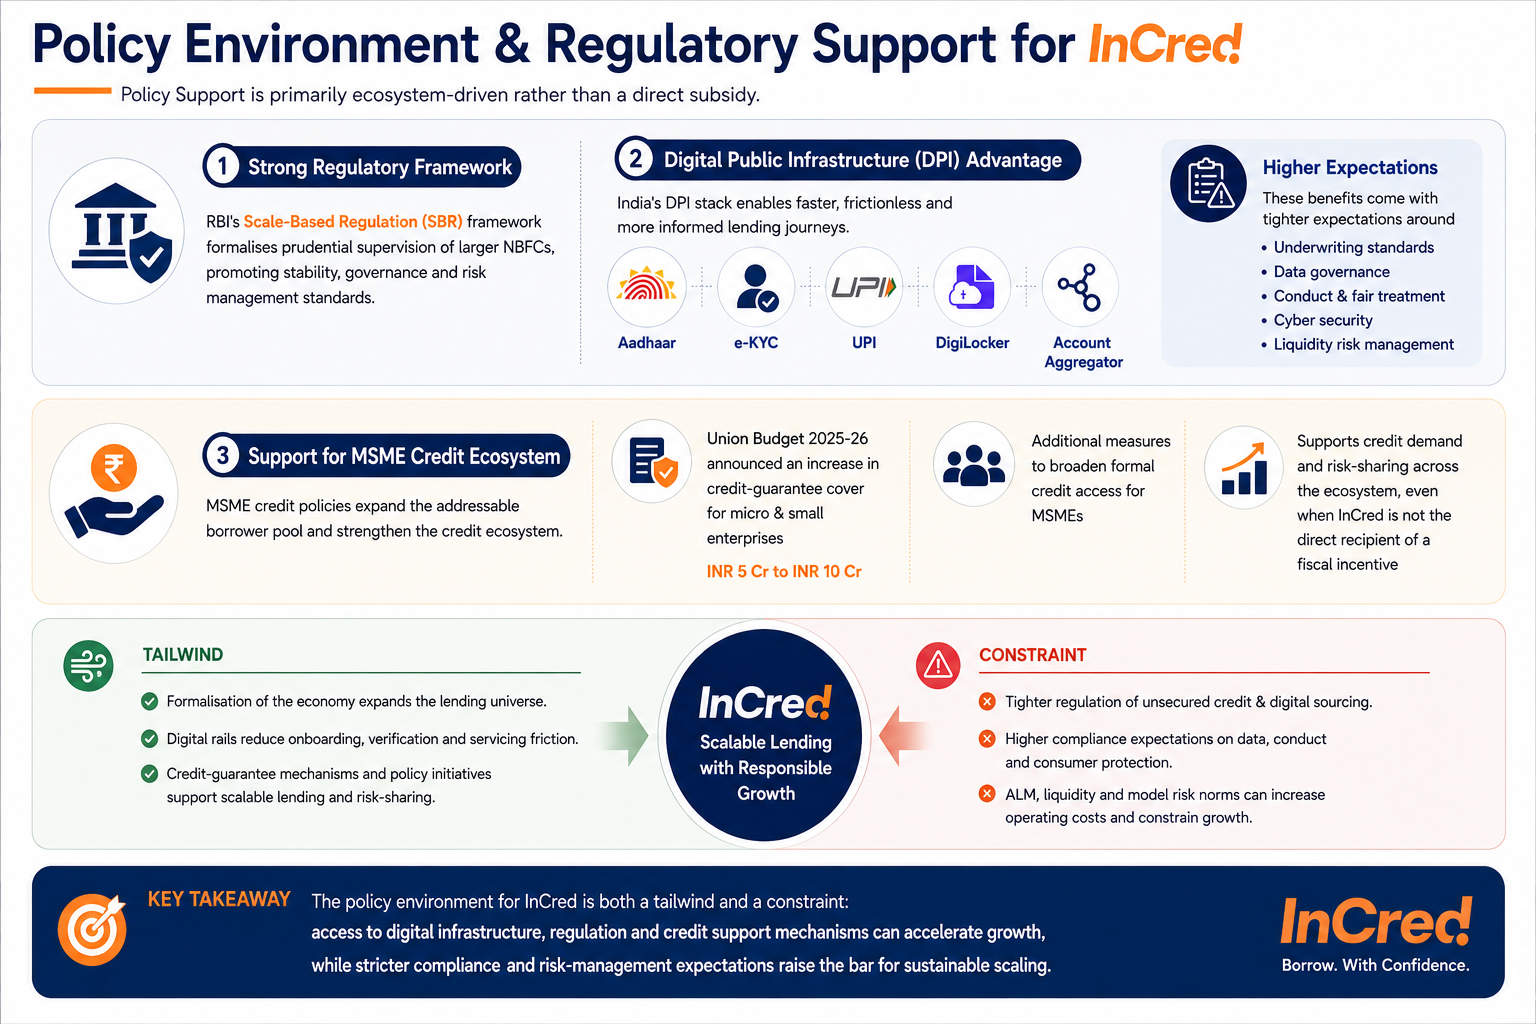
Policy support for InCred is primarily ecosystem-driven rather than a direct subsidy. RBI's Scale-Based Regulation framework formalises prudential supervision of larger NBFCs, while India's digital public infrastructure - Aadhaar, e-KYC, UPI, DigiLocker and Account Aggregator - can reduce onboarding and information friction for lenders. These benefits come with tighter expectations around underwriting, data governance, conduct, cyber security and liquidity risk
MSME credit policy can also expand the addressable borrower pool. The Union Budget 2025-26 announced an increase in credit-guarantee cover for micro and small enterprises from INR 5 Cr to INR 10 Cr and additional measures to broaden formal credit access. Such initiatives can support credit demand and risk-sharing across the ecosystem even when InCred is not the direct recipient of a fiscal incentive
The policy environment should therefore be viewed as both a tailwind and a constraint: formalisation, digital rails and credit-guarantee mechanisms support scalable lending, while tighter regulation of unsecured credit, digital sourcing, ALM and model risk can raise compliance costs or constrain growth
Fundraise/Future Plans
Shareholding
Pre-issue shareholding
Promoter Holding 0.0%
Category
Pre-Issue%
Promoters
0.0%
Total Promoter Holding
0.0%
Additional Shareholders
0.0%
Total Additional Holding
0.0%
Total Shareholding
0.0%
- Overview
- Business
- Financial Highlights
- Industry Overview
- Fundraise/Future Plans
- Documentation
Get the Preqt App and keep in touch around the clock!
 Monitor your investments in real-time.
- Receive tailored deal suggestions.
- Get real-time updates and alerts.
