

Indofil Industries Ltd
Farm Productivity PartnerChemicals With Purpose
Unlisted Review Rating
Average
DRHP Not FiledAdvancing Agriculture Through Innovative Crop Protection and Chemical Solutions
The Company scores strongly on profitability improvement, leverage, international exposure and valuation. The overall score is constrained by modest long-term revenue growth, highly regulated and fragmented operating sectors, weak FY25 board independence and ongoing promoter-family litigation concerning governance and control.
PARAMETER
WEIGHT
SCORE
KEY FACTORS
Financial Performance
25.0%
3.0/5
The Company delivered a material improvement in operating profitability during FY25. EBITDA and PAT increased by 29.1% and 36.2%, respectively, despite the 2-year revenue CAGR remaining at only 3.8%
Show more
Detailed Analysis
Consolidated revenue increased from INR 3,085.7 Cr in FY23 to INR 3,324.7 Cr in FY25, representing a 2-year CAGR of 3.8%. Revenue increased by 8.3% in FY25, from INR 3,068.8 Cr in FY24
EBITDA increased from INR 492.4 Cr in FY24 to INR 635.9 Cr in FY25, representing growth of 29.1%. EBITDA margin improved from 16.0% to 19.1%, reflecting meaningful operating leverage
Consolidated PAT increased from INR 332.2 Cr in FY24 to INR 452.3 Cr in FY25, representing growth of 36.2%. PAT margin improved from 10.8% to 13.6%
Total borrowings and lease liabilities stood at approximately INR 238.3 Cr, against total equity of INR 6,499.2 Cr. The resulting debt-to-equity ratio was approximately 0.0x when rounded to one decimal, indicating minimal financial leverage
FY25 PAT of INR 452.3 Cr, against average FY24–FY25 equity of INR 5,246.8 Cr, generated an ROE of approximately 8.6%
Operating cash flow remained positive at INR 426.6 Cr in FY24 and INR 232.1 Cr in FY25, although it declined by 45.6% due primarily to higher receivables and inventory deployment
Industry
25.0%
2.0/5
The industry is recovering from the destocking and pricing pressure experienced during the previous two years. CRISIL expects exports to grow by approximately 8.0%–9.0%, while overall industry operating margins are expected to remain around 12.5%–13.0%
Show more
Detailed Analysis
Indian agrochemical-industry revenue is projected to grow by approximately 6.0%–7.0%, followed by a possible return to its longer-term growth range of 8.0%–10.0%, subject to sustained export recovery and improved domestic demand.
The Indian agrochemical industry generates approximately INR 90,000.0 Cr of annual revenue, with domestic and export markets each contributing approximately 50.0%. Its established scale and moderate growth support classification as Early Mature
Indofil operates in more than 120.0 countries and added more than 25.0 international registrations during FY25. This creates exposure to multiple product-registration, environmental and residue-control regimes. Regulatory tightening and restrictions on molecules such as Mancozeb remain material risks
International revenue increased by 8.0% to INR 1,474.3 Cr in FY25, equivalent to approximately 44.3% of consolidated revenue. The Company also reported strong regional growth across North America and Latin America
Management
25.0%
2.0/5
The Company benefits from an experienced promoter group and a professional operating team.
Show more
Detailed Analysis
Dr. Bina Modi’s documented senior Modi Group governance involvement dates to at least 2011, while she was appointed Chairperson and Managing Director of Indofil in November 2019. This represents at least 14.0 years of documented group-governance exposure by FY25, including approximately 5.0 years as Indofil’s Chairperson and Managing Director
As of March 2025, the effective board comprised approximately 8.0 directors, but only 1.0 continuing independent director, representing independent participation of approximately 12.5%. The annual report states that a separate independent-directors’ meeting could not be held because only one independent director remained
Disputed consolidated tax matters stood at INR 38.7 Cr, and promoter-family litigation concerning governance, control and proposed board representation remained active before the Delhi High Court in February 2026
Valuation
25.0%
5.0/5
Indofil Industries appears materially undervalued across all four valuation criteria. The Company is valued at a P/E of 7.1x, representing a 76.2% discount to the industry P/E of 30.0x, while its EV/EBITDA of 4.6x represents a 54.9% discount to the selected peer median of 10.2x
Show more
Detailed Analysis
The Company is valued at a P/E multiple of 7.1x, compared with the agrochemical-industry P/E of 30.0x, representing a discount of 76.2%
Indofil is valued at approximately 4.6x EV/EBITDA. The peer median is 10.2x, resulting in a discount of 54.9%
The unlisted share price increased from approximately INR 1,445.0 in early July 2026 to INR 1,460.0 by mid-July, before remaining broadly stable through July 21, 2026
TOTAL
100%
3.0/5
Weighted Composite Score
Per Share Price
₹1444.0
As of 14 Oct 2026
Lot Size
50.0 Shares
Minimum Investment
₹72,20,000.0 / 5,000 shares
Market Cap. (₹ Cr)
Revenue FY’25
PAT FY’25 (in Cr)
P/E Multiple
Face Value
₹ 10.0Lot Size
50.0 sharesSale Type
SecondaryPAT FY’25 (in Cr)
₹ 452.3 CrPAT Margin (%)
13.6 %P/E Multiple
7.1xCAGR Growth 3Y
4.6 %ROE (FY’25)
8.6 %ROCE (FY’25)
9.5 %Price to Book Value ratio
0.5xDebt/Equity (FY’25)
0.0xMerchant banker appointed
❌ NoCompany Website
www.indofil.comDisclaimer: Unlisted shares are unregulated & illiquid. This is NOT investment advice. Please do your own due diligence before investing.
Minimum Investment
₹72,20,000.0 / 5,000 sharesShares Lot 50 X 100
Investment amount
₹72,20,000.0
Overview
Business
Products
Business Model
Geographical Presence
Sales Channel
Financial Highlights
Income Statement
Revenue growth with EBITDA and PAT margins
| Financial Metric | FY 2023 | FY 2024 | FY 2025 |
|---|---|---|---|
| Revenue (₹ Cr) | 3,036.9 | 3,068.8 | 3,324.7 |
| Growth (%) | 8.7% | 1.0% | 8.3% |
| EBITDA (₹ Cr) | 427.7 | 492.4 | 635.9 |
| EBITDA Margin (%) | 14.1% | 16.0% | 19.1% |
| PAT (₹ Cr) | 241.1 | 332.2 | 452.3 |
| PAT Margin (%) | 7.9% | 10.8% | 13.6% |
OBSERVATIONS & INSIGHTS
Revenue from operations increased from ₹3,036.92 Cr in FY23 to ₹3,324.73 Cr in FY25, implying a 3-year CAGR of approximately 4.6%
FY25 revenue grew 8.3% year-on-year, improving from the largely flat FY24 revenue base
PAT increased from ₹241.14 Cr in FY23 to ₹452.28 Cr in FY25, with PAT margin improving from 7.9% to 13.6%
EBITDA increased from ₹427.69 Cr in FY23 to ₹635.86 Cr in FY25, with EBITDA margin improving to 19.1%
Balance Sheet
| Financial Metric | FY 2023 | FY 2024 | FY 2025 |
|---|---|---|---|
| EQUITY & LIABILITIES | ₹ 4,132.7 Cr | ₹ 5,156.7 Cr | ₹ 8,001.4 Cr |
| Net Worth | ₹ 2,917.6 Cr | ₹ 3,994.4 Cr | ₹ 6,498.0 Cr |
| Share Capital | ₹ 21.4 Cr | ₹ 21.4 Cr | ₹ 21.4 Cr |
| Reserves & Surplus | ₹ 2,896.2 Cr | ₹ 3,973.0 Cr | ₹ 6,476.6 Cr |
| Total Liabilities | ₹ 1,215.1 Cr | ₹ 1,162.3 Cr | ₹ 1,503.4 Cr |
| Current Liabilities | ₹ 959.5 Cr | ₹ 871.8 Cr | ₹ 883.9 Cr |
| Borrowings | ₹ 442.7 Cr | ₹ 310.0 Cr | ₹ 236.0 Cr |
| Trade Payables | ₹ 438.9 Cr | ₹ 477.2 Cr | ₹ 520.9 Cr |
| Other Current Liabilities | ₹ 77.9 Cr | ₹ 84.6 Cr | ₹ 127.0 Cr |
| Non-Current Liabilities | ₹ 255.6 Cr | ₹ 290.5 Cr | ₹ 619.5 Cr |
| Borrowings | ₹ 116.3 Cr | ₹ 53.3 Cr | ₹ 1.4 Cr |
| Other Non-Current Liabilities | ₹ 139.3 Cr | ₹ 237.2 Cr | ₹ 618.1 Cr |
| ASSETS | ₹ 4,131.2 Cr | ₹ 5,156.4 Cr | ₹ 8,001.5 Cr |
| Current Assets | ₹ 1,830.0 Cr | ₹ 1,981.0 Cr | ₹ 2,376.8 Cr |
| Trade Receivables | ₹ 758.0 Cr | ₹ 902.9 Cr | ₹ 1,109.1 Cr |
| Inventory | ₹ 688.9 Cr | ₹ 525.3 Cr | ₹ 584.6 Cr |
| Cash & Cash Equivalents | ₹ 140.5 Cr | ₹ 358.2 Cr | ₹ 434.1 Cr |
| Other Current Assets | ₹ 242.6 Cr | ₹ 194.6 Cr | ₹ 249.0 Cr |
| Non-Current Assets | ₹ 2,301.2 Cr | ₹ 3,175.4 Cr | ₹ 5,624.7 Cr |
| Fixed Assets | ₹ 880.8 Cr | ₹ 858.1 Cr | ₹ 823.7 Cr |
| Other Non-Current Assets | ₹ 1,420.4 Cr | ₹ 2,317.3 Cr | ₹ 4,801.0 Cr |
OBSERVATIONS & INSIGHTS
Total assets increased from ₹4,132.56 Cr in FY23 to ₹8,002.59 Cr in FY25, driven largely by higher investments and expanded asset base
Net worth increased from ₹2,917.53 Cr in FY23 to ₹6,499.23 Cr in FY25, supported by profit accretion and fair value changes of investments
Total borrowings reduced from ₹558.99 Cr in FY23 to ₹237.39 Cr in FY25, resulting in a materially lower debt/equity ratio
Trade receivables increased from ₹758.01 Cr in FY23 to ₹1,109.09 Cr in FY25, making receivable management a key monitorable
Cash and cash equivalents increased from ₹140.51 Cr in FY23 to ₹434.05 Cr in FY25, strengthening liquidity
Cash Flow
| Financial Metric | FY 2023 | FY 2024 | FY 2025 |
|---|---|---|---|
CFO (₹ Cr) Cash generated from core business operations. | -67.2 Cr | +426.6 Cr | +232.1 Cr |
CFI (₹ Cr) Cash used for investments and long-term assets. | +1.1 Cr | +47.7 Cr | -12.4 Cr |
CFF (₹ Cr) Cash flow related to funding and borrowings. | -184.3 Cr | -256.7 Cr | -143.8 Cr |
Working Capital
| Efficiency Metric | FY 2023 | FY 2024 | FY 2025 |
|---|---|---|---|
Debtor Days Average number of days taken to collect customer payments. | - | - | - |
Creditor Days Average time taken to pay suppliers and vendors. | - | - | - |
Inventory Days Average number of days inventory remains unsold. | - | - | - |
CCC (Cash Conversion Cycle) (Debtor Days + Inventory Days - Creditor Days) | - | - | - |
Financial Ratios
Measures the company’s leverage relative to shareholder equity.
OBSERVATIONS & INSIGHTS
Debt/equity reduced materially from 0.19x in FY23 to 0.04x in FY25, indicating a low leverage profile
Interest coverage improved from 7.4x in FY23 to 21.3x in FY25, helped by lower finance cost and improved operating profits
ROE remained in the high single digits in FY25 because the company’s net worth increased sharply through fair value movements and retained profits
Current ratio improved to 2.69x in FY25, reflecting a comfortable short-term liquidity position
Industry Overview
Industry Drivers
Crop Protection Demand and Farm Productivity
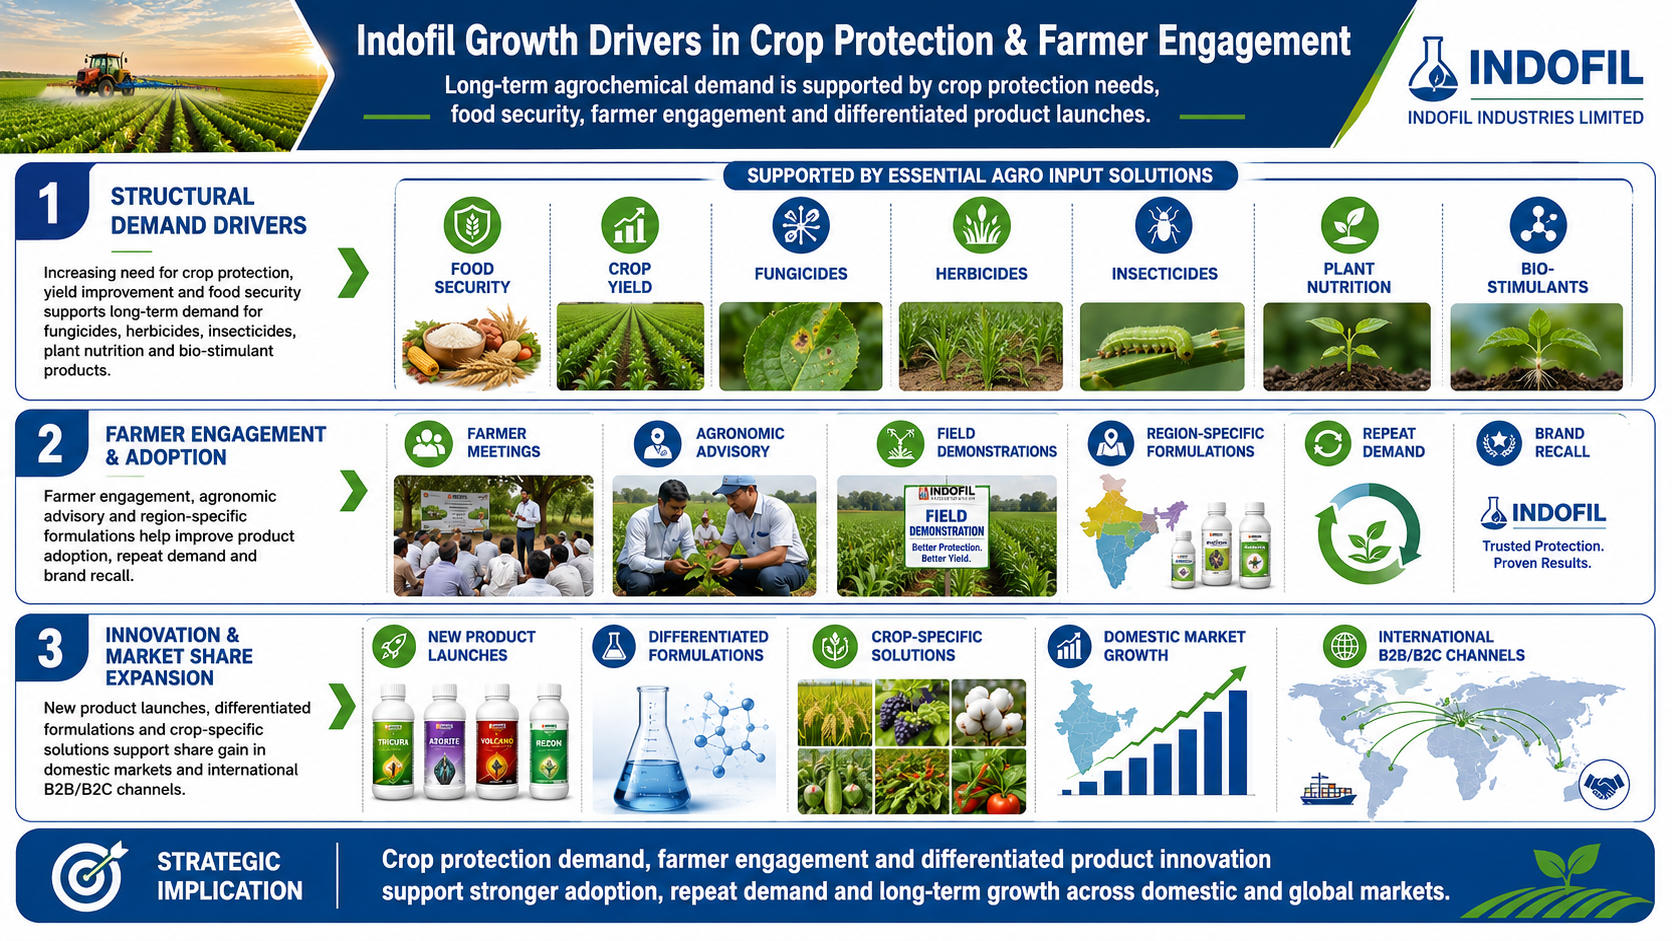
Increasing need for crop protection, yield improvement and food security supports long-term demand for fungicides, herbicides, insecticides, plant nutrition and bio-stimulant products
Farmer engagement, agronomic advisory and region-specific formulations help improve product adoption, repeat demand and brand recall
New product launches, differentiated formulations and crop-specific solutions support share gain in domestic markets and international B2B/B2C channels
Global Registration, R&D and Specialty Chemical Expansion
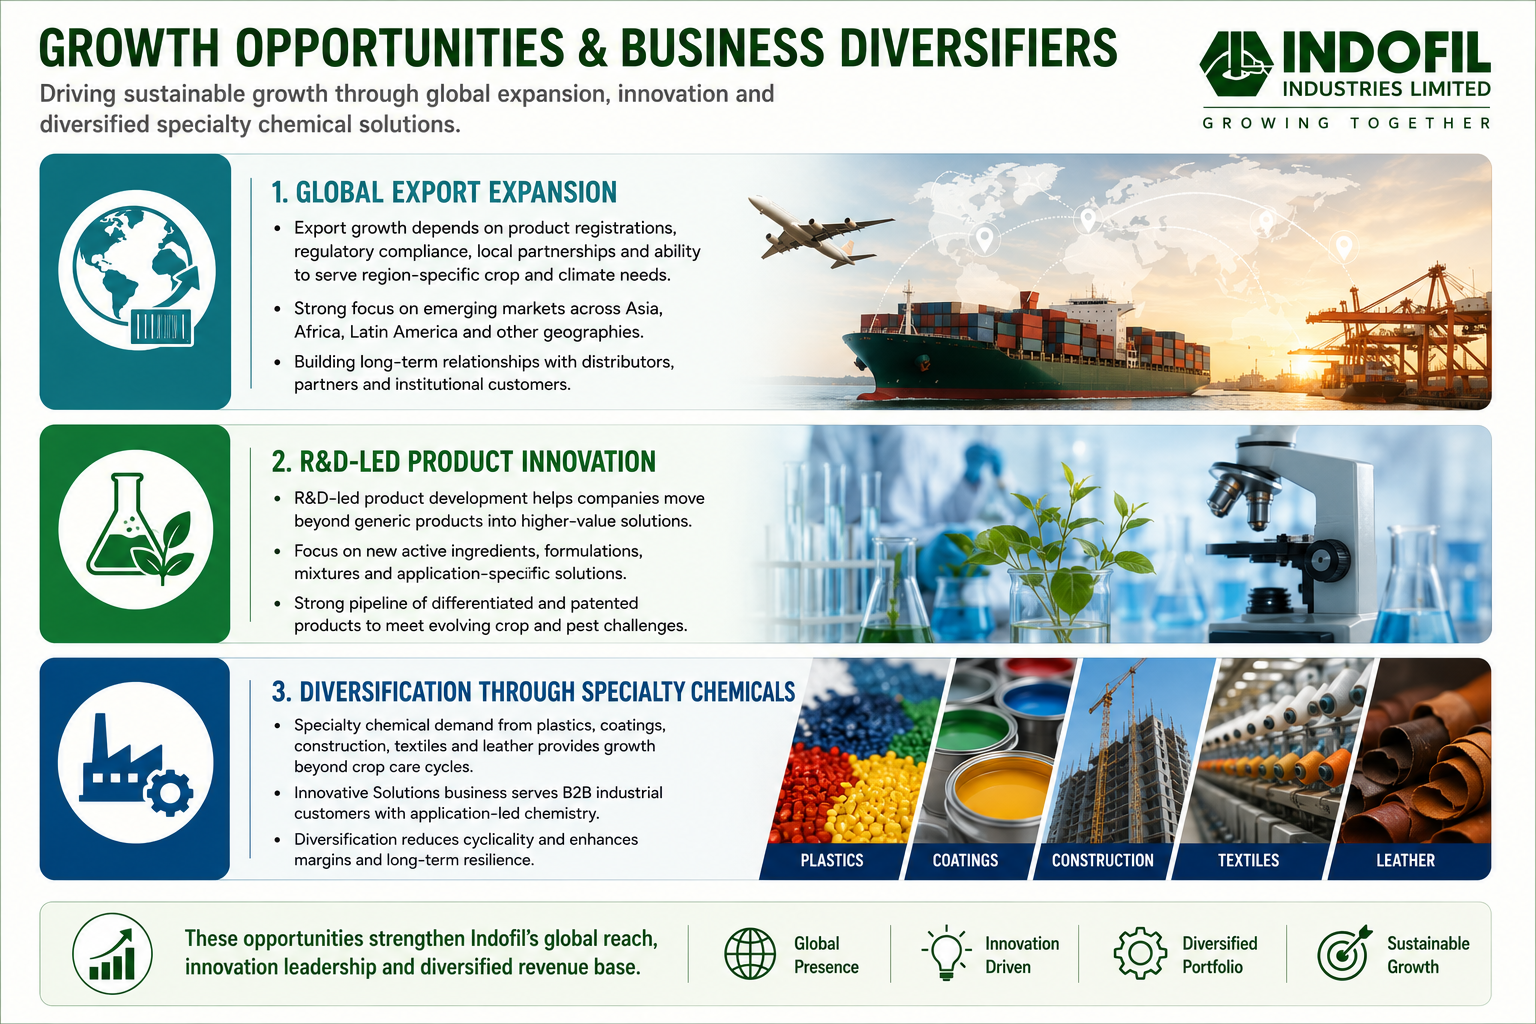
Export growth depends on product registrations, regulatory compliance, local partnerships and ability to serve region specific crop and climate needs
R&D-led product development helps companies move beyond generic products into higher-value formulations, active ingredients, mixtures and application-specific solutions
Specialty chemical demand from plastics, coatings, construction, textiles and leather can diversify revenue beyond crop care cycles
Risks in the Industry
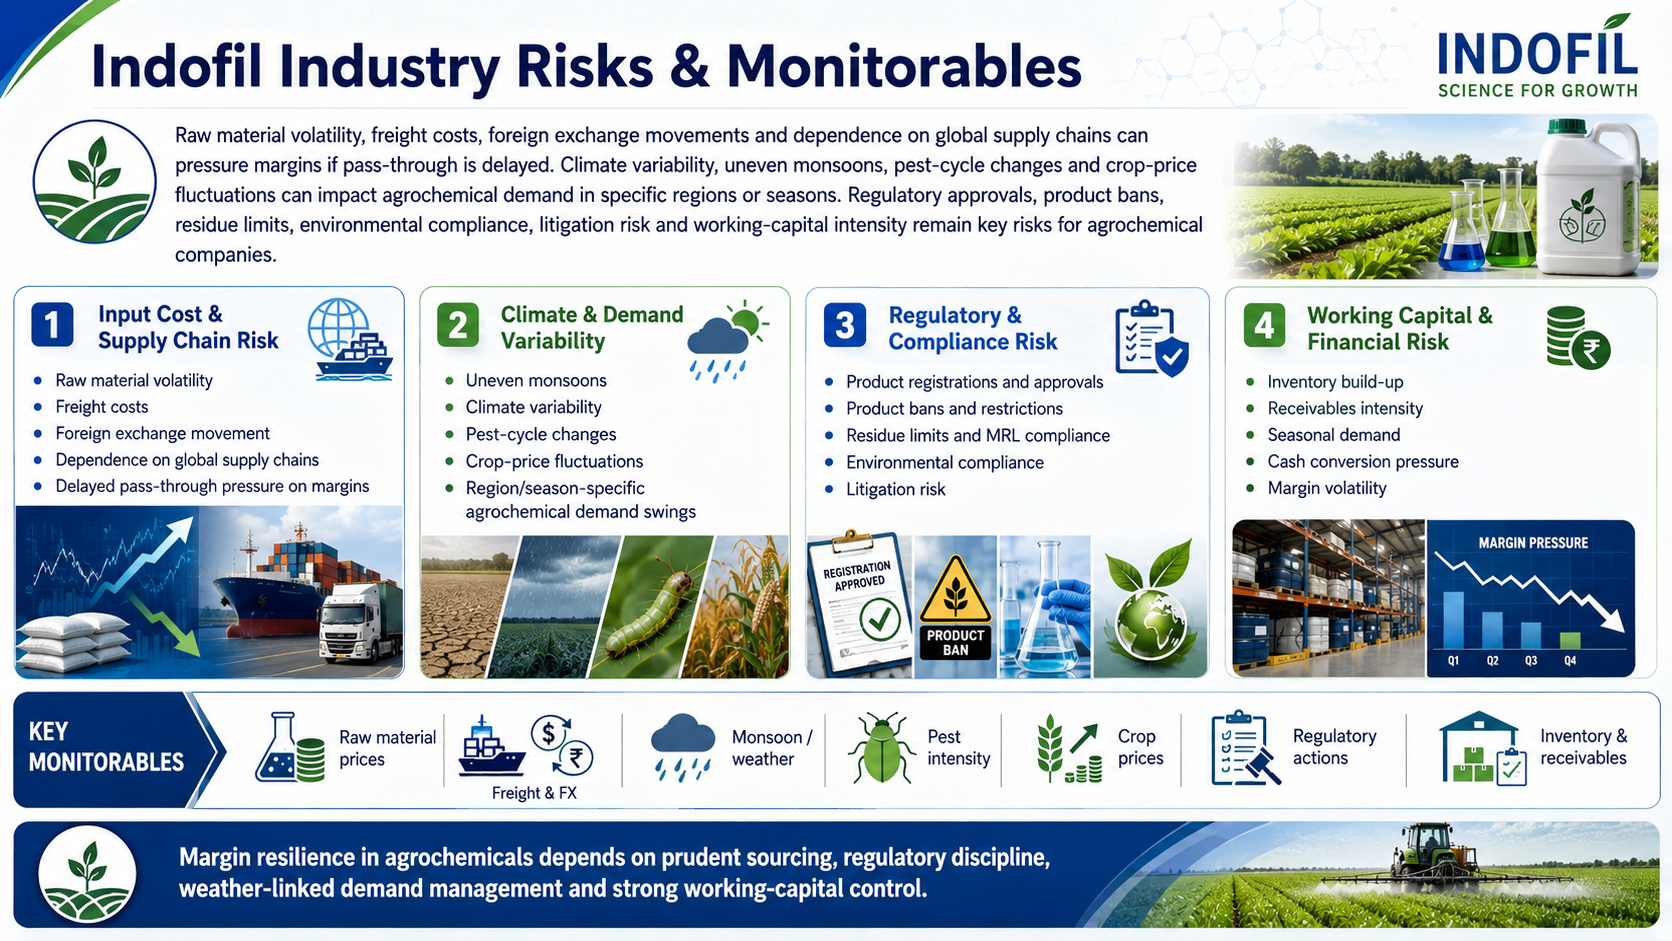
Raw material volatility, freight costs, foreign exchange movements and dependence on global supply chains can pressure margins if pass-through is delayed
Climate variability, uneven monsoons, pest-cycle changes and crop-price fluctuations can impact agrochemical demand in specific regions or seasons
Regulatory approvals, product bans, residue limits, environmental compliance, litigation risk and working-capital intensity are key risks for agrochemical companies
Government Policy Support
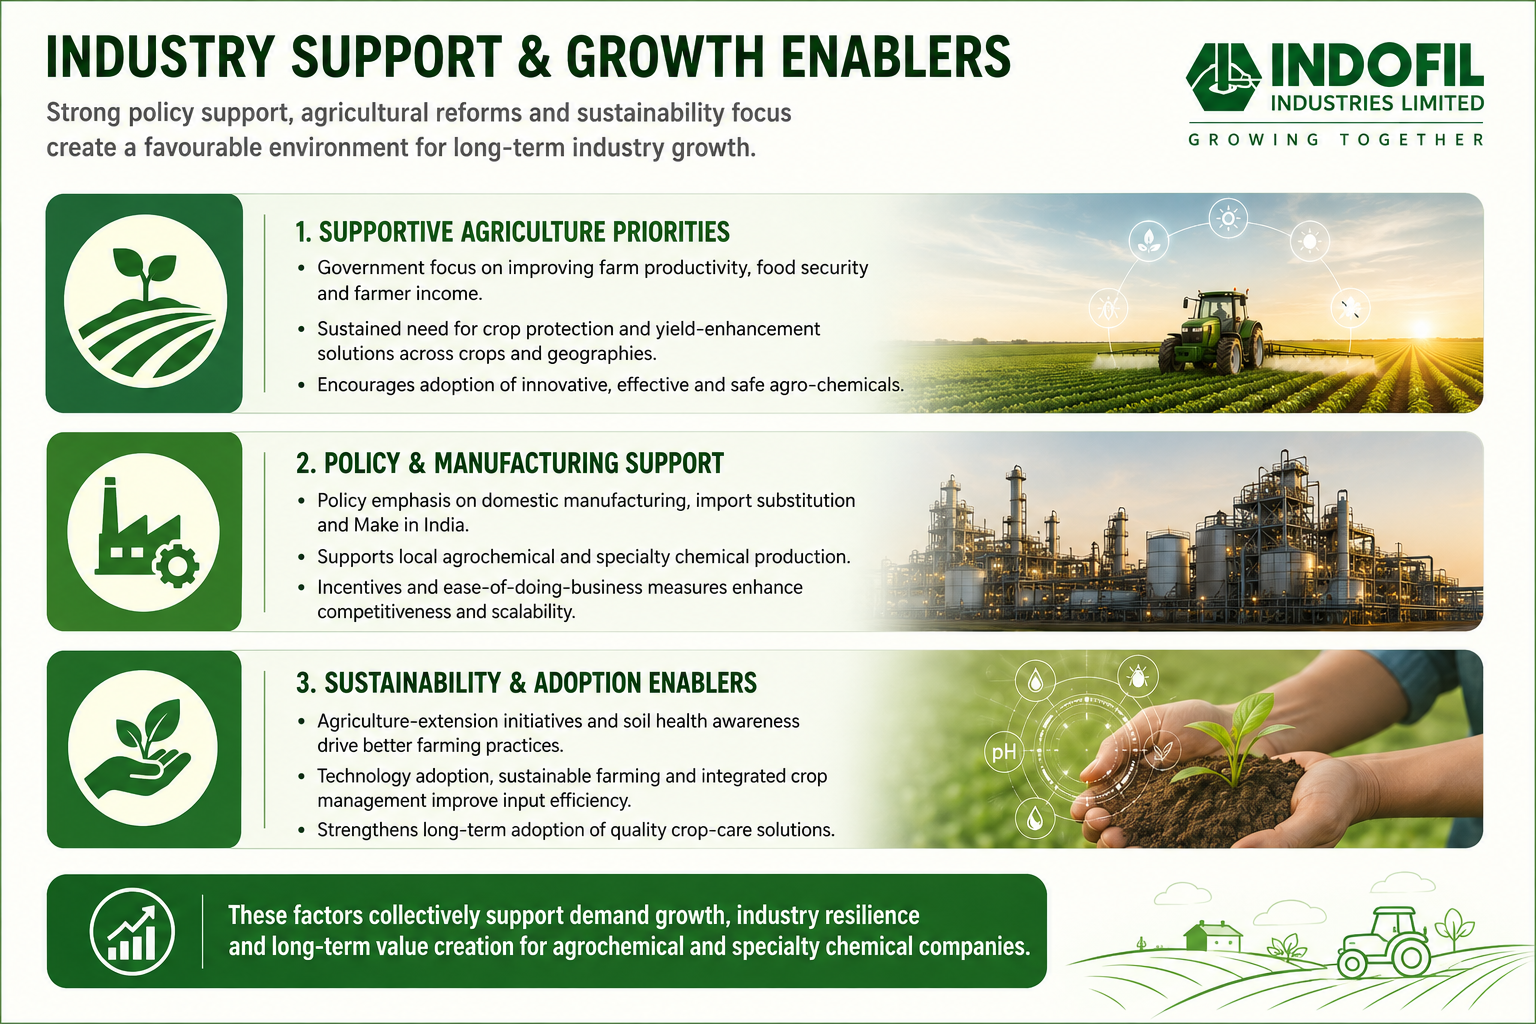
Government focus on improving farm productivity, food security and farmer income supports demand for crop protection and yield-enhancement solutions
Policy emphasis on domestic manufacturing, import substitution and Make in India can support local agrochemical and specialty chemical production
Agriculture-extension initiatives, soil health awareness, technology adoption and institutional focus on sustainable farming can improve adoption of better crop-care practices
- Overview
- Business
- Financial Highlights
- Industry Overview
- Documentation
Get the Preqt App and keep in touch around the clock!
 Monitor your investments in real-time.
- Receive tailored deal suggestions.
- Get real-time updates and alerts.
