


IndusInd General Insurance Company Ltd
Diversified Product PortfolioTechnology-Enabled DistributionDigital Insurance Platform
IPO Review and Rating
Speculative
Overall Recommendation
Gross direct premium has grown at a modest 5.8% FY23-FY26 CAGR and declined 2.5% in FY26, while profitability weakened materially with PAT falling 71.2% to INR 90.8 Cr, ROE declining to 2.3%, the operating-profit ratio falling to 0.3% and the combined ratio deteriorating to 124.9%. D/E remains manageable at 0.25x and solvency improved to 1.73x, although operating cash flow remained negative at INR (438.1) Cr.
PARAMETER
WEIGHT
SCORE
KEY FACTORS
Financial Performance
25.0%
1.5/5
The operating-profit ratio fell to 0.3%, net earnings ratio to 1.3%, PAT declined 71.2% to INR 90.8 Cr
Show more
Detailed Analysis
Gross direct premium increased from INR 10,339.0 Cr in FY23 to INR 12,548.4 Cr in FY25 and approximately INR 12,237.2 Cr in FY26, representing a 5.8% FY23-FY26 3-year CAGR
Return on net worth declined from 9.2% in FY25 to 2.3% in FY26, reflecting the sharp reduction in profitability despite net worth increasing 14.3% YoY
Operating cash flow remained negative at INR (714.4) Cr in FY25 and INR (438.1) Cr in FY26; the cash outflow improved 38.7% YoY but remained negative for both years
Industry
25.0%
2.0/5
India's non-life insurance industry reached INR 3.36 lakh Cr in FY26 with 9.3% growth
Show more
Detailed Analysis
Non-life GDPI increased from approximately INR 96,379 Cr in FY16 to INR 3,07,633 Cr in FY25, representing approximately 14.0% long-term CAGR
FY26 insurer market shares imply an estimated HHI of approximately 572, with IndusInd General holding approximately 3.6% market share
Expenses of management reached 32.1% of gross direct premium and exceeded IRDAI regulatory limit
Management
25.0%
4.2/5
Leadership experience stands at 25+ years
Show more
Detailed Analysis
The board comprised 6 Directors, including 4 Independent Directors, resulting in 66.7% Board independence
0% promoter-share pledge was identified in the reviewed disclosures
FY25 included GST demands of approximately INR 395.7 Cr and INR 526.7 Cr, although management expected these cases to be dropped following the CBIC clarification
Recurring FY25 operating/KMP RPTs were approximately INR 36.6 Cr, equivalent to approximately 0.3% of FY25 GWP of INR 12,666.8 Cr
Valuation Metrics
25.0%
2.6/5
The Company is valued at a high premium compared to the industry benchmark
Show more
Detailed Analysis
The Company is valued at 3.9x P/B, against audited FY26 book value of INR 141.56/share and an implied valuation price of approximately INR 550.0/share
The Company is valued at 162.7x P/E against an industry P/E of 35.0x, representing a 364.9% premium to the stated industry benchmark
A 52-week range of INR 533.6-INR 584.8/share, representing an approximately 9.6% range, with a recent reference price of INR 543.9/share
TOTAL
100%
2.6/5
Weighted Composite Score
Per Share Price
₹550.0
As of 14 Oct 2026
Lot Size
100.0 Shares
Minimum Investment
₹55,000.0 / 100 shares
Market Cap. (₹ Cr)
Revenue FY’26
PAT FY’26
P/E Multiple
Face Value
₹ 10.0Lot Size
100.0 sharesSale Type
PrimaryPAT FY’26
₹ 90.8 CrPAT Margin (%)
28.5 %P/E Multiple
162.7xCAGR Growth 3Y
2.5 %ROE (FY’26)
2.3 %Price to Book Value ratio
3.9xDebt/Equity (FY’26)
0.3xMerchant banker appointed
❌ NoCompany Website
www.indusindinsurance.comDisclaimer: Unlisted shares are unregulated & illiquid. This is NOT investment advice. Please do your own due diligence before investing.
Minimum Investment
₹55,000.0 / 100 sharesShares Lot 100 X 1
Investment amount
₹55,000.0
Overview
Business
Products
Business Model
Geographical Presence
Sales Channel
Financial Highlights
Income Statement
Revenue growth with EBITDA and PAT margins
| Financial Metric | FY 2024 | FY 2025 | FY 2026 |
|---|---|---|---|
| Revenue (₹ Cr) | 6,687.2 | 7,124.7 | 7,021.3 |
| Growth (%) | 11.0% | 6.5% | -1.5% |
| EBITDA (₹ Cr) | - | - | - |
| EBITDA Margin (%) | - | - | - |
| PAT (₹ Cr) | 280.3 | 315.4 | 90.8 |
| PAT Margin (%) | 4.2% | 4.4% | 1.3% |
OBSERVATIONS & INSIGHTS
Net Earned Premium increased from INR 6,687.2 Cr in FY24 to INR 7,124.7 Cr in FY25, before declining by approximately 1.5% to INR 7,021.3 Cr in FY26. The two-year CAGR across FY24-FY26 is approximately 2.5%.
PAT increased from INR 280.3 Cr in FY24 to INR 315.4 Cr in FY25, but fell sharply by approximately 71.2% to INR 90.8 Cr in FY26.
The combined ratio deteriorated from approximately 115.0% in FY24 to 116.6% in FY25 and 124.9% in FY26. A ratio above 100% indicates that claims and operating/commission expenses exceeded premium income before investment income.
FY26 Gross Direct Premium growth was negative 2.5% compared with positive 7.4% in FY25, indicating a slowdown in underwriting growth during the latest year.
Balance Sheet
| Financial Metric | FY 2024 | FY 2025 | FY 2026 |
|---|---|---|---|
| EQUITY & LIABILITIES | ₹ 22,834.2 Cr | ₹ 24,413.3 Cr | ₹ 27,279.4 Cr |
| Net Worth | ₹ 3,188.3 Cr | ₹ 3,434.7 Cr | ₹ 3,773.2 Cr |
| Share Capital | ₹ 264.8 Cr | ₹ 264.9 Cr | ₹ 276.9 Cr |
| Reserves & Surplus | ₹ 2,923.5 Cr | ₹ 3,169.8 Cr | ₹ 3,496.3 Cr |
| Total Liabilities | ₹ 19,645.9 Cr | ₹ 20,978.6 Cr | ₹ 23,506.2 Cr |
| Current Liabilities | ₹ 19,415.9 Cr | ₹ 20,978.6 Cr | ₹ 22,772.4 Cr |
| Borrowings | ₹ 0.0 Cr | ₹ 0.0 Cr | ₹ 230.0 Cr |
| Trade Payables | ₹ 0.0 Cr | ₹ 0.0 Cr | ₹ 0.0 Cr |
| Other Current Liabilities | ₹ 19,415.9 Cr | ₹ 20,978.6 Cr | ₹ 22,542.4 Cr |
| Non-Current Liabilities | ₹ 230.0 Cr | ₹ 0.0 Cr | ₹ 733.8 Cr |
| Borrowings | ₹ 230.0 Cr | ₹ 0.0 Cr | ₹ 733.8 Cr |
| Other Non-Current Liabilities | ₹ 0.0 Cr | ₹ 0.0 Cr | ₹ 0.0 Cr |
| ASSETS | ₹ 22,834.1 Cr | ₹ 24,643.4 Cr | ₹ 27,279.4 Cr |
| Current Assets | ₹ 2,162.1 Cr | ₹ 3,002.4 Cr | ₹ 4,304.9 Cr |
| Trade Receivables | ₹ 0.0 Cr | ₹ 0.0 Cr | ₹ 0.0 Cr |
| Inventory | ₹ 0.0 Cr | ₹ 0.0 Cr | ₹ 0.0 Cr |
| Cash & Cash Equivalents | ₹ 173.1 Cr | ₹ 175.6 Cr | ₹ 880.8 Cr |
| Other Current Assets | ₹ 1,989.0 Cr | ₹ 2,826.8 Cr | ₹ 3,424.1 Cr |
| Non-Current Assets | ₹ 20,672.0 Cr | ₹ 21,641.0 Cr | ₹ 22,974.5 Cr |
| Fixed Assets | ₹ 121.1 Cr | ₹ 130.1 Cr | ₹ 137.5 Cr |
| Other Non-Current Assets | ₹ 20,550.9 Cr | ₹ 21,510.9 Cr | ₹ 22,837.0 Cr |
OBSERVATIONS & INSIGHTS
Gross assets increased from approximately INR 22,834.1 Cr in FY24 to INR 27,279.3 Cr in FY26, driven primarily by a larger investment book and higher cash/other current assets.
The combined policyholder and shareholder investment portfolio increased from approximately INR 20,513.7 Cr in FY24 to INR 22,678.4 Cr in FY26, reinforcing the importance of investment yield and asset quality to profitability.
Cash and bank balances increased sharply to INR 880.8 Cr in FY26 from INR 175.6 Cr in FY25, supported by financing inflows during the year.
Balance-sheet equity increased from approximately INR 3,188.3 Cr in FY24 to INR 3,773.2 Cr in FY26. Separately, the FY26 Regulation 52 disclosure reports regulatory Net Worth of INR 3,919.1 Cr due to a different regulatory definition.
Total borrowings increased from INR 230.0 Cr in FY25 to INR 963.8 Cr in FY26, increasing leverage and contributing to the decline in interest coverage.
Insurance liabilities are structurally large because current liabilities include claims outstanding, balances due to insurers/intermediaries, premium advances and other policyholder-related obligations. These should not be interpreted like trade liabilities of an industrial company.
Cash Flow
| Financial Metric | FY 2024 | FY 2025 | FY 2026 |
|---|---|---|---|
CFO (₹ Cr) Cash generated from core business operations. | +2,154.4 Cr | -714.4 Cr | -438.1 Cr |
CFF (₹ Cr) Cash flow related to funding and borrowings. | +228.2 Cr | -33.9 Cr | +1,098.9 Cr |
CFI (₹ Cr) Cash used for investments and long-term assets. | -2,252.5 Cr | +643.5 Cr | +185.9 Cr |
Financial Ratios
Measures the company’s leverage relative to shareholder equity.
OBSERVATIONS & INSIGHTS
ROE declined materially from 9.2% in FY25 to 2.3% in FY26 as profitability weakened despite higher net worth.
Debt/Equity increased from approximately 0.1x in FY24-FY25 to approximately 0.3x in FY26 following additional subordinated NCD issuances and other borrowings.
Interest coverage fell from 15.0x in FY24 and 11.8x in FY25 to 3.5x in FY26, reflecting the combination of lower profitability and a higher debt/interest burden.
The solvency ratio improved from 1.59x in FY25 to 1.73x in FY26, providing a stronger regulatory-capital buffer even as operating profitability weakened.
Industry Overview
Industry Drivers
Expansion of Technological Capabilities
Technology is increasingly central to distribution, underwriting, fraud detection, claims adjudication and customer servicing. The Company has adopted AI-based claim checks, face/image comparison, vernacular translation, OCR-based claim processing, digital portals, payment-reconciliation tools and data-security initiatives. Integration with the National Health Claims Exchange is intended to improve interoperability and claim-processing efficiency.
Key Drivers
· AI/ML-led underwriting and fraud detection
· OCR and workflow automation in claims
· Digital policy issuance, renewals and payments
· NHCX and health-claims interoperability
· Cybersecurity and policyholder-data protection
· Telematics and data-driven product customisation
Capacity Expansion and Manufacturing Efficiency
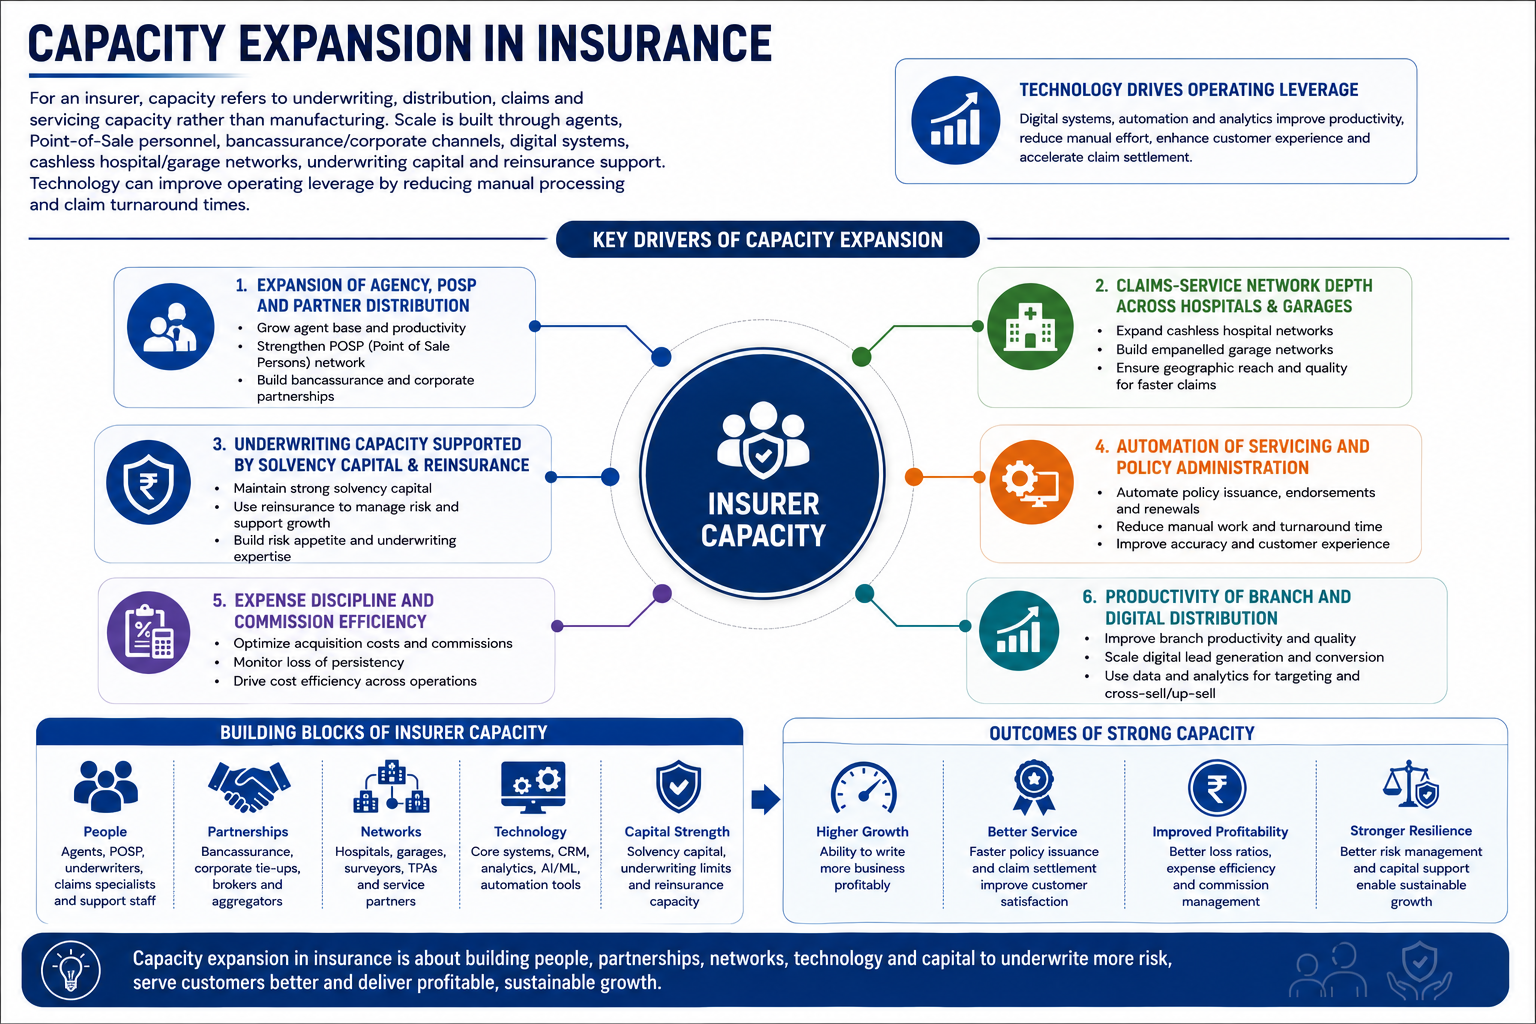
For an insurer, capacity refers to underwriting, distribution, claims and servicing capacity rather than manufacturing. Scale is built through agents, Point-of-Sale personnel, bancassurance/corporate channels, digital systems, cashless hospital/garage networks, underwriting capital and reinsurance support. Technology can improve operating leverage by reducing manual processing and claim turnaround times.
Key Drivers
· Expansion of agency, POSP and partner distribution
· Claims-service network depth across hospitals and garages
· Underwriting capacity supported by solvency capital and reinsurance
· Automation of servicing and policy administration
· Expense discipline and commission efficiency
· Productivity of branch and digital distribution
Global Market Penetration
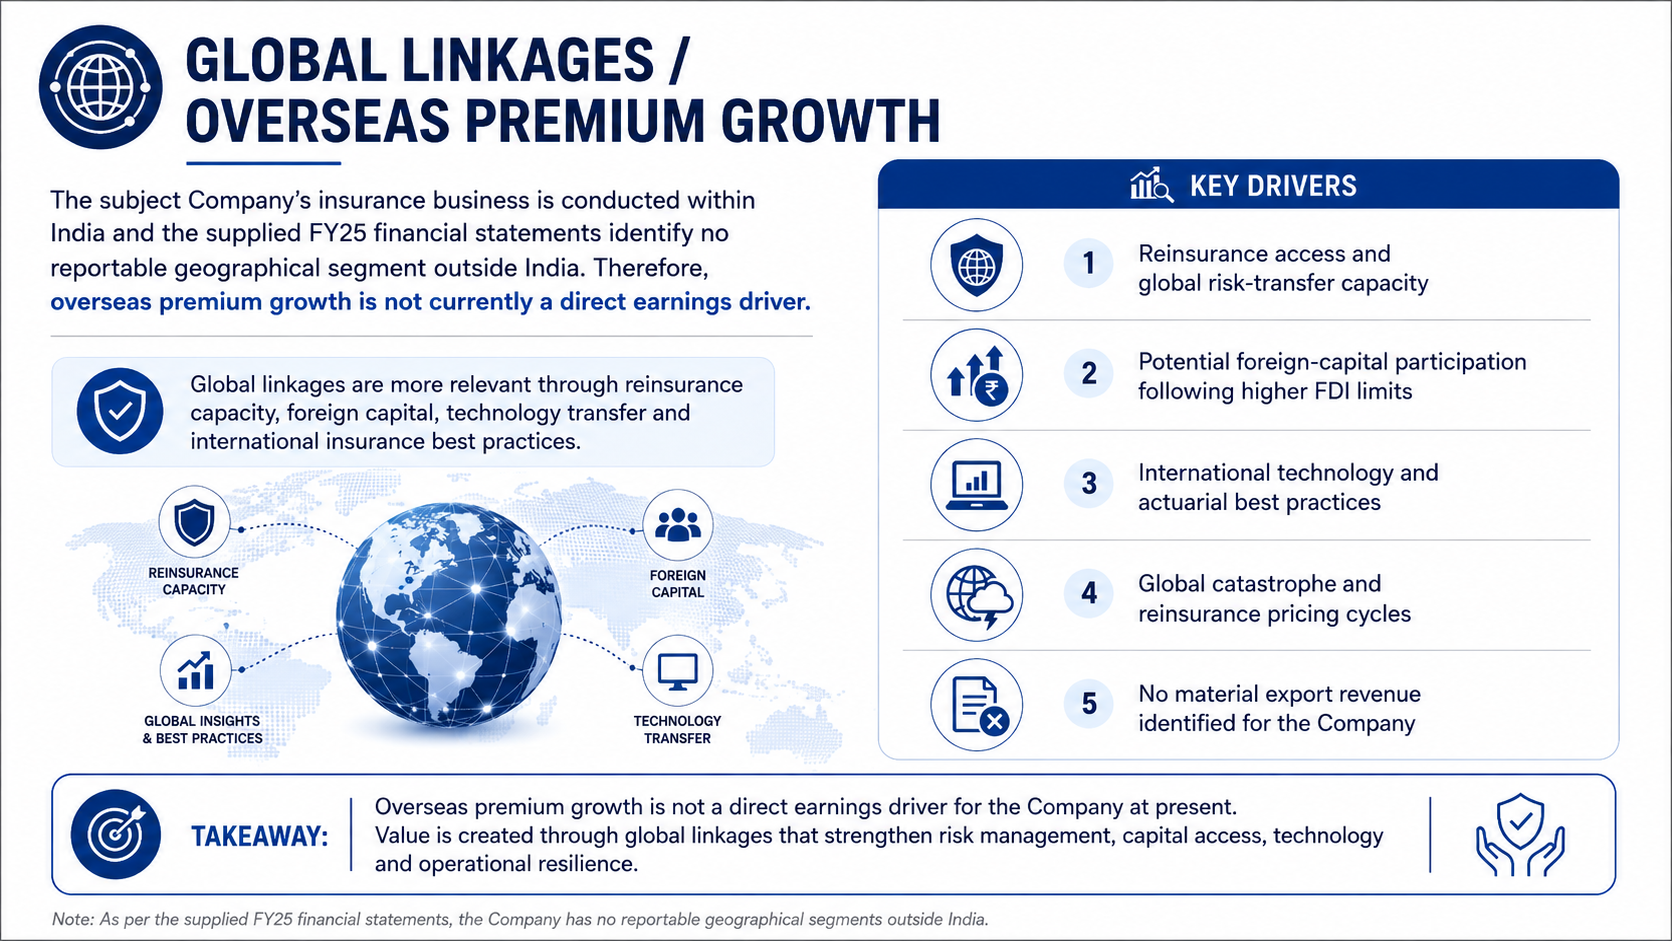
The subject Company’s insurance business is conducted within India and the supplied FY25 financial statements identify no reportable geographical segment outside India. Therefore, overseas premium growth is not currently a direct earnings driver. Global linkages are more relevant through reinsurance capacity, foreign capital, technology transfer and international insurance best practices.
Key Drivers
· Reinsurance access and global risk-transfer capacity
· Potential foreign-capital participation following higher FDI limits
· International technology and actuarial best practices
· Global catastrophe and reinsurance pricing cycles
· No material export revenue identified for the Company
Aftermarket Demand and OEM Relationship Depth
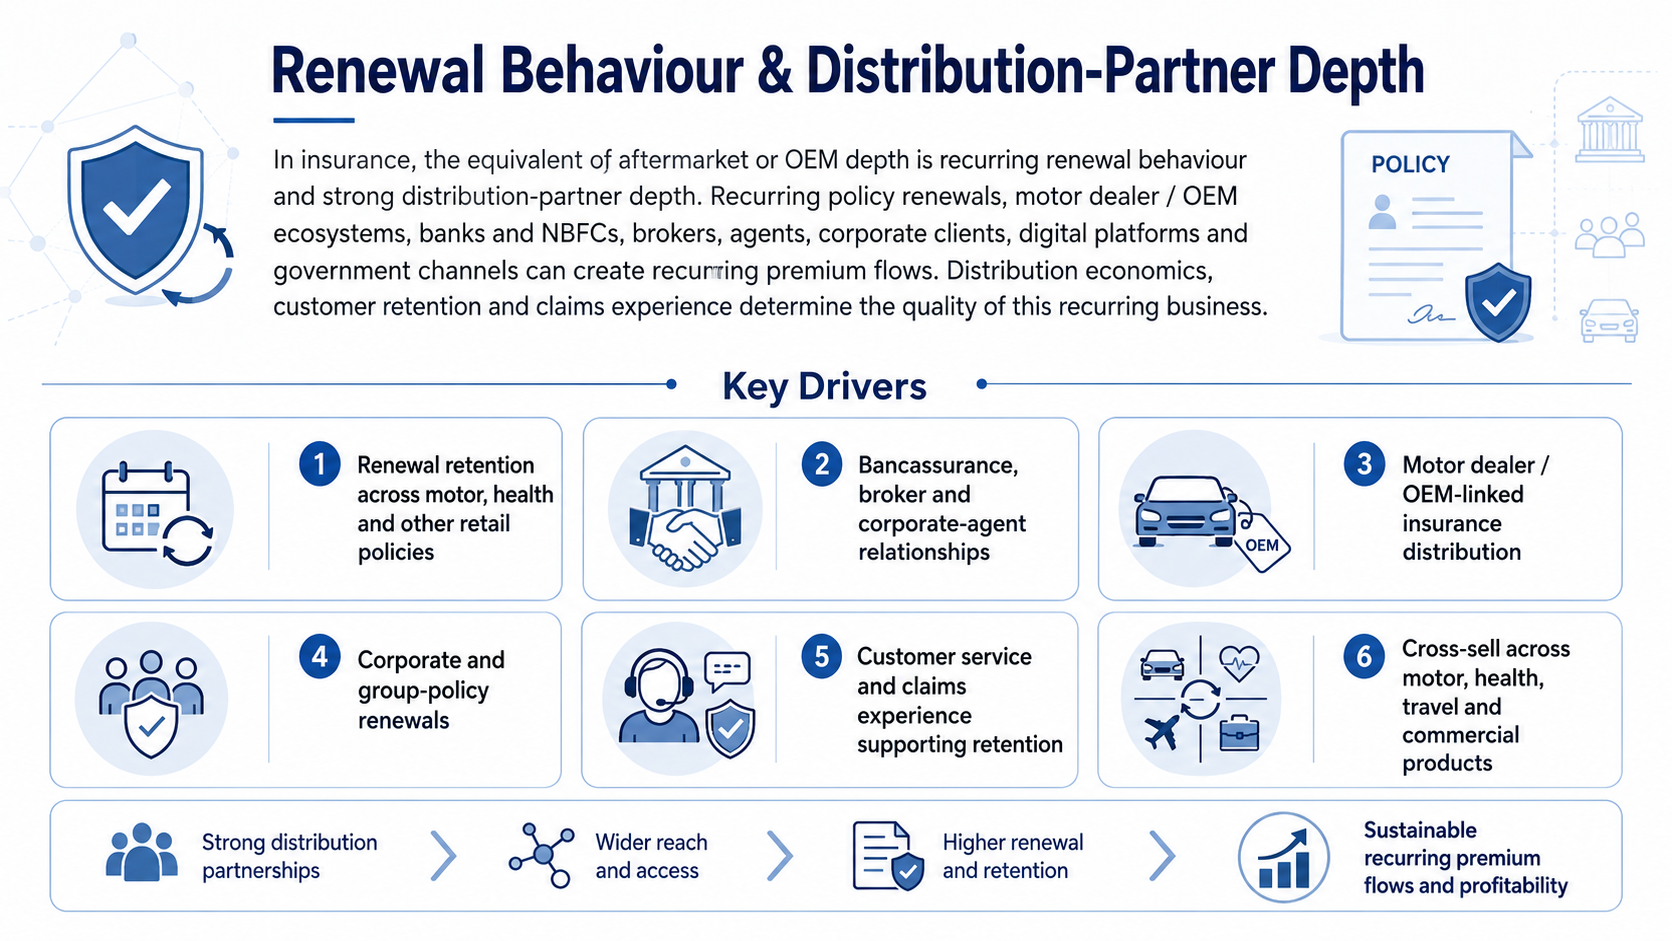
The insurance equivalent of aftermarket/OEM depth is renewal behaviour and distribution-partner depth. Recurring policy renewals, motor dealer/OEM ecosystems, banks and NBFCs, brokers, agents, corporate clients, digital platforms and government channels can create recurring premium flows. Distribution economics, customer retention and claims experience determine the quality of this recurring business.
Key Drivers
· Renewal retention across motor, health and other retail policies
· Bancassurance, broker and corporate-agent relationships
· Motor dealer / OEM-linked insurance distribution
· Corporate and group-policy renewals
· Customer service and claims experience supporting retention
· Cross-sell across motor, health, travel and commercial products
Government Policy Support
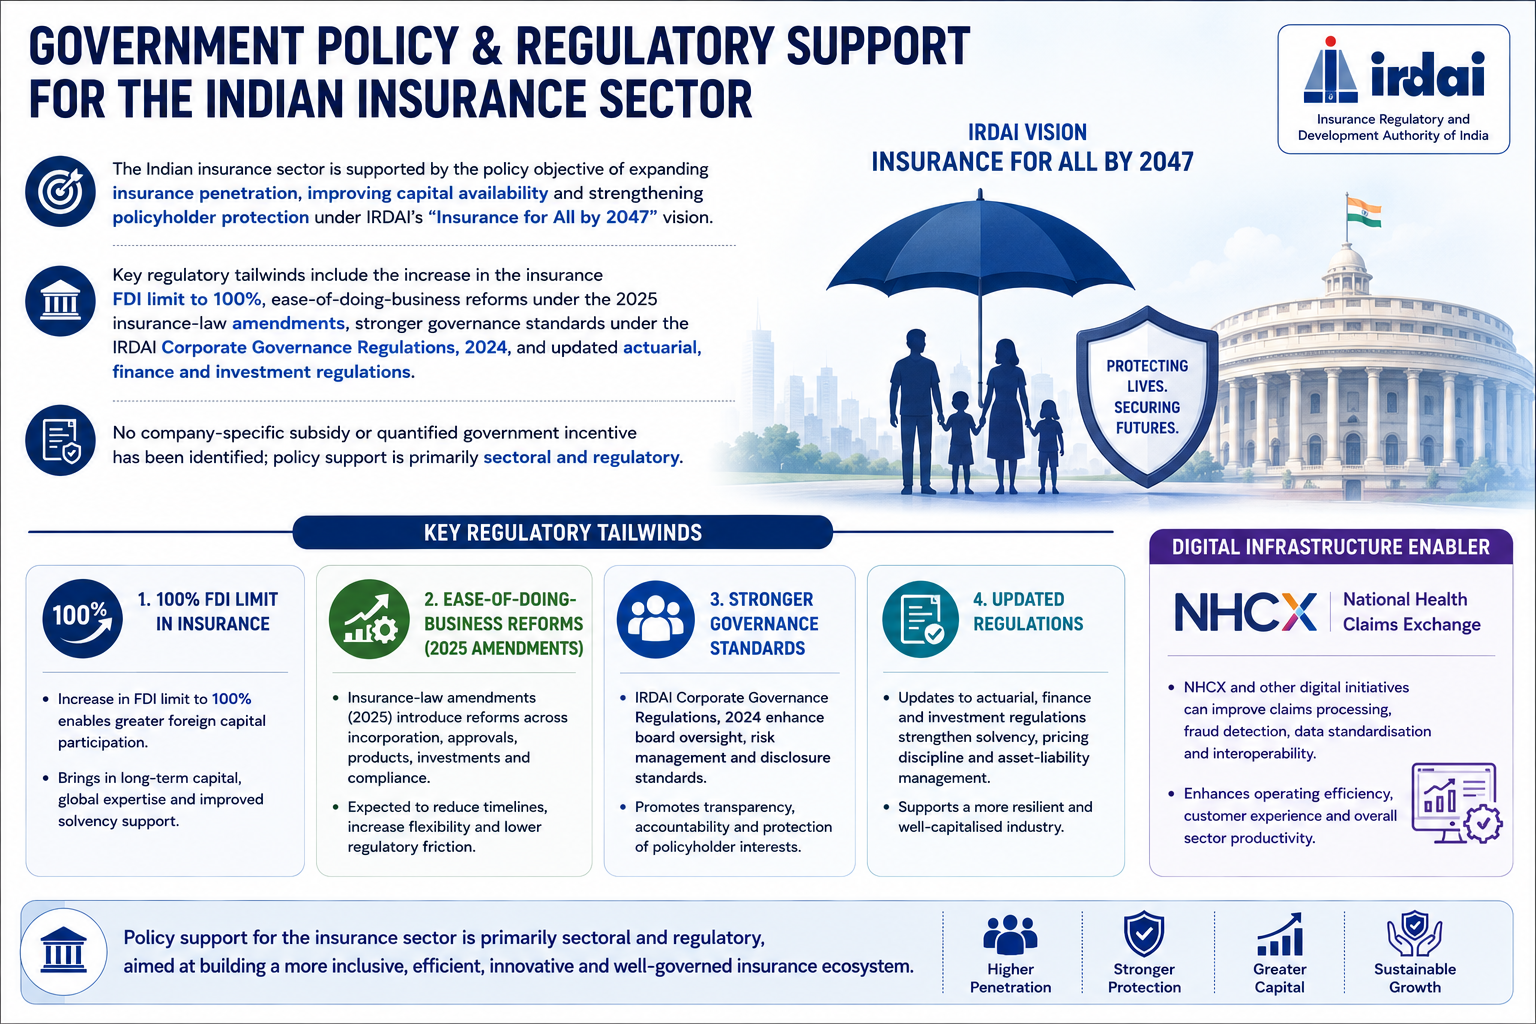
The Indian insurance sector is supported by the policy objective of expanding insurance penetration, improving capital availability and strengthening policyholder protection under IRDAI’s “Insurance for All by 2047” vision.
Key regulatory tailwinds include the increase in the insurance FDI limit to 100%, ease-of-doing-business reforms under the 2025 insurance-law amendments, stronger governance standards under the IRDAI Corporate Governance Regulations, 2024, and updated actuarial, finance and investment regulations. Digital infrastructure initiatives such as NHCX can also improve claims processing and operating efficiency.
No company-specific subsidy or quantified government incentive has been identified; policy support is primarily sectoral and regulatory.
- Overview
- Business
- Financial Highlights
- Industry Overview
- Documentation
Get the Preqt App and keep in touch around the clock!
 Monitor your investments in real-time.
- Receive tailored deal suggestions.
- Get real-time updates and alerts.
