

Inox Leasing and Finance Ltd. (ILFL)
Investing Across IndustriesStrategic Capital, Long-Term Value
Unlisted Review and Rating
Speculative
DRHP Not FiledOverall Recommendation
ILFL provides indirect exposure to strong underlying businesses in fluorochemicals, wind turbines, renewable-energy services and emerging battery materials. Consolidated revenue, EBITDA, PAT and operating cash flow improved substantially in FY25, while consolidated leverage remained manageable.
However, the P/E and P/B ratios include profits and net worth belonging to non-controlling shareholders, materially understating the valuation attributable to ILFL investors. On an ownership-adjusted basis, P/E increases to approximately 58.6x and P/B to approximately 3.8x. The proposed restructuring, involving demerger of the wind business and amalgamation of residual ILFL into Gujarat Fluorochemicals, could unlock value but creates structural and execution uncertainty until all approvals and final entitlement ratios are confirmed.
PARAMETER
WEIGHT
SCORE
KEY FACTORS
Financial Performance
33.0%
4.0/5
Strong margins, low consolidated leverage and positive cash generation are moderated by modest ROE and substantial minority ownership.
Show more
Detailed Analysis
Revenue increased from INR 6,330.4 crore in FY23 to INR 8,031.0 crore in FY25, representing a two-year CAGR of 12.6%
Consolidated EBITDA was approximately INR 2,065.2 crore, producing a strong EBITDA margin of 25.7%
Consolidated PAT of INR 951.8 crore represented an 11.9% margin, reflecting strong improvement over FY24
Consolidated borrowings of INR 2,660.1 crore against total equity of INR 13,532.7 crore produced a low 0.20x ratio
Consolidated ROE was approximately 8.1% on average equity, indicating moderate but suboptimal capital efficiency
Industry
33.0%
3.0/5
Diversified exposure to wind and fluorochemicals provides structural growth, export demand and technology-led barriers, alongside significant regulatory exposure
Show more
Detailed Analysis
Blended fluorochemical and wind-energy demand is expected to grow approximately 10–15% over the medium term
ILFL faces RBI oversight, while subsidiaries face environmental, chemical-safety, renewable-energy and manufacturing regulations
Approximately INR 2,792.6 crore, or 35% of FY25 product revenue, was generated outside India
Management
33.0%
3.0/5
Experienced promoters and established group businesses are offset by absent independent representation and extensive intra-group financial transactions
Show more
Detailed Analysis
The Jain family and INOX Group have more than 30 years of experience across finance, chemicals and renewable energy
The three-member ILFL Board had no independent director, resulting in independent representation below 33%
No promoter-share pledge or material litigation affecting ILFL’s financial position was identified in the reviewed reports
Group sales, deposits, financing and promoter-linked transactions were material and collectively exceeded 15% of consolidated revenue
TOTAL
100%
3.3/5
Weighted Composite Score
Per Share Price
₹22222.0
As of 14 Oct 2026
Lot Size
25.0 Shares
Minimum Investment
₹5,55,550.0 / 25 shares
Market Cap. (₹ Cr)
Revenue FY’26
PAT FY’26
P/E Multiple
Face Value
₹ 10.0Offer Price
₹ 21,500.0Lot Size
25.0 sharesSale Type
Secondary SalePAT FY’26
₹ 951.8 CrPAT Margin (%)
11.9 %P/E Multiple
23.2xCAGR Growth 3Y
20.1 %ROE (FY’26)
7.1 %ROCE (FY’26)
13.1 %Price to Book Value ratio
1.6xDebt/Equity (FY’26)
0.2xMerchant banker appointed
❌ NoCompany Website
ilfl.co.inDisclaimer: Unlisted shares are unregulated & illiquid. This is NOT investment advice. Please do your own due diligence before investing.
Minimum Investment
₹5,55,550.0 / 25 sharesShares Lot 25 X 1
Investment amount
₹5,55,550.0
Overview
Business
Business Model
Geographical Presence
Sales Channel
Key Risk Factor
Financial Highlights
Income Statement
Revenue growth with EBITDA and PAT margins
| Financial Metric | FY 2023 | FY 2024 | FY 2025 |
|---|---|---|---|
| Revenue (₹ Cr) | 6,330.4 | 5,577.9 | 8,031.1 |
| Growth (%) | 36.6% | -11.9% | 44.0% |
| EBITDA (₹ Cr) | 1,818.1 | 1,314.8 | 2,079.4 |
| EBITDA Margin (%) | 28.7% | 23.6% | 25.9% |
| PAT (₹ Cr) | 425.2 | 227.2 | 375.7 |
| PAT Margin (%) | 8.9% | 7.1% | 11.9% |
OBSERVATIONS & INSIGHTS
Revenue from operations expanded at a 12.6% CAGR between FY23 and FY25, despite an 11.9% decline in FY24
FY25 growth of 44.0% was driven primarily by wind-energy sales of ₹3,366.2 Cr, while fluoropolymers remained the largest chemicals category at ₹2,630.4 Cr
EBITDA margin recovered to 25.9% in FY25 from 23.6% in FY24, but remained below FY23's 28.7% level
Total PAT rose 140.9% in FY25, whereas owner-attributable PAT increased only 65.3%; non-controlling interests captured a substantial share of subsidiary earnings
The reported EPS series follows the audited statements. Because it tracks total consolidated PAT more closely than owner-attributable PAT, valuation analysis should also use the ownership-adjusted EPS of ₹379.5 for FY25
Balance Sheet
| Financial Metric | FY 2023 | FY 2024 | FY 2025 |
|---|---|---|---|
| EQUITY & LIABILITIES | ₹ 14,138.1 Cr | ₹ 15,863.9 Cr | ₹ 19,320.0 Cr |
| Net Worth | ₹ 8,580.9 Cr | ₹ 9,980.3 Cr | ₹ 13,532.7 Cr |
| Share Capital | ₹ 9.9 Cr | ₹ 9.9 Cr | ₹ 9.9 Cr |
| Reserves & Surplus | ₹ 8,571.0 Cr | ₹ 9,970.4 Cr | ₹ 13,522.8 Cr |
| Total Liabilities | ₹ 5,557.2 Cr | ₹ 5,883.6 Cr | ₹ 5,787.3 Cr |
| Current Liabilities | ₹ 5,557.2 Cr | ₹ 5,883.6 Cr | ₹ 5,787.3 Cr |
| Borrowings | ₹ 3,242.3 Cr | ₹ 3,477.0 Cr | ₹ 2,893.9 Cr |
| Trade Payables | ₹ 1,223.6 Cr | ₹ 1,022.2 Cr | ₹ 1,580.6 Cr |
| Other Current Liabilities | ₹ 1,091.3 Cr | ₹ 1,384.4 Cr | ₹ 1,312.8 Cr |
| Non-Current Liabilities | ₹ 0.0 Cr | ₹ 0.0 Cr | ₹ 0.0 Cr |
| Borrowings | ₹ 0.0 Cr | ₹ 0.0 Cr | ₹ 0.0 Cr |
| Other Non-Current Liabilities | ₹ 0.0 Cr | ₹ 0.0 Cr | ₹ 0.0 Cr |
| ASSETS | ₹ 14,138.0 Cr | ₹ 15,863.9 Cr | ₹ 19,319.9 Cr |
| Current Assets | ₹ 5,435.8 Cr | ₹ 5,842.1 Cr | ₹ 7,752.2 Cr |
| Trade Receivables | ₹ 1,864.2 Cr | ₹ 1,882.0 Cr | ₹ 3,797.2 Cr |
| Inventory | ₹ 2,615.5 Cr | ₹ 2,816.1 Cr | ₹ 3,172.1 Cr |
| Cash & Cash Equivalents | ₹ 46.8 Cr | ₹ 43.9 Cr | ₹ 76.3 Cr |
| Other Current Assets | ₹ 909.3 Cr | ₹ 1,100.1 Cr | ₹ 706.6 Cr |
| Non-Current Assets | ₹ 8,702.2 Cr | ₹ 10,021.8 Cr | ₹ 11,567.7 Cr |
| Fixed Assets | ₹ 6,100.0 Cr | ₹ 7,554.1 Cr | ₹ 8,419.3 Cr |
| Other Non-Current Assets | ₹ 2,602.2 Cr | ₹ 2,467.7 Cr | ₹ 3,148.4 Cr |
OBSERVATIONS & INSIGHTS
Total assets increased at a 16.9% CAGR from FY23 to FY25 and rose 21.8% in FY25
Shareholders' wealth increased 57.7% over two years while share capital remained ₹9.9 Cr, reflecting accumulated group earnings and non-controlling interests rather than new parent equity
Trade receivables more than doubled in FY25 to ₹3,797.2 Cr and became the largest current-asset movement, increasing collection risk
Gross borrowings fell 16.8% to ₹2,893.9 Cr, partially offsetting the working-capital and investment demands of the operating subsidiaries
Fixed assets increased 11.5% to ₹8,419.3 Cr, demonstrating the capital intensity of fluorochemicals and wind manufacturing
Cash and cash equivalents were only ₹76.3 Cr, or 0.4% of total assets, other bank balances are included within other current assets under the requested mapping
The audited maturity analysis places all liabilities within twelve months. The 0.0 Cr non-current lines therefore follow the filed classification and should be checked against instrument-level contractual maturities before investment
Cash Flow
| Financial Metric | FY 2023 | FY 2024 | FY 2025 |
|---|---|---|---|
CFO (₹ Cr) Cash generated from core business operations. | -344.9 Cr | +198.6 Cr | +556.9 Cr |
CFI (₹ Cr) Cash used for investments and long-term assets. | -616.0 Cr | -1,534.2 Cr | -2,679.6 Cr |
CFF (₹ Cr) Cash flow related to funding and borrowings. | +914.6 Cr | +1,333.7 Cr | +2,155.2 Cr |
Working Capital
| Efficiency Metric | FY 2023 | FY 2024 | FY 2025 |
|---|---|---|---|
Debtor Days Average number of days taken to collect customer payments. | - | - | - |
Creditor Days Average time taken to pay suppliers and vendors. | - | - | - |
Inventory Days Average number of days inventory remains unsold. | - | - | - |
CCC (Cash Conversion Cycle) (Debtor Days + Inventory Days - Creditor Days) | - | - | - |
Financial Ratios
Measures the company’s leverage relative to shareholder equity.
OBSERVATIONS & INSIGHTS
ROE and ROCE recovered in FY25 but did not return to FY23 levels, showing that the larger asset base still has utilisation headroom
Gross debt/equity improved to 0.2x and interest coverage strengthened to 5.1x as finance cost declined
The current ratio moved above 1.0x in FY25, supported by higher receivables and inventory rather than a large cash balance
Accounting returns and valuation multiples use different ownership bases unless explicitly adjusted; this is a central risk when analysing the supplied headline P/E and P/B
Industry Overview
Industry Drivers
Subsidiary Value Creation and Listed-Holdings NAV
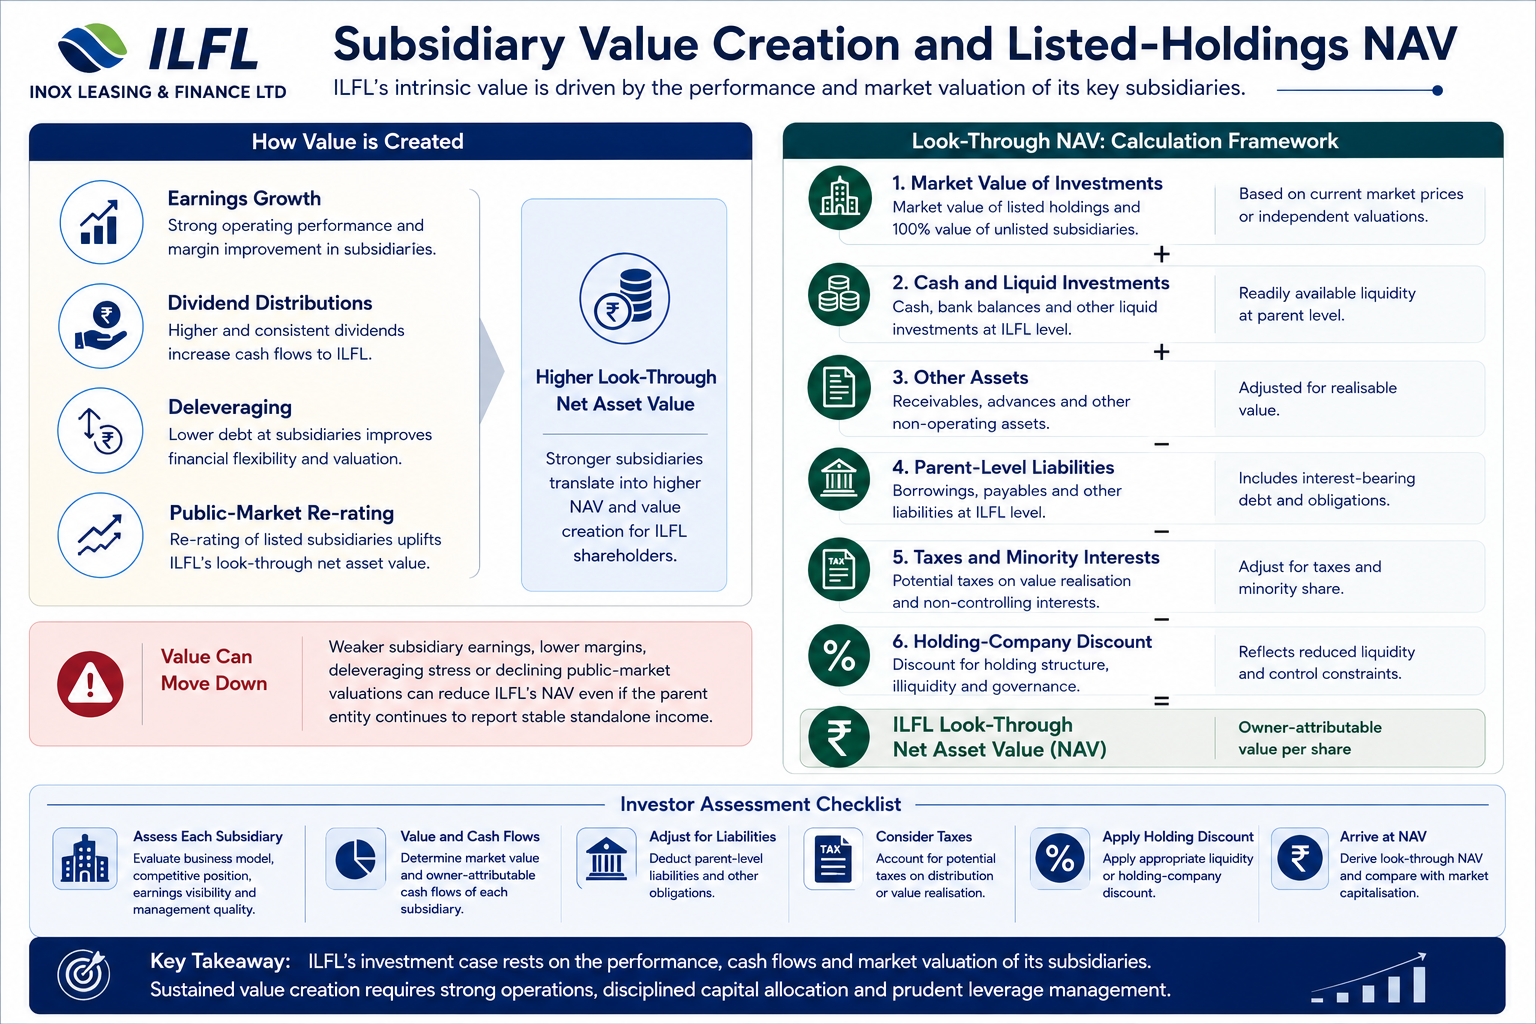
ILFL’s intrinsic value is primarily determined by its interests in the chemicals and wind-energy businesses. Earnings growth, dividend distributions, deleveraging and public-market re-rating of the underlying subsidiaries can increase the Company’s look-through net asset value
Conversely, weaker subsidiary valuations can reduce ILFL’s value even if the parent entity continues to report stable standalone income
Investors should assess the market value and owner-attributable cash flows of each subsidiary, after deducting parent-level liabilities, potential taxes and an appropriate liquidity or holding-company discount
Capital Allocation, Leverage and Holding-Company Discount
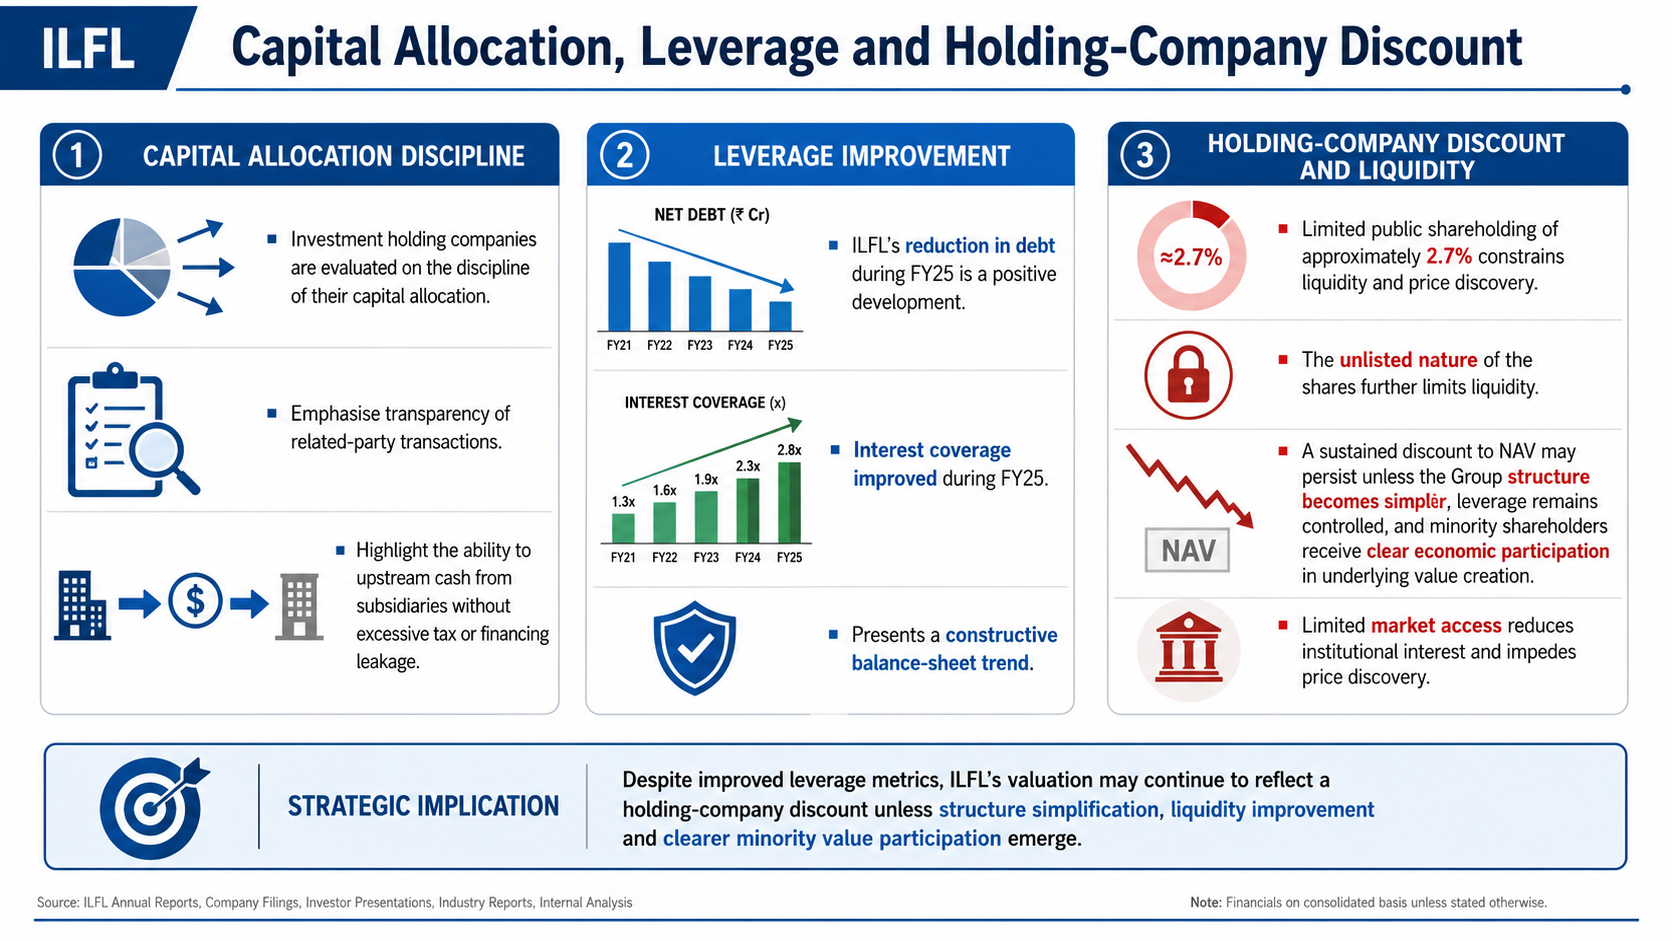
Investment holding companies are evaluated on the discipline of their capital allocation, transparency of related-party transactions and ability to upstream cash without excessive tax or financing leakage.
ILFL’s reduction in debt and improvement in interest coverage during FY25 are positive developments. However, the limited public shareholding of approximately 2.7% and the unlisted nature of the shares constrain liquidity and price discovery
A sustained discount to NAV may persist unless the Group structure becomes simpler, leverage remains controlled and minority shareholders receive clear economic participation in underlying value creation
Specialty Chemicals and Advanced-Materials Cycle
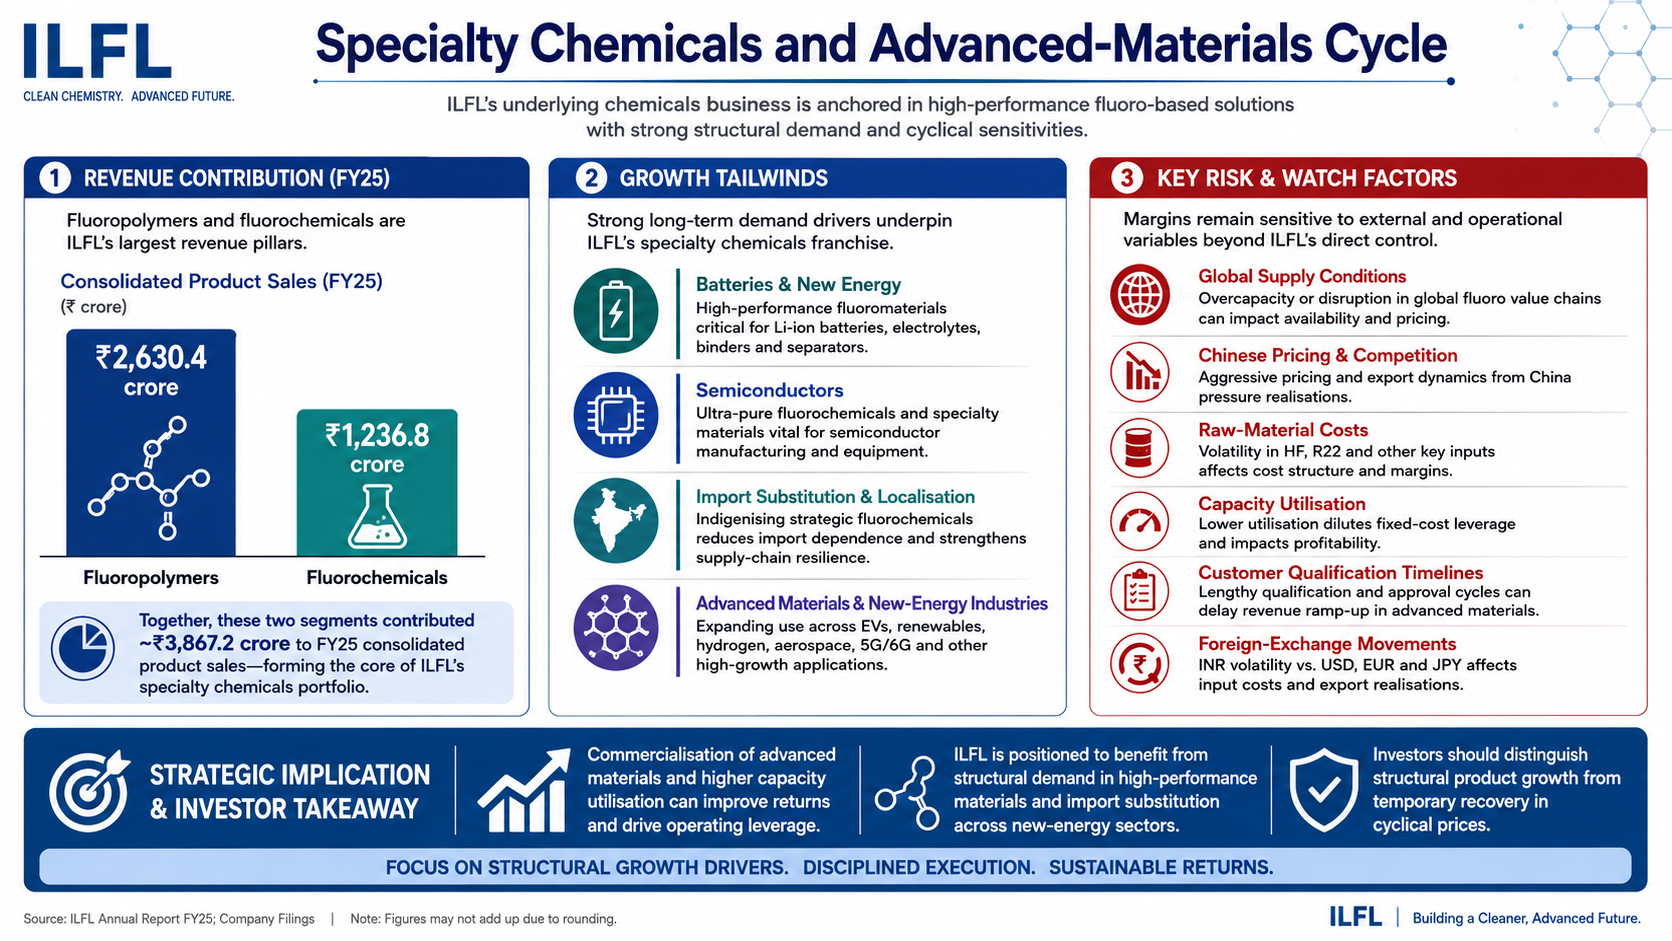
Fluoropolymers contributed approximately ₹2,630.4 crore and fluorochemicals contributed approximately ₹1,236.8 crore to FY25 consolidated product sales. Growth is supported by increasing demand for high-performance materials, import substitution and applications across batteries, semiconductors and other new-energy industries
However, margins remain sensitive to global supply conditions, Chinese pricing, raw-material costs, capacity utilisation, customer-qualification timelines and foreign-exchange movements
Commercialisation of advanced materials and higher capacity utilisation can improve returns, but investors should distinguish structural product growth from temporary recovery in cyclical prices
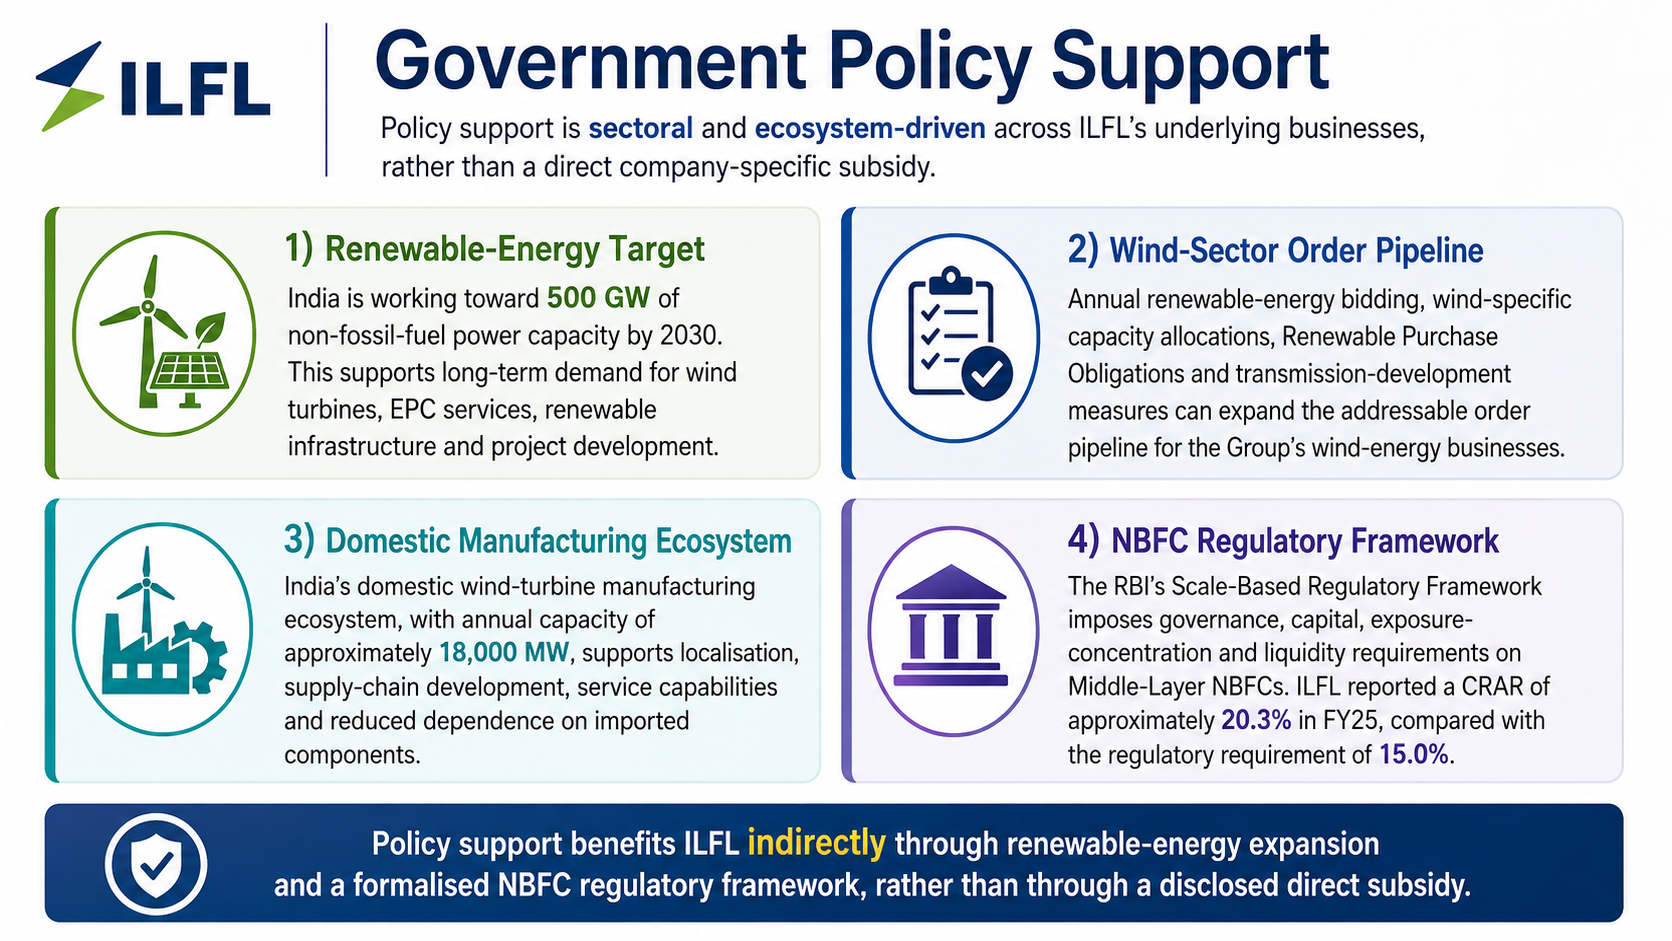
Government Policy Support
India is working toward achieving 500 GW of non-fossil-fuel power capacity by 2030. This target supports long-term demand for wind turbines, EPC services, renewable infrastructure and project development
Annual renewable-energy bidding, wind-specific capacity allocations, Renewable Purchase Obligations and transmission-development measures can expand the addressable order pipeline for the Group’s wind-energy businesses
India’s domestic wind-turbine manufacturing ecosystem, with annual capacity of approximately 18,000 MW, supports localisation, supply-chain development, service capabilities and reduced dependence on imported components
The RBI’s Scale-Based Regulatory Framework imposes governance, capital, exposure-concentration and liquidity requirements on Middle-Layer NBFCs. ILFL reported a CRAR of approximately 20.3% in FY25, compared with the regulatory requirement of 15.0%
- Overview
- Business
- Financial Highlights
- Industry Overview
- Documentation
Get the Preqt App and keep in touch around the clock!
 Monitor your investments in real-time.
- Receive tailored deal suggestions.
- Get real-time updates and alerts.
