

Kineco Ltd.
Composites for Critical ApplicationsPrecision Beyond Metals
IPO Review and Rating
Watchlist
Overall Recommendation
Kineco has genuine strengths in specialised composites, exports, operating margins, promoter experience and improving leverage. However, much of the recent growth was acquisition- or merger-assisted, FY25 operating cash flow weakened substantially, receivables and inventories increased, and significant profit belongs to non-controlling shareholders. The corrected P/E of approximately 328x and P/B of 19.6x leave little margin of safety
PARAMETER
WEIGHT
SCORE
KEY FACTORS
Financial Performance
25.0%
3.5/5
Revenue and margins improved sharply, but acquisition effects, weak shareholder profitability and receivable-led cash absorption temper the headline recovery
Show more
Detailed Analysis
Consolidated revenue increased from INR 167.2 crore in FY23 to INR 244.8 crore in FY25, representing approximately 21.0% CAGR
FY25 operating EBITDA was approximately INR 40.6 crore, giving a healthy 16.6% operating margin
Profit attributable to Kineco shareholders was INR 7.02 crore, producing a modest shareholder-adjusted margin of 2.9%
Consolidated debt fell substantially but remained approximately 0.5x total equity at FY25-end
Shareholder-attributable PAT divided by average parent equity produces an adjusted ROE of approximately 9.7%
Industry
25.0%
2.7/5
India’s composite-materials market is expected to grow from ₹15,577 crore in 2024 to ₹24,231 crore by 2030
Show more
Detailed Analysis
India’s composite-materials industry is projected to grow approximately 7.8% annually through 2030
Advanced composites remain in a growth stage, supported by aerospace, defence, railways, wind energy and infrastructure applications
The broader composites market is fragmented, although certifications and customer qualifications create barriers in specialised applications
Defence, aerospace and railway approvals are demanding, but domestic manufacturing and indigenisation policies provide meaningful support
Overseas sales reached INR 124.04 crore, representing approximately 51% of FY25 product and service revenue
Management
25.0%
3.5/5
Founder experience and modest operating related-party exposure are positives
Show more
Detailed Analysis
Founder-promoter Shekhar Sardessai has led Kineco since its establishment in 1995, providing approximately 30 years of industry experience
Kineco’s current website lists two independent directors among seven directors, or approximately 28.6%, below the 33% threshold
No continuing promoter-share pledge was identified for FY25, but the INR 8.18 crore MCF contractual dispute remains under appeal
Operating RPTs, including sales, purchases, finance costs and managerial remuneration, appear below approximately 5% of revenue
Valuation Metrics
25.0%
2.4/5
Stable indicative pricing cannot offset extremely high earnings and book multiples, especially after correcting shareholder-attributable profit
Show more
Detailed Analysis
P/E is 176.84x, but shareholder-attributable PAT implies approximately 328x—well above comparable aerospace and engineering companies
Implied EV/EBITDA is approximately 53–58x, around 1.1–1.3 times the median of selected listed engineering peers
19.60x P/B is correctly based on Kineco shareholders’ equity but is extremely expensive
TOTAL
100%
3.0/5
Weighted Composite Score
Per Share Price
₹3199.0
As of 14 Oct 2026
Lot Size
50.0 Shares
Minimum Investment
₹1,59,950.0 / 50 shares
Market Cap. (₹ Cr)
Revenue FY’25
PAT FY’25
P/E Multiple
Face Value
₹ 10.0Lot Size
50.0 sharesPAT FY’25
₹ 7.0 CrPAT Margin (%)
2.9 %P/E Multiple
176.8xCAGR Growth 2Y
21.0 %ROE (FY’26)
9.6 %ROCE (FY’26)
14.9 %Price to Book Value ratio
19.6xDebt/Equity (FY’26)
0.5xMerchant banker appointed
❌ NoCompany Website
www.kinecogroup.com/index.phpDisclaimer: Unlisted shares are unregulated & illiquid. This is NOT investment advice. Please do your own due diligence before investing.
Minimum Investment
₹1,59,950.0 / 50 sharesShares Lot 50 X 1
Investment amount
₹1,59,950.0
Overview
Business
Products
Business Model
Geographical Presence
Sales Channel
Financial Highlights
Income Statement
Revenue growth with EBITDA and PAT margins
| Financial Metric | FY 2023 | FY 2024 | FY 2025 |
|---|---|---|---|
| Revenue (₹ Cr) | 167.2 | 174.5 | 244.9 |
| Growth (%) | 0.0% | 4.4% | 40.3% |
| EBITDA (₹ Cr) | 8.9 | 31.8 | 44.2 |
| EBITDA Margin (%) | 5.3% | 18.2% | 18.0% |
| PAT (₹ Cr) | -8.5 | 7.7 | 13.1 |
| PAT Margin (%) | -5.1% | 4.4% | 5.3% |
OBSERVATIONS & INSIGHTS
Revenue grew 40.3% in FY25 after 4.4% growth in FY24, producing a 21.0% two-year CAGR from FY23 to FY25
The group moved from a ₹8.5 Cr FY23 loss to ₹7.7 Cr PAT in FY24 and ₹13.1 Cr in FY25. EBITDA margin recovered sharply in FY24 and remained broadly stable at 18.0% in FY25
FY25 diluted EPS of ₹18.1 is an audited per-share figure based on the applicable weighted-average share count and profit attribution; it should not be recomputed mechanically from year-end share capital and total group PAT
FY25 includes major ownership and business-combination changes, including full control and merger accounting for Kineco Kaman and the acquisition of Semvac. Organic and acquired growth should be separated in diligence
Balance Sheet
| Financial Metric | FY 2024 | FY 2025 |
|---|---|---|
| EQUITY & LIABILITIES | ₹ 265.6 Cr | ₹ 357.7 Cr |
| Net Worth | ₹ 51.9 Cr | ₹ 157.1 Cr |
| Share Capital | ₹ 6.3 Cr | ₹ 7.2 Cr |
| Reserves & Surplus | ₹ 45.6 Cr | ₹ 149.9 Cr |
| Total Liabilities | ₹ 213.7 Cr | ₹ 200.6 Cr |
| Current Liabilities | ₹ 161.6 Cr | ₹ 176.0 Cr |
| Borrowings | ₹ 83.2 Cr | ₹ 69.5 Cr |
| Trade Payables | ₹ 45.8 Cr | ₹ 67.1 Cr |
| Other Current Liabilities | ₹ 32.6 Cr | ₹ 39.4 Cr |
| Non-Current Liabilities | ₹ 52.1 Cr | ₹ 24.6 Cr |
| Borrowings | ₹ 37.0 Cr | ₹ 11.4 Cr |
| Other Non-Current Liabilities | ₹ 15.1 Cr | ₹ 13.2 Cr |
| ASSETS | ₹ 265.6 Cr | ₹ 357.5 Cr |
| Current Assets | ₹ 179.4 Cr | ₹ 258.0 Cr |
| Trade Receivables | ₹ 89.0 Cr | ₹ 115.1 Cr |
| Inventory | ₹ 39.2 Cr | ₹ 77.1 Cr |
| Cash & Cash Equivalents | ₹ 11.6 Cr | ₹ 29.1 Cr |
| Other Current Assets | ₹ 39.6 Cr | ₹ 36.7 Cr |
| Non-Current Assets | ₹ 86.2 Cr | ₹ 99.5 Cr |
| Fixed Assets | ₹ 73.6 Cr | ₹ 93.0 Cr |
| Other Non-Current Assets | ₹ 12.6 Cr | ₹ 6.5 Cr |
OBSERVATIONS & INSIGHTS
The consolidated balance sheet grew 34.6% to ₹357.6 Cr, with increases concentrated in inventory, receivables, cash and fixed / intangible assets
Shareholders' wealth increased to ₹157.1 Cr from ₹51.9 Cr, reflecting capital issuance, securities premium, earnings and business-combination adjustments. The increase is not attributable to retained profit alone
Current and non-current borrowings declined by ₹39.4 Cr to ₹80.9 Cr. Non-current borrowings fell particularly sharply after redemption and repayment activity
Inventory and trade receivables totalled ₹192.2 Cr, equal to 53.7% of total assets. Ageing, customer concentration, contract milestones and inventory recoverability are therefore critical diligence areas
Cash Flow
| Financial Metric | FY 2024 | FY 2025 |
|---|---|---|
CFO (₹ Cr) Cash generated from core business operations. | +55.0 Cr | +3.1 Cr |
CFI (₹ Cr) Cash used for investments and long-term assets. | -18.9 Cr | -28.8 Cr |
CFF (₹ Cr) Cash flow related to funding and borrowings. | -28.0 Cr | +37.7 Cr |
Working Capital
| Efficiency Metric | FY 2023 | FY 2024 | FY 2025 |
|---|---|---|---|
Debtor Days Average number of days taken to collect customer payments. | - | - | - |
Creditor Days Average time taken to pay suppliers and vendors. | - | - | - |
Inventory Days Average number of days inventory remains unsold. | - | - | - |
CCC (Cash Conversion Cycle) (Debtor Days + Inventory Days - Creditor Days) | - | - | - |
Financial Ratios
Measures the company’s leverage relative to shareholder equity.
OBSERVATIONS & INSIGHTS
Debt / equity declined from 2.3x to 0.5x, debt / EBITDA fell from 3.8x to 1.8x and interest coverage improved from 1.9x to 3.7x
FY25 ROE was 9.6% despite higher profit because securities premium, merger adjustments and capital issuance materially increased average parent equity
The 14.9% analytical ROCE and 4.2% ROA are affected by acquisitions and business-combination accounting
Industry Overview
Industry Drivers
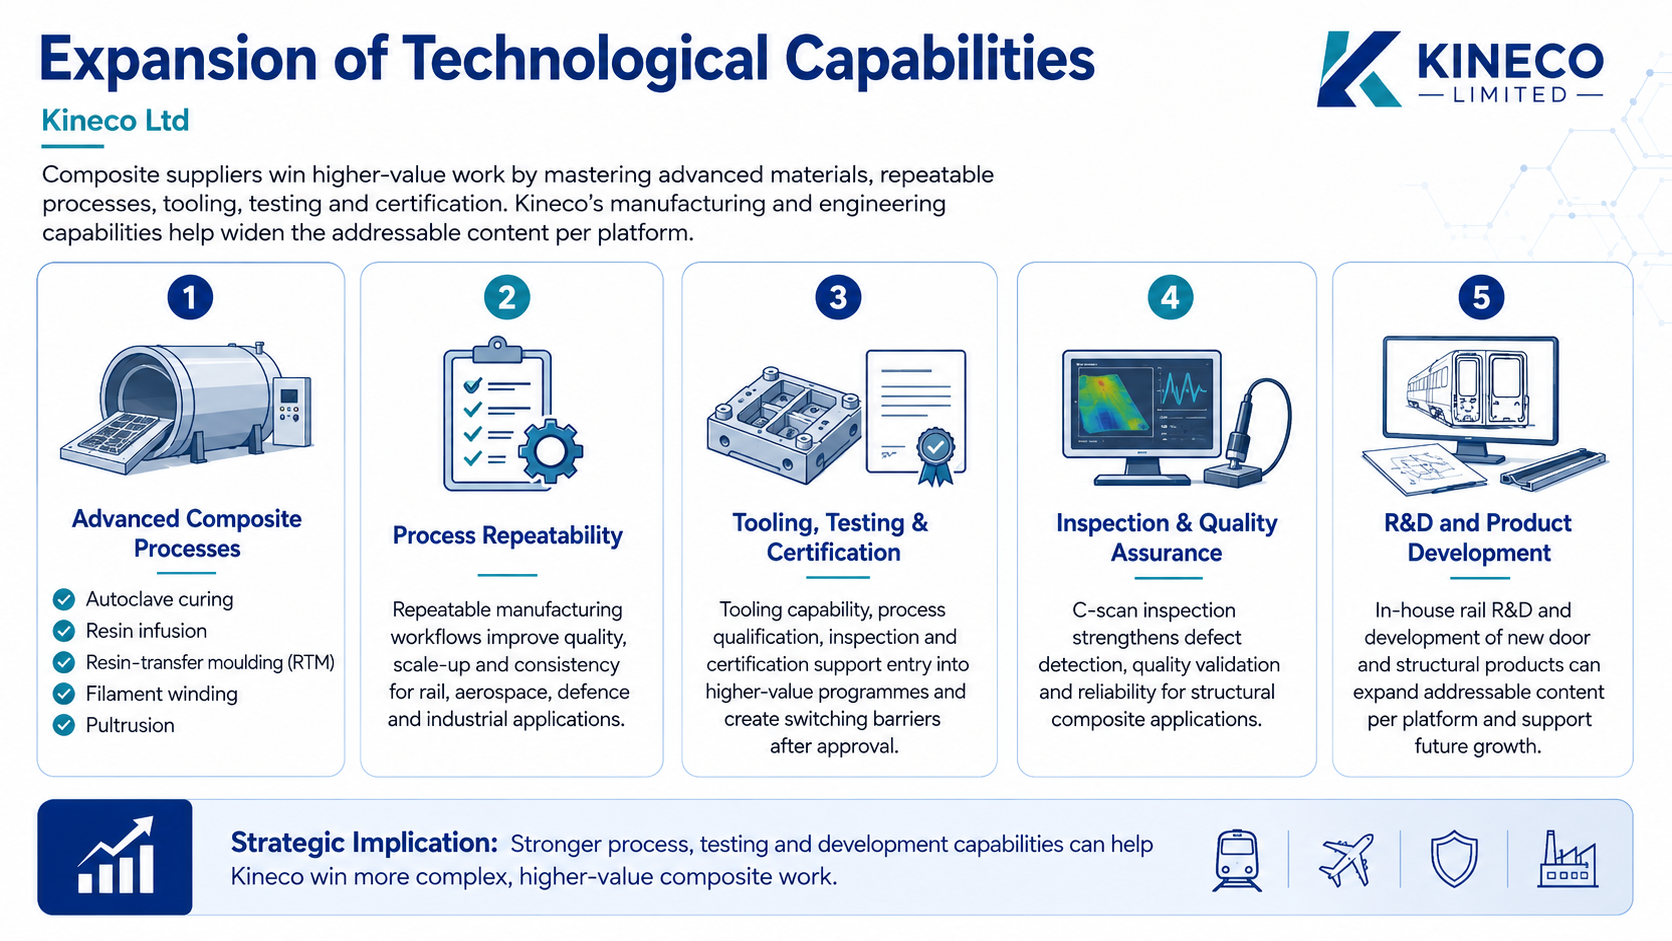
Expansion of Technological Capabilities
Composite suppliers win higher-value work by mastering advanced materials, repeatable processes, tooling, testing and certification
Kineco's capabilities include autoclave curing, resin infusion, resin-transfer moulding, filament winding and pultrusion
Its in-house rail R&D, C-scan inspection and development of new door and structural products can widen addressable content per platform
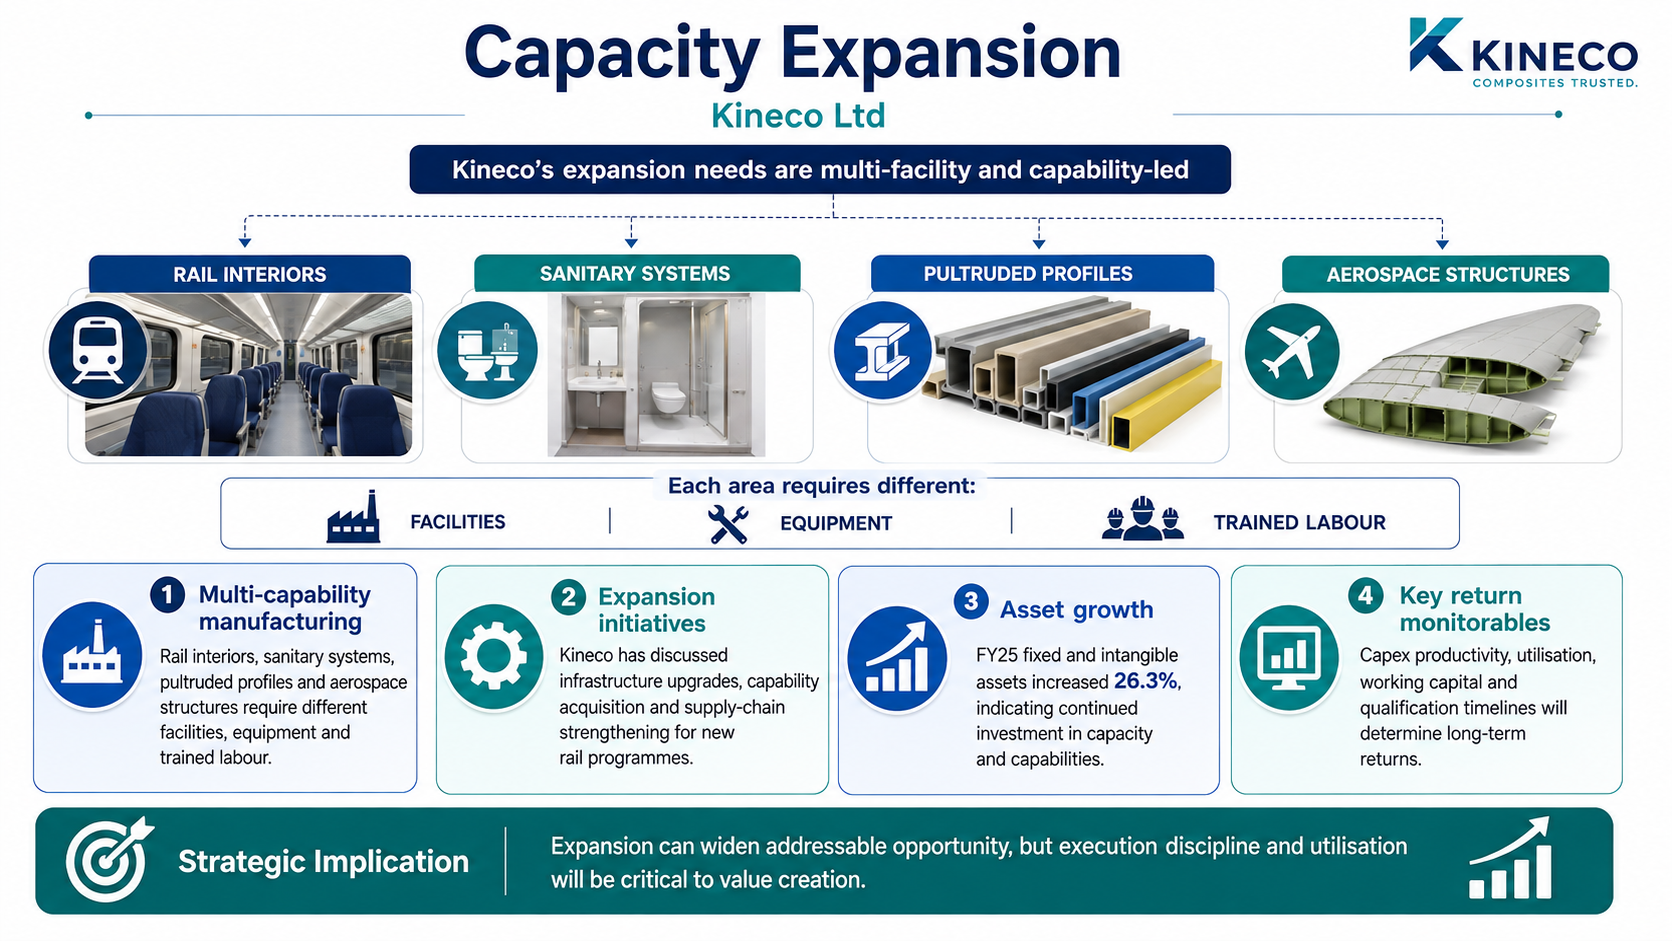
Capacity Expansion
Rail interiors, sanitary systems, pultruded profiles and aerospace structures require different facilities, equipment and trained labour
Kineco has discussed infrastructure upgrades, capability acquisition and supply-chain strengthening for new rail programmes
FY25 fixed and intangible assets increased 26.3%, but capex productivity, utilisation, working capital and qualification timelines will determine returns
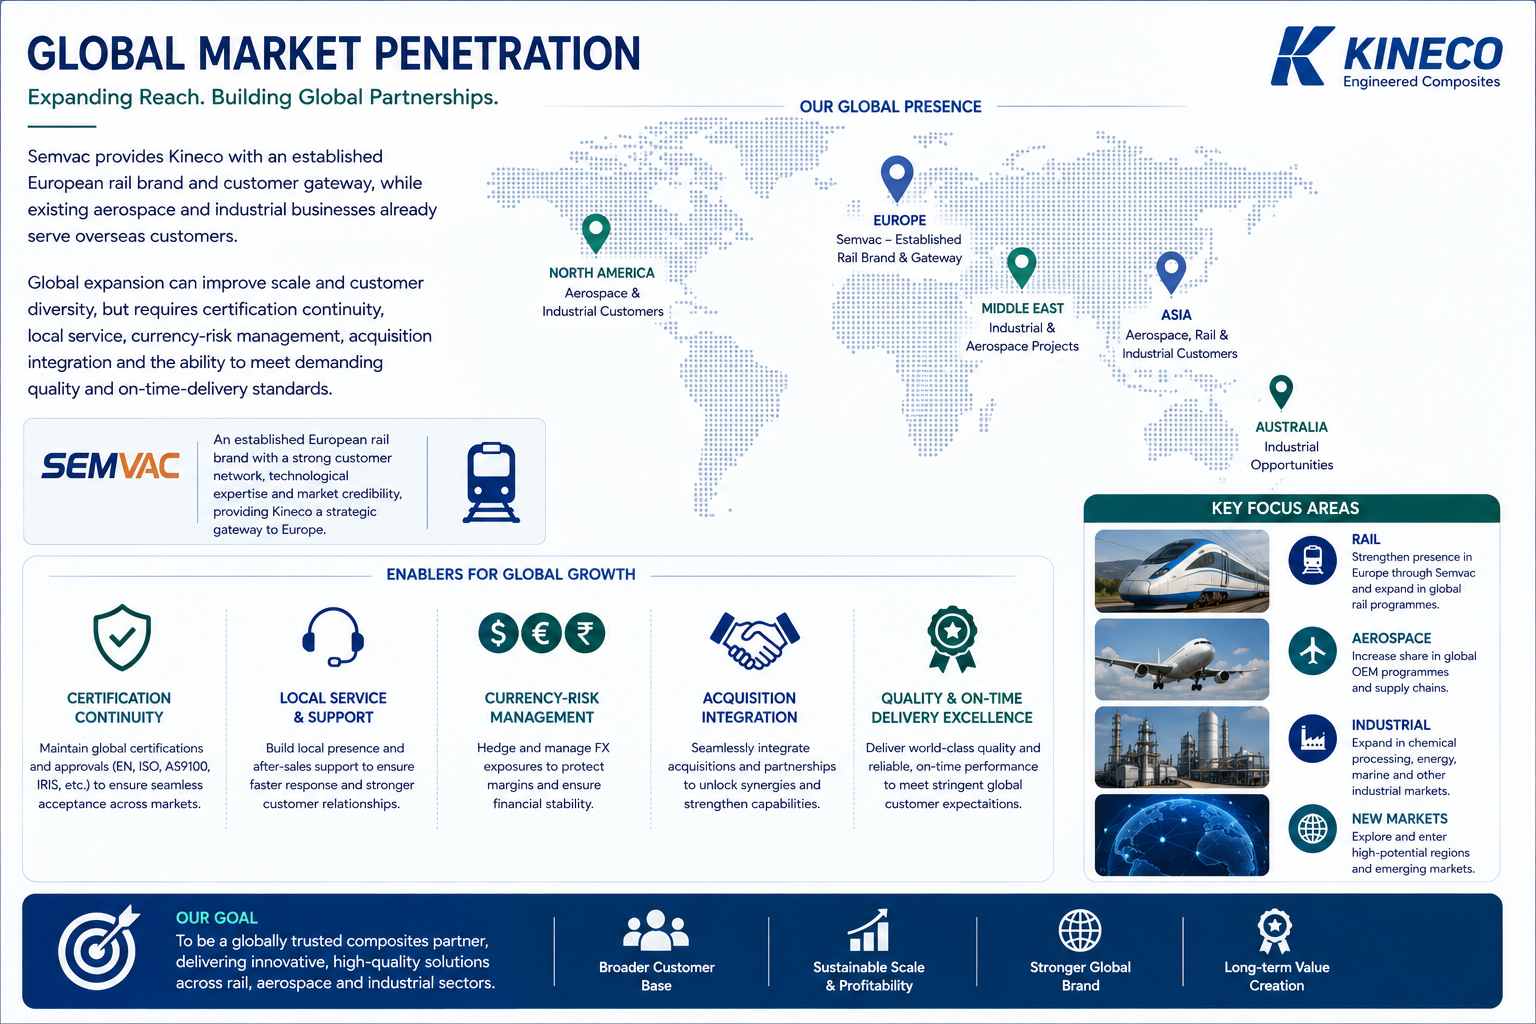
Global Market Penetration
Semvac provides Kineco with an established European rail brand and customer gateway, while existing aerospace and industrial businesses already serve overseas customers
Global expansion can improve scale and customer diversity, but requires certification continuity, local service, currencyrisk management, acquisition integration and the ability to meet demanding quality and on-time-delivery standards
Government Policy Support
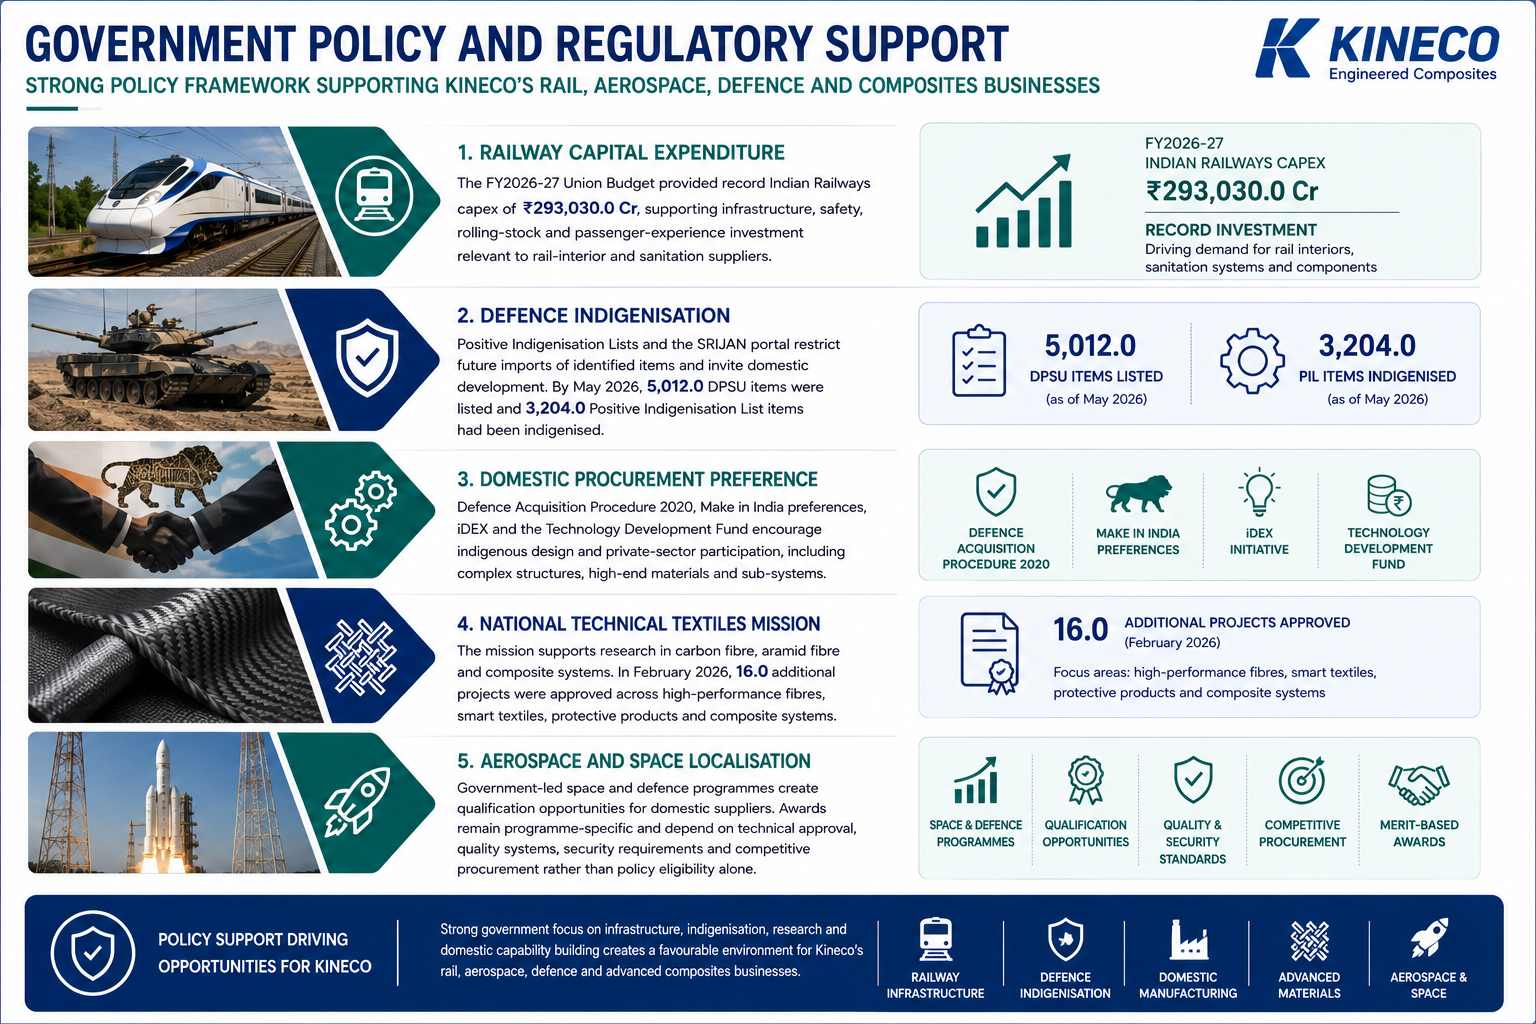
Railway capital expenditure: The FY2026-27 Union Budget provided record Indian Railways capex of ₹293,030.0 Cr, supporting infrastructure, safety, rolling-stock and passenger-experience investment relevant to rail-interior and sanitation suppliers
Defence indigenisation: Positive Indigenisation Lists and the SRIJAN portal restrict future imports of identified items and invite domestic development. By May 2026, 5,012.0 DPSU items were listed and 3,204.0 Positive Indigenisation List items had been indigenised
Domestic procurement preference: Defence Acquisition Procedure 2020, Make in India preferences, iDEX and the Technology Development Fund encourage indigenous design and private-sector participation, including complex structures, high-end materials and sub-systems
National Technical Textiles Mission: The mission supports research in carbon fibre, aramid fibre and composite systems. In February 2026, 16.0 additional projects were approved across high-performance fibres, smart textiles, protective products and composite systems
Aerospace and space localisation: Government-led space and defence programmes create qualification opportunities for domestic suppliers. Awards remain programme-specific and depend on technical approval, quality systems, security requirements and competitive procurement rather than policy eligibility alone
- Overview
- Business
- Financial Highlights
- Industry Overview
- Documentation
Get the Preqt App and keep in touch around the clock!
 Monitor your investments in real-time.
- Receive tailored deal suggestions.
- Get real-time updates and alerts.
