
Lakeshore Hospital and Research Centre Ltd.
Care Beyond ExpectationsExpertise That Restores
IPO Review and Rating
Strong Buy
DRHP FiledOverall Recommendation
PARAMETER
WEIGHT
SCORE
KEY FACTORS
Financial Performance
25.0%
4.0/5
Strong margins, rising earnings, healthy operating cash flow and virtually no financial leverage make the financial profile one of Lakeshore's biggest strengths.
Show more
Detailed Analysis
FY26 revenue increased 11.1%, with FY24 to FY26 CAGR of 6.9%. Growth has accelerated after a relatively flat FY25
EBITDA margin improved from 19.4% to 21.9%, indicating better operating leverage and profitability
PAT margin recovered to 11.7%, while PAT increased 35.6% to INR 53.1 Cr
The Company has no conventional bank borrowings and carries only limited lease liabilities
FY26 ROE improved to approximately 12.1%, a respectable return given the debt-free capital structure
CFO remained strong at INR 56.5 Cr, exceeding FY26 PAT and demonstrating healthy cash conversion
Industry
25.0%
3.0/5
The sector offers strong structural demand, but Lakeshore's current scale is much smaller and geographically more concentrated than India's largest listed hospital chains
Show more
Detailed Analysis
Increasing healthcare utilisation, specialised procedures and higher patient inflows provide a strong structural demand base
Organised tertiary and super-speciality healthcare remains structurally attractive and benefits from growing preference for organised hospital chains
Hospitals face intensive clinical, pricing, tax, labour and accreditation requirements, although these also create barriers to entry
Management
25.0%
3.0/5
Governance is reasonably strong for an unlisted company, with meaningful promoter ownership, independent committee oversight, clean audit reporting and professional management.
Show more
Detailed Analysis
Promoter ownership is substantial and senior leadership has been strengthened with healthcare and financial professionals
The Board has two Independent Directors, while key committees have strong independent representation, although overall Board independence remains modest
FY26 accounts carry an unmodified audit opinion and internal financial controls were also reported as adequate and effective
Management reports RPTs as ordinary-course and arm's-length with no materially conflicting transactions, although promoter-linked healthcare entities remain part of the ecosystem
Valuation Metrics
25.0%
4.0/5
The large discount to the supplied 40.0x industry P/E therefore appears attractive. However, part of the discount is justified because Lakeshore remains predominantly a single major hospital platform, has significantly lower scale than listed chains, and its shares lack listed-market liquidity
Show more
Detailed Analysis
At 17.5x, Lakeshore trades at approximately a 56.2% discount to the supplied industry P/E of 40.0x
2.0x P/B and 2.0x P/S appear reasonable given double-digit ROE, strong margins and debt-free operations
CFO exceeds PAT and earnings improved materially in FY26, providing good support for the valuation
Limited secondary-market liquidity and lack of exchange price discovery justify a meaningful discount to listed hospital peers
TOTAL
100%
3.5/5
Weighted Composite Score
Lot Size
300.0 Shares
Minimum Investment
₹28,740.0 / 300 shares
Market Cap. (₹ Cr)
Revenue FY’26
PAT FY’26
P/E Multiple
Face Value
₹ 10.0Offer Price
₹ 95.8Lot Size
300.0 sharesSale Type
Secondary SalePAT Margin (%)
11.7 %CAGR Growth 3Y
6.9 %ROE (FY’26)
12.0 %ROCE (FY’26)
16.0 %Price to Book Value ratio
2.0xDebt/Equity (FY’26)
0.0xMerchant banker appointed
❌ NoCompany Website
www.vpslakeshorehospital.comDisclaimer: Unlisted shares are unregulated & illiquid. This is NOT investment advice. Please do your own due diligence before investing.
Minimum Investment
₹28,740.0 / 300 sharesShares Lot 300 X 1
Investment amount
₹28,740.0
Overview
Business
Business Model
Geographical Presence
Sales Channel
Key Risk Factor
Financial Highlights
Income Statement
Revenue growth with EBITDA and PAT margins
| Financial Metric | FY 2024 | FY 2025 | FY 2026 |
|---|---|---|---|
| Revenue (₹ Cr) | 396.2 | 407.5 | 452.7 |
| Growth (%) | 0.0% | 2.9% | 11.1% |
| EBITDA (₹ Cr) | 79.6 | 79.1 | 99.2 |
| EBITDA Margin (%) | 20.1% | 19.4% | 21.9% |
| PAT (₹ Cr) | 43.9 | 39.1 | 53.1 |
| PAT Margin (%) | 11.1% | 9.6% | 11.7% |
OBSERVATIONS & INSIGHTS
Revenue growth accelerated to 11.1% in FY26 after a modest 2.9% increase in FY25. The two-year revenue CAGR from FY24 to FY26 was 6.9%. Management linked FY26 progress to rising inpatient discharges, outpatient volumes, emergency activity and clinical expansion. Growth was broad enough to lift pharmacy, diagnostics and healthcare-service revenue, which reduced the risk that the improvement came from a single small revenue category
EBITDA was broadly flat at INR 79.1 Cr in FY25 because growth in employee costs, depreciation and other operating expenses absorbed the revenue increase. FY26 EBITDA increased to INR 99.2 Cr and the margin improved to 21.9%. The expansion indicates better operating leverage and case activity, although management must sustain utilisation while funding senior talent, compliance, renovation and technology investment
PAT fell by 10.8% in FY25 and then increased by 35.7% in FY26 to INR 53.1 Cr. The FY24 to FY26 PAT CAGR was 10.0%. FY26 finance costs remained immaterial, so the profit improvement primarily reflected operating performance rather than leverage. The FY26 PAT margin of 11.7% exceeded the FY24 level of 11.1%, providing evidence of a stronger earnings year rather than only balance-sheet support
Balance Sheet
| Financial Metric | FY 2024 | FY 2025 | FY 2026 |
|---|---|---|---|
| EQUITY & LIABILITIES | ₹ 507.6 Cr | ₹ 533.3 Cr | ₹ 553.3 Cr |
| Net Worth | ₹ 400.2 Cr | ₹ 422.2 Cr | ₹ 455.7 Cr |
| Share Capital | ₹ 100.0 Cr | ₹ 100.0 Cr | ₹ 100.0 Cr |
| Reserves & Surplus | ₹ 300.2 Cr | ₹ 322.2 Cr | ₹ 355.7 Cr |
| Total Liabilities | ₹ 107.4 Cr | ₹ 111.1 Cr | ₹ 97.6 Cr |
| Current Liabilities | ₹ 68.6 Cr | ₹ 71.6 Cr | ₹ 64.7 Cr |
| Borrowings | ₹ 0.0 Cr | ₹ 0.0 Cr | ₹ 0.0 Cr |
| Trade Payables | ₹ 32.8 Cr | ₹ 38.7 Cr | ₹ 28.0 Cr |
| Other Current Liabilities | ₹ 35.8 Cr | ₹ 32.9 Cr | ₹ 36.7 Cr |
| Non-Current Liabilities | ₹ 38.8 Cr | ₹ 39.5 Cr | ₹ 32.9 Cr |
| Borrowings | ₹ 0.0 Cr | ₹ 0.0 Cr | ₹ 0.0 Cr |
| Other Non-Current Liabilities | ₹ 38.8 Cr | ₹ 39.5 Cr | ₹ 32.9 Cr |
| ASSETS | ₹ 507.6 Cr | ₹ 533.3 Cr | ₹ 553.3 Cr |
| Current Assets | ₹ 123.6 Cr | ₹ 161.1 Cr | ₹ 166.9 Cr |
| Trade Receivables | ₹ 26.9 Cr | ₹ 33.9 Cr | ₹ 56.8 Cr |
| Inventory | ₹ 10.7 Cr | ₹ 10.9 Cr | ₹ 10.6 Cr |
| Cash & Cash Equivalents | ₹ 9.9 Cr | ₹ 44.5 Cr | ₹ 45.6 Cr |
| Other Current Assets | ₹ 76.1 Cr | ₹ 71.8 Cr | ₹ 53.9 Cr |
| Non-Current Assets | ₹ 384.0 Cr | ₹ 372.2 Cr | ₹ 386.4 Cr |
| Fixed Assets | ₹ 352.6 Cr | ₹ 350.9 Cr | ₹ 361.6 Cr |
| Other Non-Current Assets | ₹ 31.4 Cr | ₹ 21.3 Cr | ₹ 24.8 Cr |
OBSERVATIONS & INSIGHTS
Net worth increased from INR 400.2 Cr in FY24 to INR 455.7 Cr in FY26, representing two-year growth of 13.9%. The increase was entirely driven by reserves and surplus, which rose from INR 300.2 Cr to INR 355.7 Cr, while share capital remained unchanged at INR 100.0 Cr. This indicates that retained earnings continued to strengthen the capital base
The company had no material external borrowings during FY24, FY25 or FY26. Total liabilities declined from INR 111.1 Cr in FY25 to INR 97.5 Cr in FY26. The reduction was mainly supported by lower trade payables and non-current provisions, providing the company with a relatively conservative balance sheet and limited refinancing exposure
Trade receivables increased from INR 26.9 Cr in FY24 to INR 56.8 Cr in FY26, representing growth of 111.4%. The largest increase occurred in FY26, when receivables rose by 67.4%. The annual report attributed the increase in debtor days to pending contractual reconciliations and billing disputes with insurance companies. This remains the principal working-capital risk
Cash and cash equivalents increased from INR 9.9 Cr in FY24 to INR 45.6 Cr in FY26. However, after including other bank balances, total cash and bank balances declined from INR 106.3 Cr in FY25 to INR 86.1 Cr in FY26. The company nevertheless maintained a strong liquidity position, supported by negligible borrowings and current assets of INR 166.8 Cr
Fixed assets increased from INR 350.9 Cr in FY25 to INR 361.6 Cr in FY26, reflecting additions to medical equipment, hospital infrastructure and ongoing renovation projects. Inventory remained stable at approximately INR 10.6 Cr to INR 10.9 Cr across the period, indicating that asset growth was primarily associated with clinical capacity and infrastructure rather than inventory accumulation
Cash Flow
| Financial Metric | FY 2024 | FY 2025 | FY 2026 |
|---|---|---|---|
CFO (₹ Cr) Cash generated from core business operations. | +44.1 Cr | +68.3 Cr | +56.5 Cr |
CFI (₹ Cr) Cash used for investments and long-term assets. | -39.3 Cr | -15.8 Cr | -34.3 Cr |
CFF (₹ Cr) Cash flow related to funding and borrowings. | -31.5 Cr | -17.9 Cr | -21.0 Cr |
Working Capital
| Efficiency Metric | FY 2023 | FY 2024 | FY 2025 |
|---|---|---|---|
Debtor Days Average number of days taken to collect customer payments. | - | - | - |
Creditor Days Average time taken to pay suppliers and vendors. | - | - | - |
Inventory Days Average number of days inventory remains unsold. | - | - | - |
CCC (Cash Conversion Cycle) (Debtor Days + Inventory Days - Creditor Days) | - | - | - |
Financial Ratios
Measures the company’s leverage relative to shareholder equity.
OBSERVATIONS & INSIGHTS
Profitability ratios weakened in FY25 and recovered in FY26. ROE increased to 12.0% and ROCE increased to 16.0%, while the debt-to-equity ratio remained effectively nil. The improvement is supported by higher earnings rather than financial leverage
Lakeshore's ROCE exceeded its ROE because the capital-employed measure benefits from strong operating profit and limited interest-bearing debt, although large cash balances can suppress overall equity returns
Liquidity improved on paper, with the current ratio rising from 1.8x in FY24 to 2.6x in FY26. The quality of current assets requires a closer view because trade receivables grew faster than revenue in FY26. Interest coverage is exceptionally high because finance costs are minimal. These ratios reduce solvency risk, but they do not remove the need for payer-level ageing analysis, capital-expenditure discipline and protection of the cash buffer
Industry Overview
Industry Drivers
Rising demand for tertiary and quaternary care
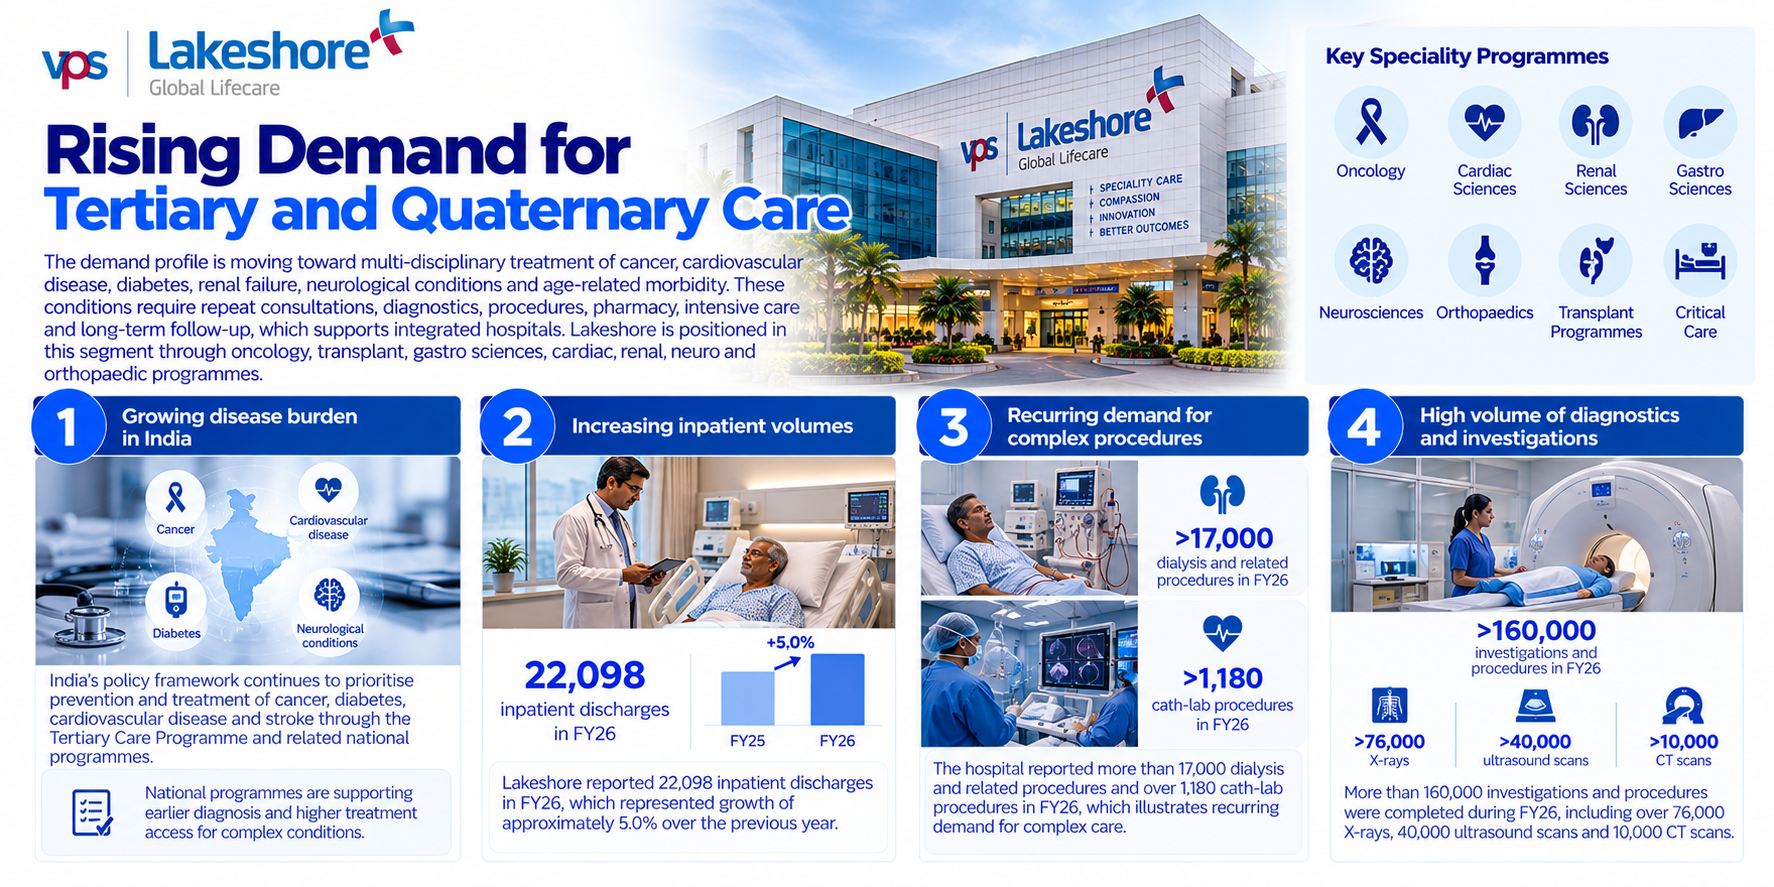
The demand profile is moving toward multi-disciplinary treatment of cancer, cardiovascular disease, diabetes, renal failure, neurological conditions and age-related morbidity. These conditions require repeat consultations, diagnostics, procedures, pharmacy, intensive care and long-term follow-up, which supports integrated hospitals. Lakeshore is positioned in this segment through oncology, transplant, gastro sciences, cardiac, renal, neuro and orthopaedic programmes. The advantage is not automatic because patients and referring doctors compare outcomes, specialist reputation, waiting times, affordability and insurer access.
The key drivers are:
India's policy framework continues to prioritise prevention and treatment of cancer, diabetes, cardiovascular disease and stroke through the Tertiary Care Programme and related national programmes
Lakeshore reported 22,098 inpatient discharges in FY26, which represented growth of approximately 5.0% over the previous year
The hospital reported more than 17,000 dialysis and related procedures and over 1,180 cath-lab procedures in FY26, which illustrates recurring demand for complex care
More than 160,000 investigations and procedures were completed during FY26, including over 76,000 X-rays, 40,000 ultrasound scans and 10,000 CT scans
Insurance penetration and cashless hospital access
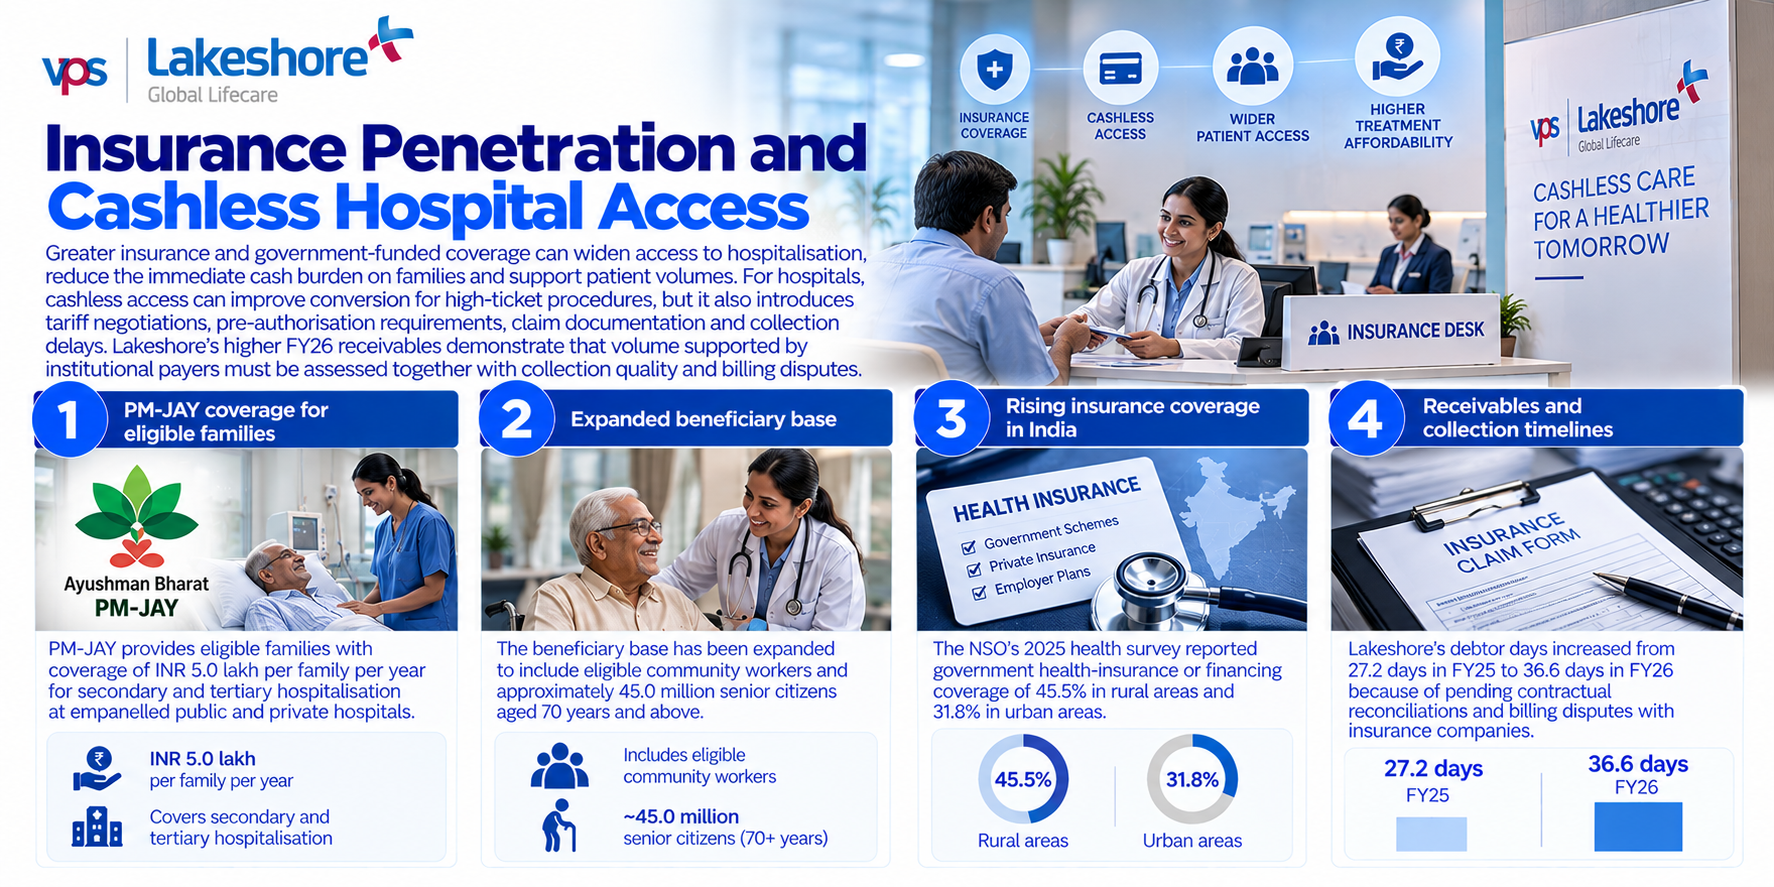
Greater insurance and government-funded coverage can widen access to secondary and tertiary hospitalisation, reduce the immediate cash burden on families and support patient volumes. For hospitals, cashless access can improve conversion for high-ticket procedures, but it also introduces tariff negotiations, pre-authorisation requirements, claim documentation and collection delays. Lakeshore's higher FY26 receivables demonstrate that volume supported by institutional payers must be assessed together with collection quality, billing disputes and the cost of carrying receivables.
The key drivers are:
PM-JAY provides eligible families with coverage of INR 5.0 lakh per family per year for secondary and tertiary hospitalisation at empanelled public and private hospitals
The beneficiary base has been expanded to include eligible community workers and approximately 45.0 million senior citizens aged 70 years and above
The NSO's 2025 health survey reported government health-insurance or financing coverage of 45.5% in rural areas and 31.8% in urban areas
Lakeshore's debtor days increased from 27.2 days in FY25 to 36.6 days in FY26 because of pending contractual reconciliations and billing disputes with insurance companies
Medical value tourism and regional referral flows
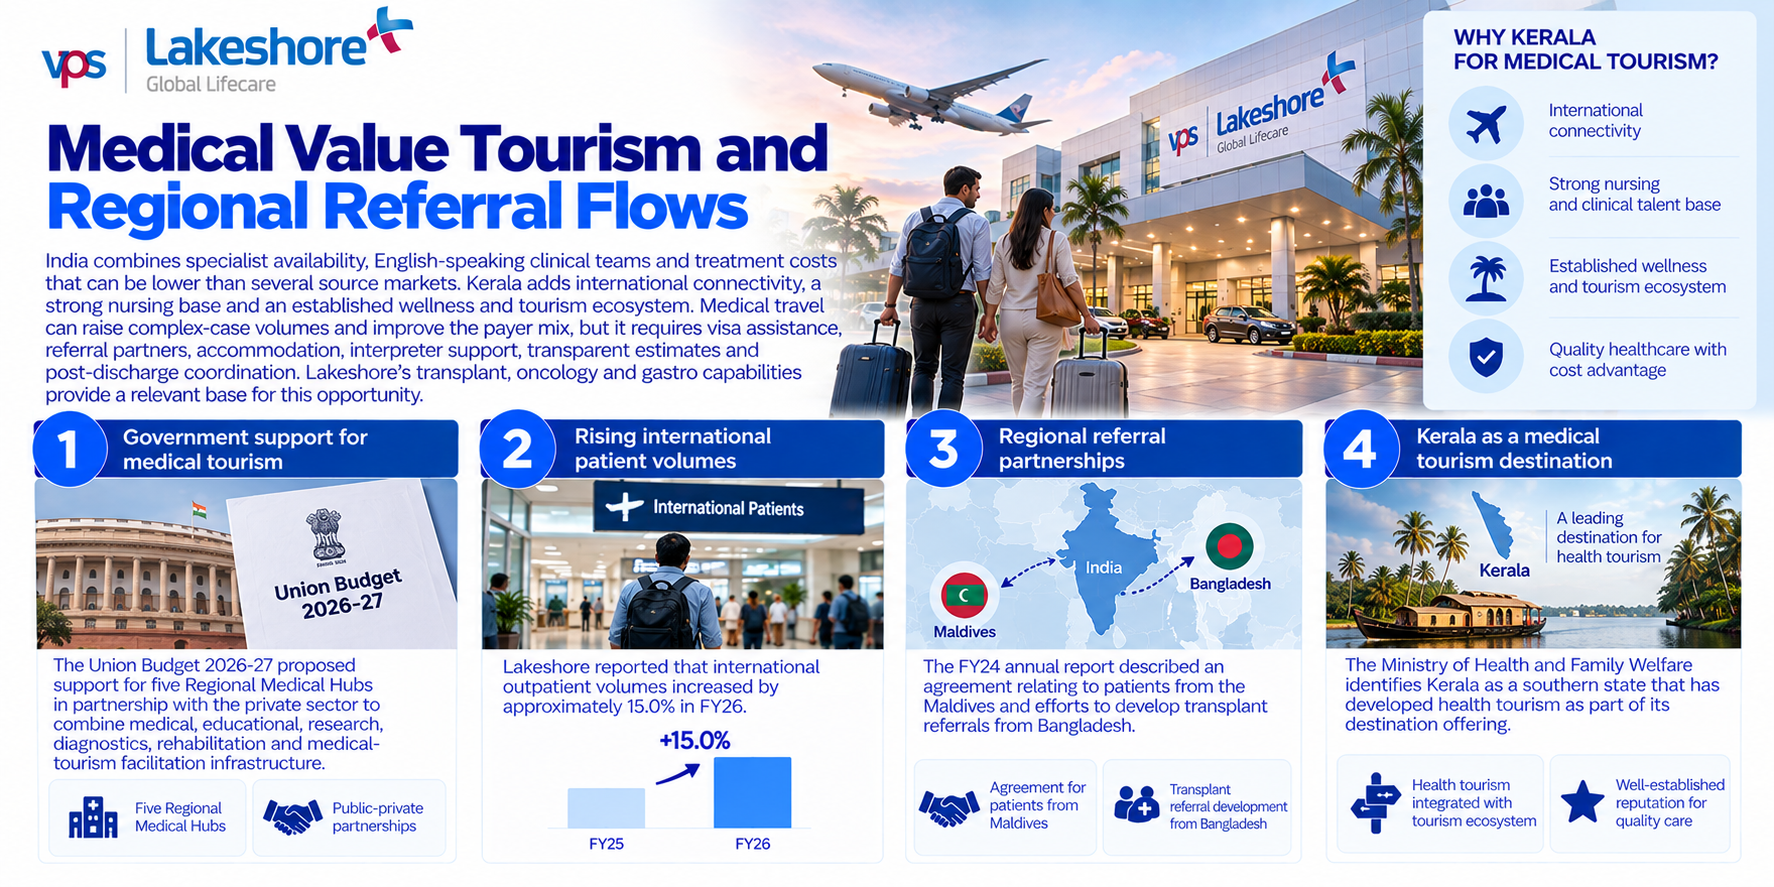
India combines specialist availability, English-speaking clinical teams and treatment costs that can be lower than several source markets. Kerala adds international connectivity, a strong nursing base and an established wellness and tourism ecosystem. Medical travel can raise complex-case volumes and improve the payer mix, but it requires visa assistance, referral partners, accommodation, interpreter support, transparent estimates and post-discharge coordination. Lakeshore's transplant, oncology and gastro capabilities provide a relevant base for this opportunity.
The key drivers are:
The Union Budget 2026-27 proposed support for five Regional Medical Hubs in partnership with the private sector to combine medical, educational, research, diagnostics, rehabilitation and medical-tourism facilitation infrastructure
Lakeshore reported that international outpatient volumes increased by approximately 15.0% in FY26
The FY24 annual report described an agreement relating to patients from the Maldives and efforts to develop transplant referrals from Bangladesh
The Ministry of Health and Family Welfare identifies Kerala as a southern state that has developed health tourism as part of its destination offering
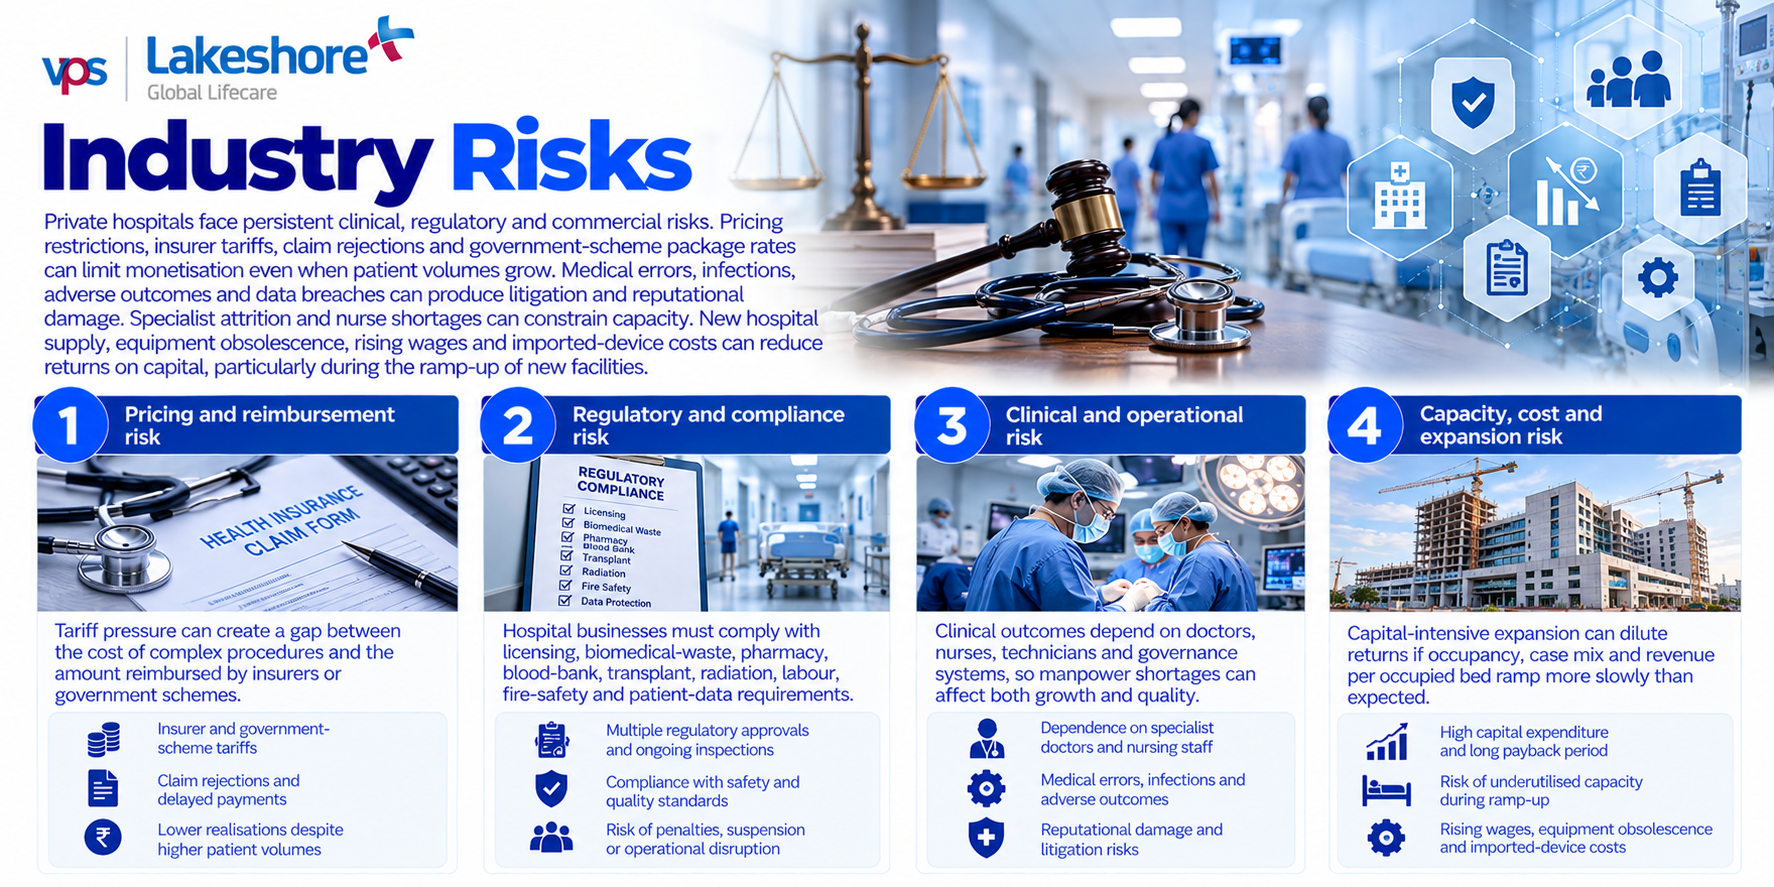
Industry risks
Private hospitals face persistent clinical, regulatory and commercial risks. Pricing restrictions, insurer tariffs, claim rejections and government-scheme package rates can limit monetisation even when patient volumes grow. Medical errors, infections, adverse outcomes and data breaches can produce litigation and reputational damage. Specialist attrition and nurse shortages can constrain capacity. New hospital supply, equipment obsolescence, rising wages and imported-device costs can reduce returns on capital, particularly during the ramp-up of new facilities.
The key risks are:
Tariff pressure can create a gap between the cost of complex procedures and the amount reimbursed by insurers or government schemes
Hospital businesses must comply with licensing, biomedical-waste, pharmacy, blood-bank, transplant, radiation, labour, fire-safety and patient-data requirements
Clinical outcomes depend on doctors, nurses, technicians and governance systems, so manpower shortages can affect both growth and quality
Capital-intensive expansion can dilute returns if occupancy, case mix and revenue per occupied bed ramp more slowly than expected
Government Policy Support
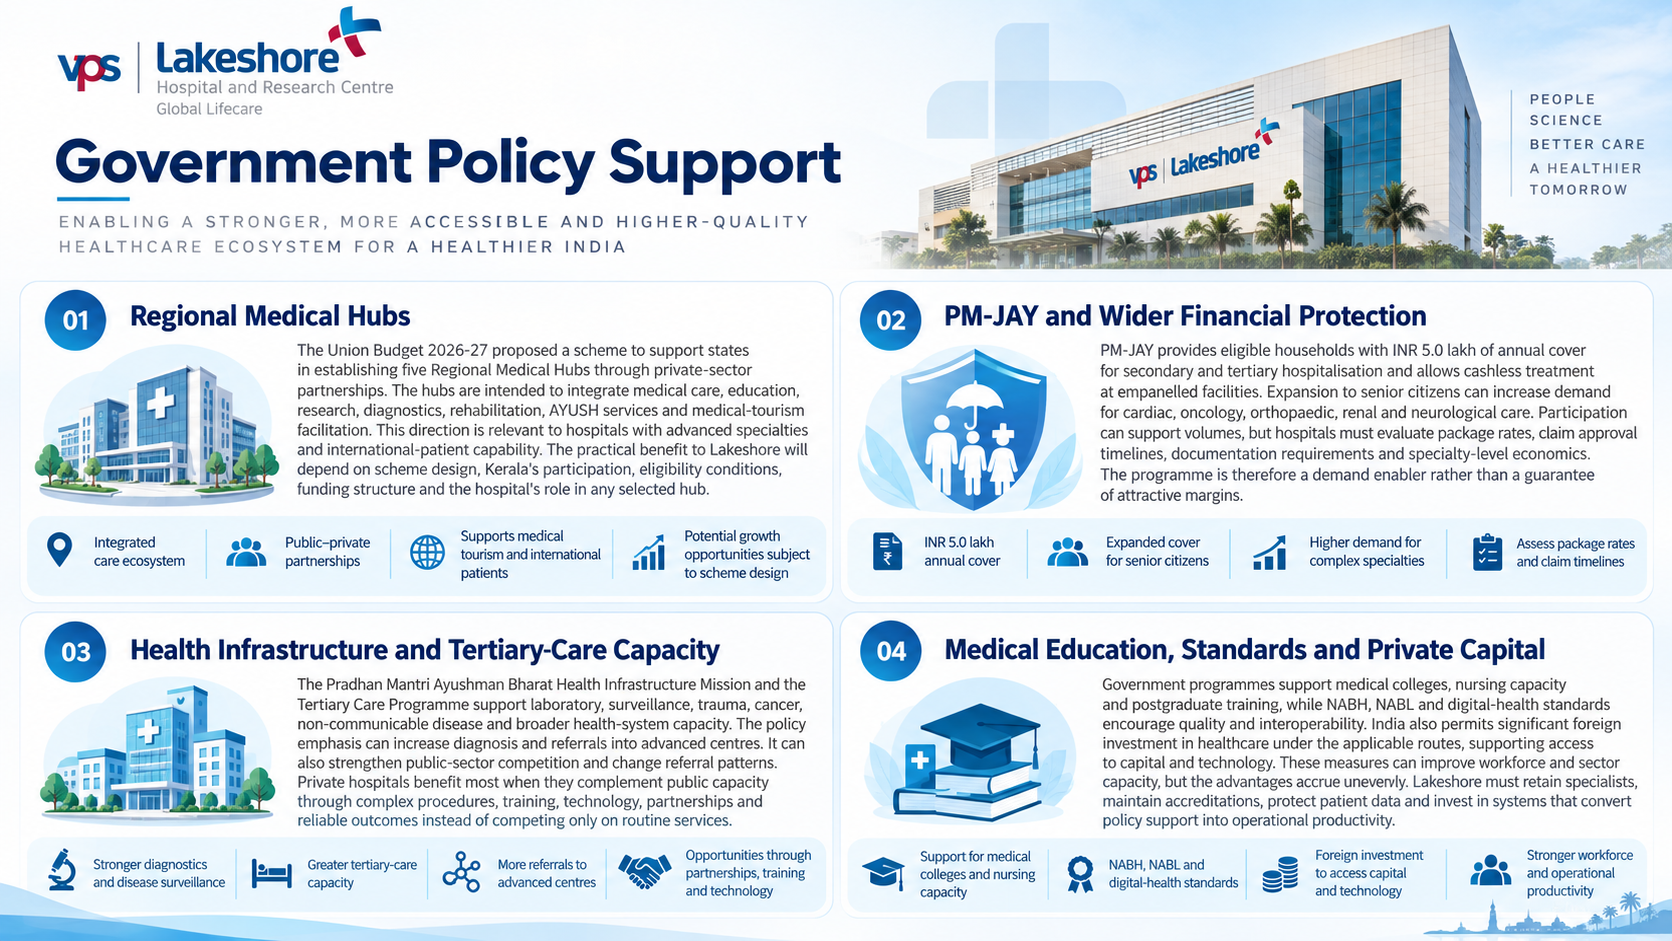
Regional Medical Hubs. The Union Budget 2026-27 proposed a scheme to support states in establishing five Regional Medical Hubs through private-sector partnerships. The hubs are intended to integrate medical care, education, research, diagnostics, rehabilitation, AYUSH services and medical-tourism facilitation. This direction is relevant to hospitals with advanced specialties and international-patient capability. The practical benefit to Lakeshore will depend on scheme design, Kerala's participation, eligibility conditions, funding structure and the hospital's role in any selected hub
PM-JAY and wider financial protection. PM-JAY provides eligible households with INR 5.0 lakh of annual cover for secondary and tertiary hospitalisation and allows cashless treatment at empanelled facilities. Expansion to senior citizens can increase demand for cardiac, oncology, orthopaedic, renal and neurological care. Participation can support volumes, but hospitals must evaluate package rates, claim approval timelines, documentation requirements and specialty-level economics. The programme is therefore a demand enabler rather than a guarantee of attractive margins
Health infrastructure and tertiary-care capacity. The Pradhan Mantri Ayushman Bharat Health Infrastructure Mission and the Tertiary Care Programme support laboratory, surveillance, trauma, cancer, non-communicable disease and broader health-system capacity. The policy emphasis can increase diagnosis and referrals into advanced centres. It can also strengthen public-sector competition and change referral patterns. Private hospitals benefit most when they complement public capacity through complex procedures, training, technology, partnerships and reliable outcomes instead of competing only on routine services
Medical education, standards and private capital. Government programmes support medical colleges, nursing capacity and postgraduate training, while NABH, NABL and digital-health standards encourage quality and interoperability. India also permits significant foreign investment in healthcare under the applicable routes, supporting access to capital and technology. These measures can improve workforce and sector capacity, but the advantages accrue unevenly. Lakeshore must retain specialists, maintain accreditations, protect patient data and invest in systems that convert policy support into operational productivity
- Overview
- Business
- Financial Highlights
- Industry Overview
- Documentation
Get the Preqt App and keep in touch around the clock!
 Monitor your investments in real-time.
- Receive tailored deal suggestions.
- Get real-time updates and alerts.